Innovation strategy: economic evidence paper
Summary of the theory and selected evidence on the role of innovation and its drivers in generating economic growth and Scotland’s innovation performance to provide context for and inform the development of Scotland’s National Innovation Strategy.
4. Scotland's Recent Innovation Performance
There are various measures for tracking innovation in the economy. This section considers some of the main measures and shows that Scotland has a mixed performance on the international stage in terms of innovation, with areas of strength such as higher education and business spending on research and development, but also some challenges including the proportion of firms innovating and in terms of innovation outputs including patent and trademark applications.
4.1 Expenditure on Research and Development
4.1.1 Gross Expenditure on Research and Development
Gross Expenditure[30] on Research and Development (GERD) comprises R&D undertaken by the Business Enterprise (BERD), Higher Education (HERD), Government (GovERD) and Private Non-Profit (PNP) sectors.
Box 1: Changes to ONS research and development statistics
The Office for National Statistics are currently leading a large-scale project to transform R&D statistics which has significantly affected BERD and HERD data and therefore the overall GERD figures. The new BERD data uses an improved estimation methodology, to better account for small businesses, resulting in significant uplifts to the BERD spend (effectively doubling previous estimates for Scotland). The source of the HERD estimates has changed, resulting in uplifts to the HERD spend estimates (around 40% up on previous estimates). These methodological changes have been implemented for the period 2018 onwards, meaning that comparisons of estimates for GERD, HERD and BERD before 2018 are not possible. Further detail on these methodological changes is available in the Gross Expenditure on Research and Development, UK: 2020 publication.
There are several caveats associated with the new data which are important to bear in mind. Firstly, there is currently uncertainty around the robustness of the sub-UK BERD data, including that for Scotland. As a result, ONS has temporarily paused the National Statistics status of the sub-UK data. Secondly, the R&D spend values are expressed as a share of GDP to enable cross country comparisons. However, it is important to note that GDP was particularly low in 2020 as a result of the COVID-19 pandemic. And therefore, the share of GDP measures are particularly high in 2020. In addition, the GDP series have not yet been adjusted to incorporate the R&D spend uplifts. However, this is a lesser issue given the scale of GDP against R&D spend.
In 2020, GERD spend in Scotland was estimated at £4,795 million, an increase of 1.2% (£58 million) since 2019. In comparison, UK GERD increased by 3.5% over the same period.
Looking at the four components of GERD, BERD spend accounted for the highest proportion of total GERD in Scotland in 2020 at 61%, followed by HERD (34%), GovERD (4%) and PNP (1%).
GERD represented an estimated 3.13% of GDP in Scotland in 2020, compared to 2.96% in the UK as a whole. Scotland's GERD as a percentage of GDP was above that of the EU-27 average (2.19%) and the OECD average (2.67%) in 2020. As a result, Scotland's GERD as a share of GDP ranked in the top quartile of the OECD countries in 2020 (Figure 4). However, it is important to note that GDP was particularly low in 2020 as a result of the Covid-19 pandemic.
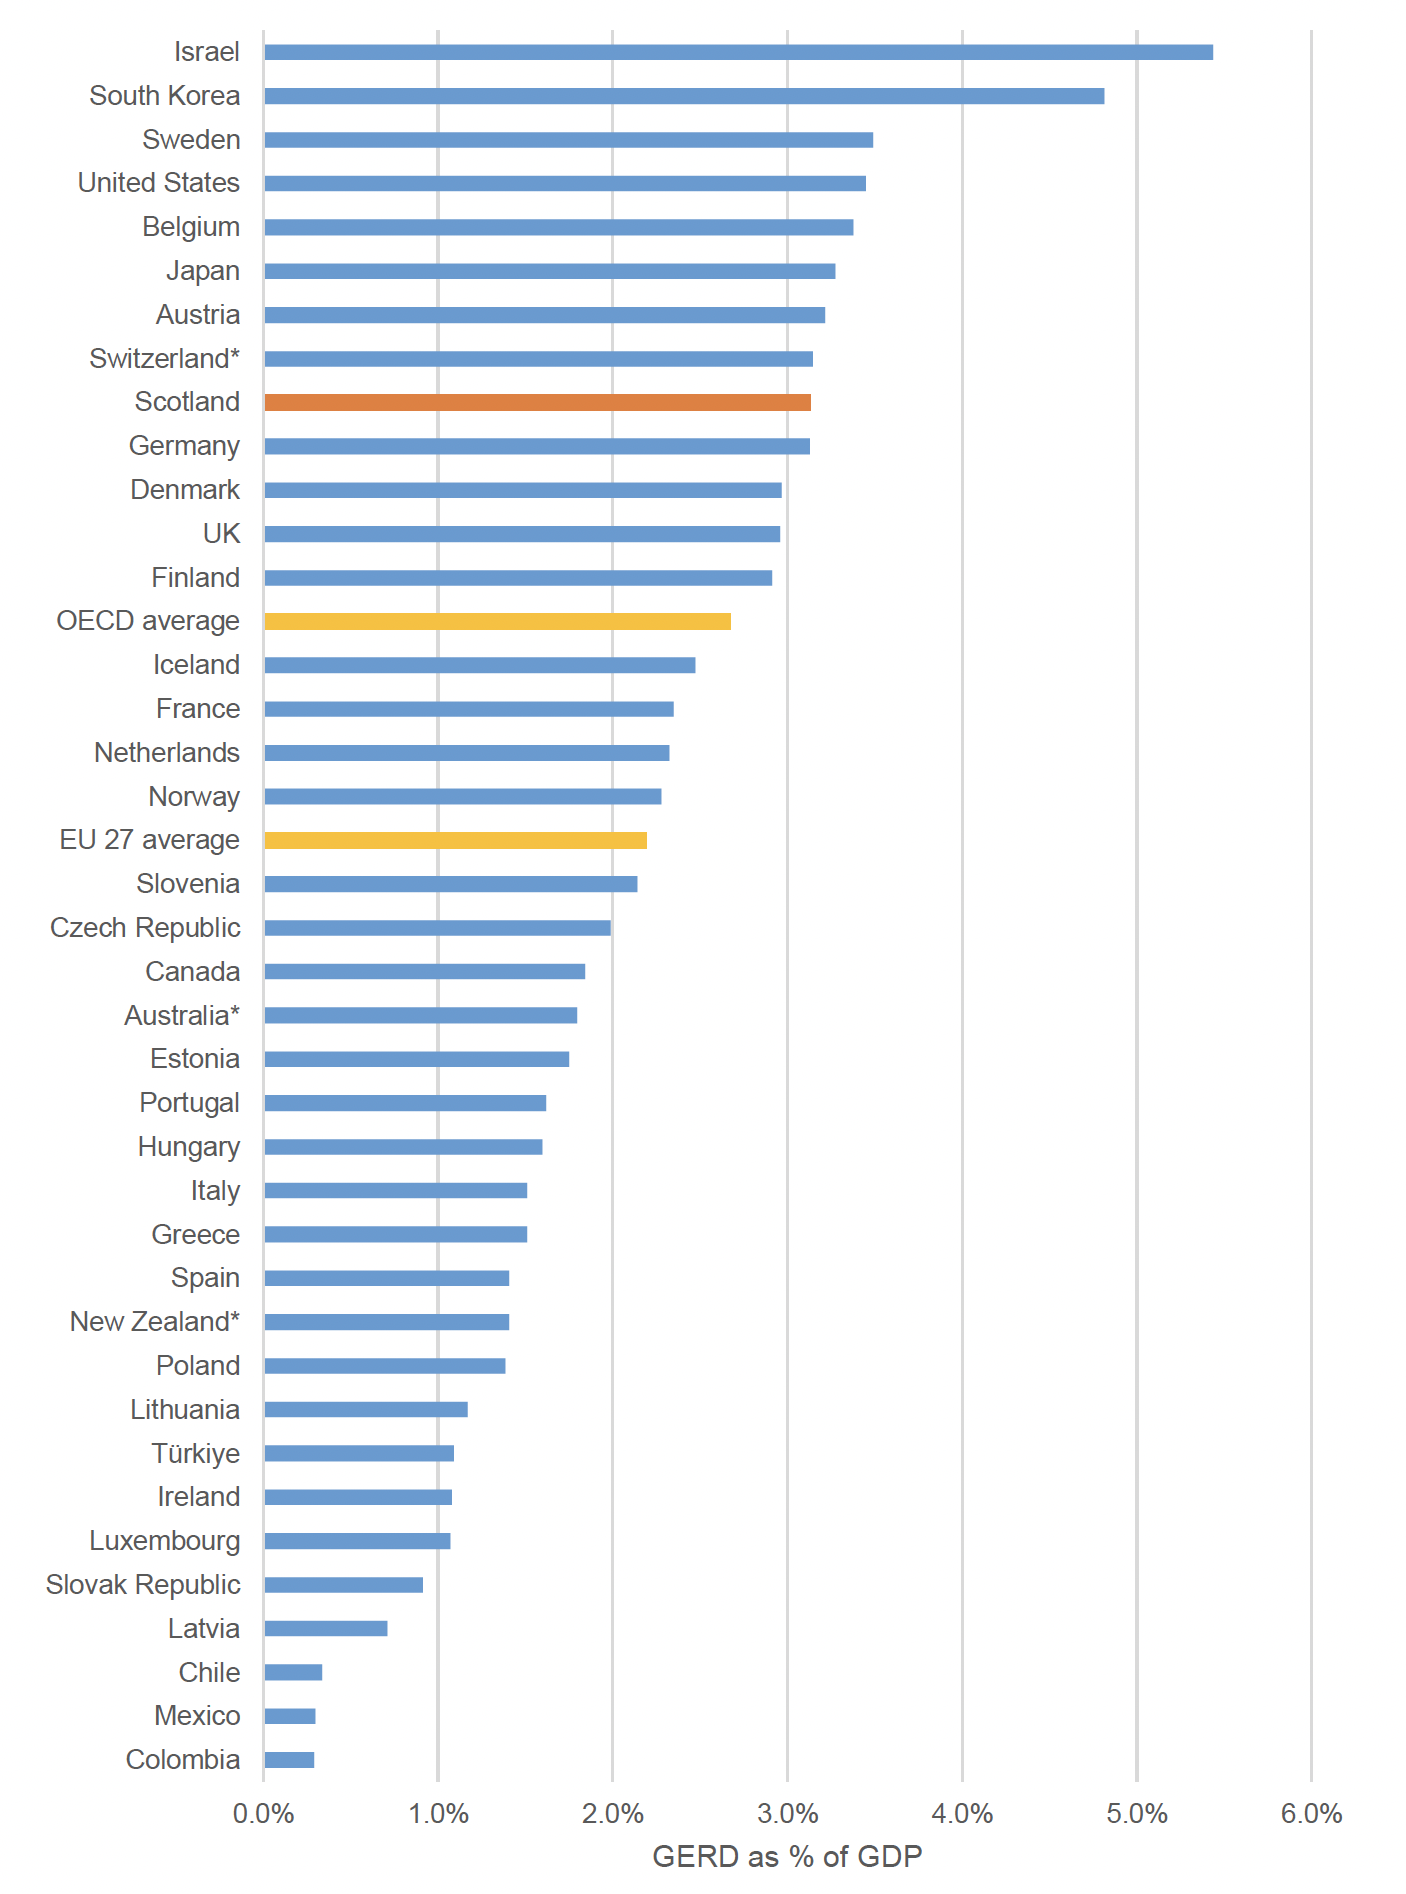
Source: GERD Scotland 2020
Note: *For these OECD countries, 2020 data is not yet available and so 2019 data used.
4.1.2 Business Enterprise Research and Development
As noted in Box 1, the methodology used to produce the BERD spend estimates has been improved to better represent smaller businesses. However, there is currently uncertainty around the robustness of the estimates for Scotland.
The latest data shows that BERD spend in Scotland was estimated at £3,121 million in 2021, an increase of £194 million (6.6%) since 2020 and £356 million since 2018[31].
BERD expenditure represented an estimated 1.86% of Scottish GDP in 2021, which was a decrease from 1.91% in 2020. However, it is important to note that GDP was particularly low in 2020 as a result of the COVID-19 pandemic. In 2021, BERD accounted for a lower proportion of GDP in Scotland than in the UK as a whole (2.00%).
In 2020[32], Scotland's BERD spend as a share of GDP (1.91%) ranked in the second quartile of the OECD countries, above the EU average (1.43%) but below the average for OECD countries (1.92%) and the UK (2.11%).
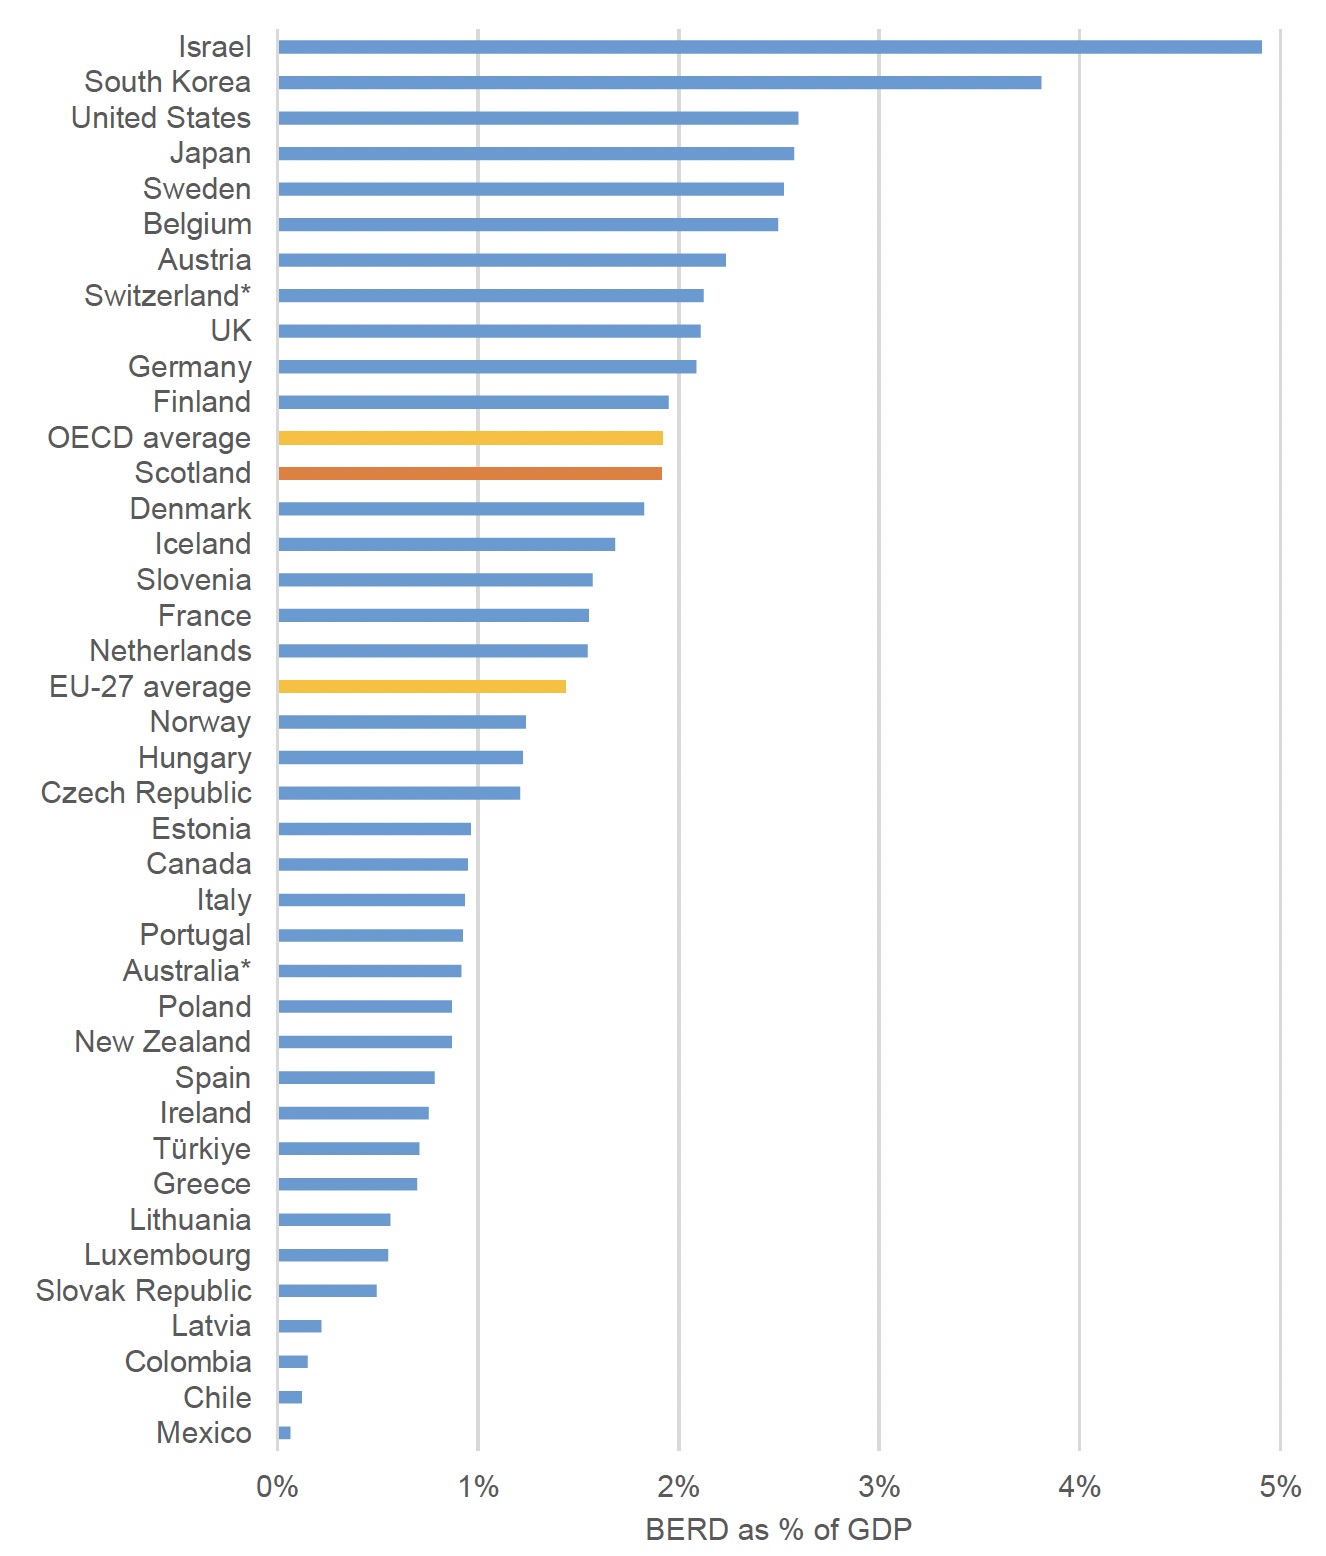
Source: Gross Expenditure on Research and Development Scotland 2020
Note: *For these OECD countries, 2020 data is not yet available and so 2019 data used
4.1.3 Higher Education Research and Development
Scotland's HERD spend was £1,623 million in 2020, 1.2% higher than in 2019. In contrast the UK's HERD decreased by -0.9% over this period.
In 2020, Scotland ranked top among the OECD countries for HERD spend as a percentage of GDP. HERD spend as a share of GDP in Scotland was 1.06% compared to 0.43% in the OECD as a whole.
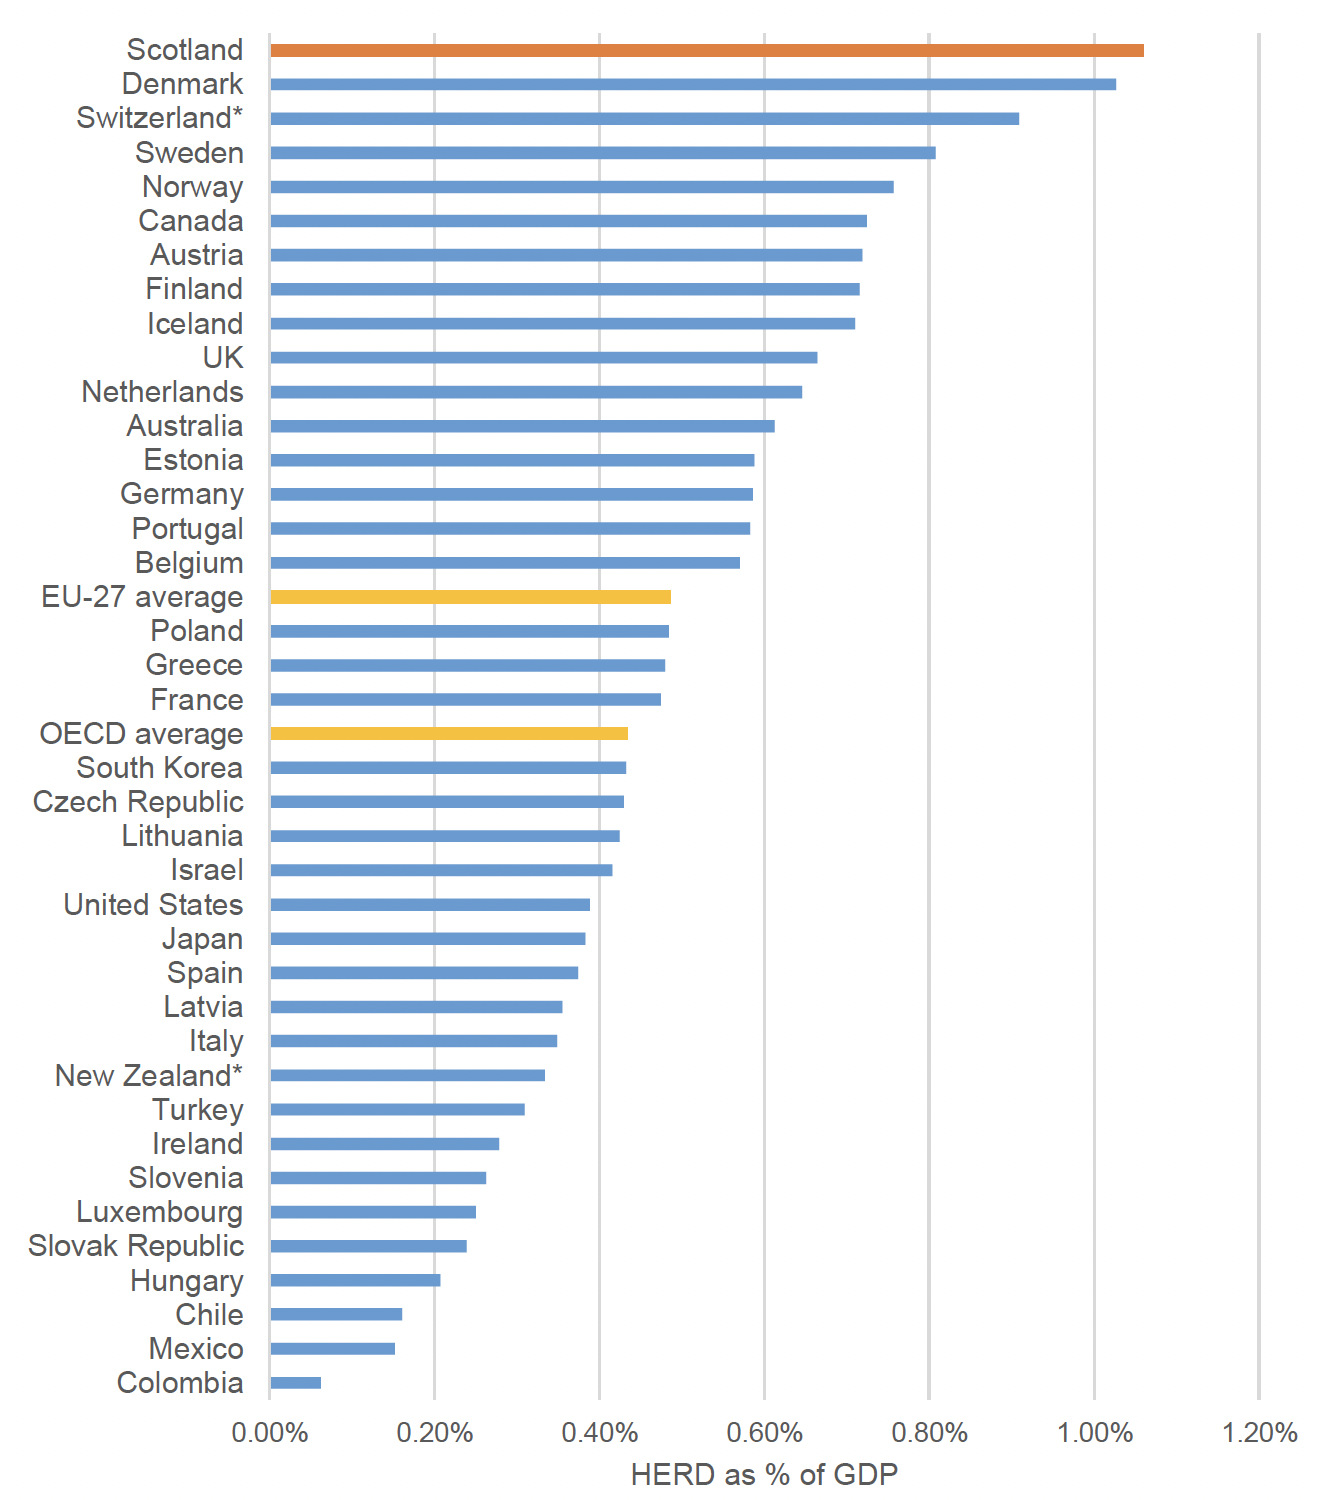
Source: Gross Expenditure on Research and Development Scotland 2019
Note: *For these OECD countries, 2020 data is not yet available and so 2019 data used
4.1.4 Government Expenditure on Research and Development
In 2020, Government Expenditure on R&D (GovERD) in Scotland was £202 million, 9.8% (£18 million) higher than in 2019.
GovERD as a share of GDP was 0.13% for Scotland and 0.15% for the UK in 2020. Comparing internationally, Scotland ranked in the third quartile for GovERD as share of GDP (0.13%), lower the EU and OECD averages (0.26%).
4.1.5 Private Non-profit Research and Development
In Scotland, Private-Non-Profit (PNP) R&D spend was estimated at £43 million in 2020, 5.2% of the UK total and 0.03% of GDP.
The above evidence suggests Scotland performs very strongly on the international stage in terms of its higher education R&D spend and strongly in terms of its business R&D spend but under performs in terms of Government R&D spending.
4.2 Prevalence of Innovation Activity in the Business Base
The Scottish Government's National Performance Framework[33] tracks the level of innovation activity within Scotland's business base using data on the proportion of businesses that are 'innovation active'[34] from the UK Innovation Survey[35]. In 2018-20 (the latest period for which data is available), the share of 'innovation active' businesses in Scotland was 39.0%, lower than in the UK as a whole (44.9%). Between 2016-18 and 2018-20, innovation activity rose in both Scotland (+6.8 percentage points) and the UK (+7.3 percentage points).
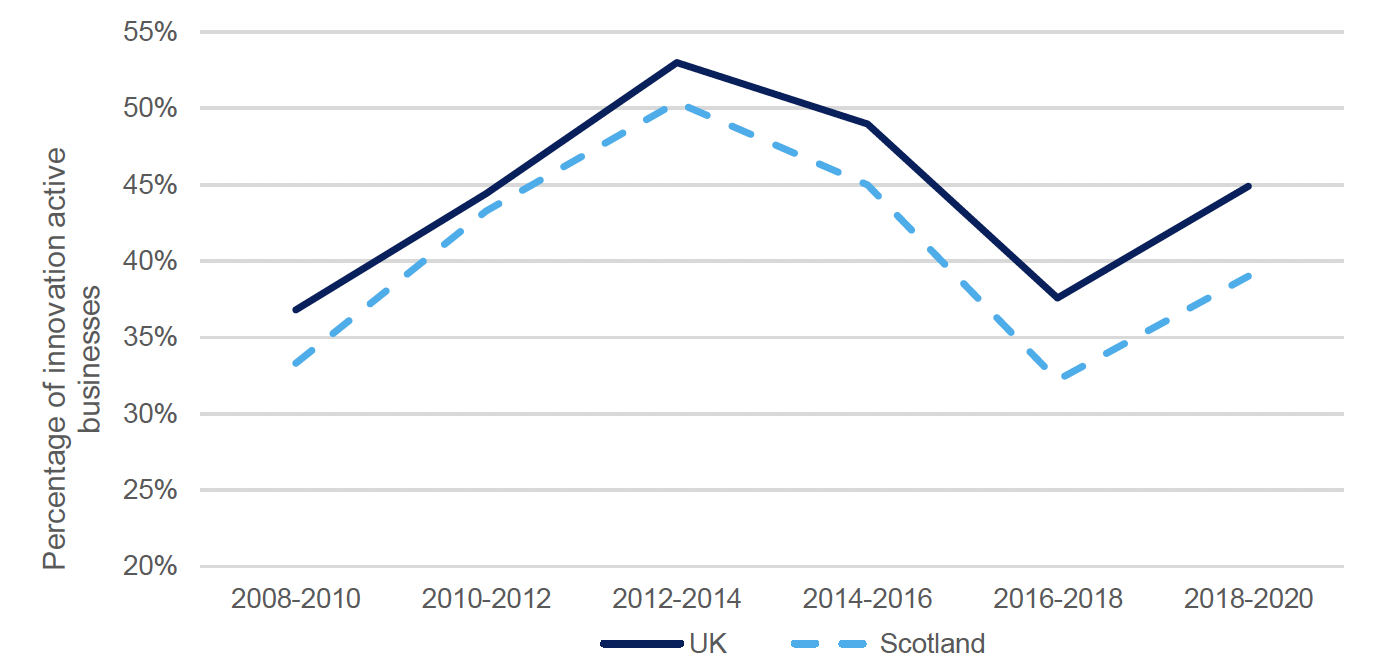
Source: UK Innovation Survey 2019 – Results for Scotland
When ranked against the UK and EU-27 countries[36], Scotland ranked 19th in 2018-20, placing it in the middle of the third quartile. The share of innovation active enterprises in Scotland (52.0%) was just below the EU-27 average (52.7%)[37].
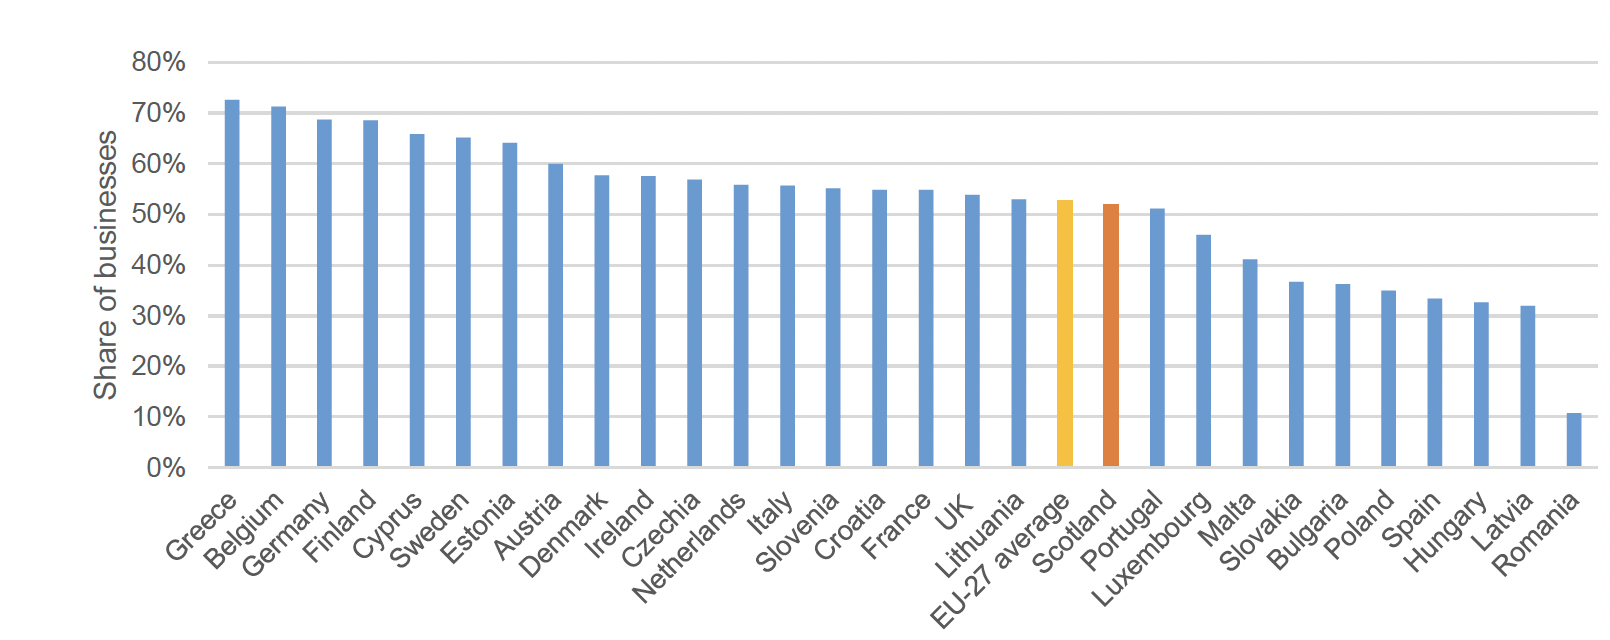
Source: Eurostat (based on Community Innovation Survey) and UKIS 2021
In terms of business size band, in 2018-2020 small (10-49 employees) businesses in Scotland were least likely to be innovation active (36.5%) and businesses with 100-249 employees were most likely to be innovation active (57.5%).
In terms of types of innovation, in 2018-2020, more businesses in Scotland were product innovators at 16.8%, than process innovators, at 13.3%. The UK outperformed Scotland in both the proportion of firms undertaking product innovation (20.5%) and process innovation (16.2%).
Innovation activity varies by sector. In 2018-20, businesses in the 'Scientific Research and Development' sector were the most likely to be innovation active in Scotland (79.3%). Businesses in the 'Real Estate Activities' (24.0%) and 'Accommodation and Food Services' (24.2%) sectors were least likely to be innovation active.
Compared to the UK, Scotland has a higher proportion of innovation active businesses in sectors including 'financial intermediation', 'electricity, gas and water supply', 'computer and related activities/ICT' and 'scientific research and development'. However, it underperforms the UK as a whole in a range of other sectors, most notability 'real estate activities', 'manufacture of transport equipment' and 'manufacture of computer, electrical and optical equipment'.
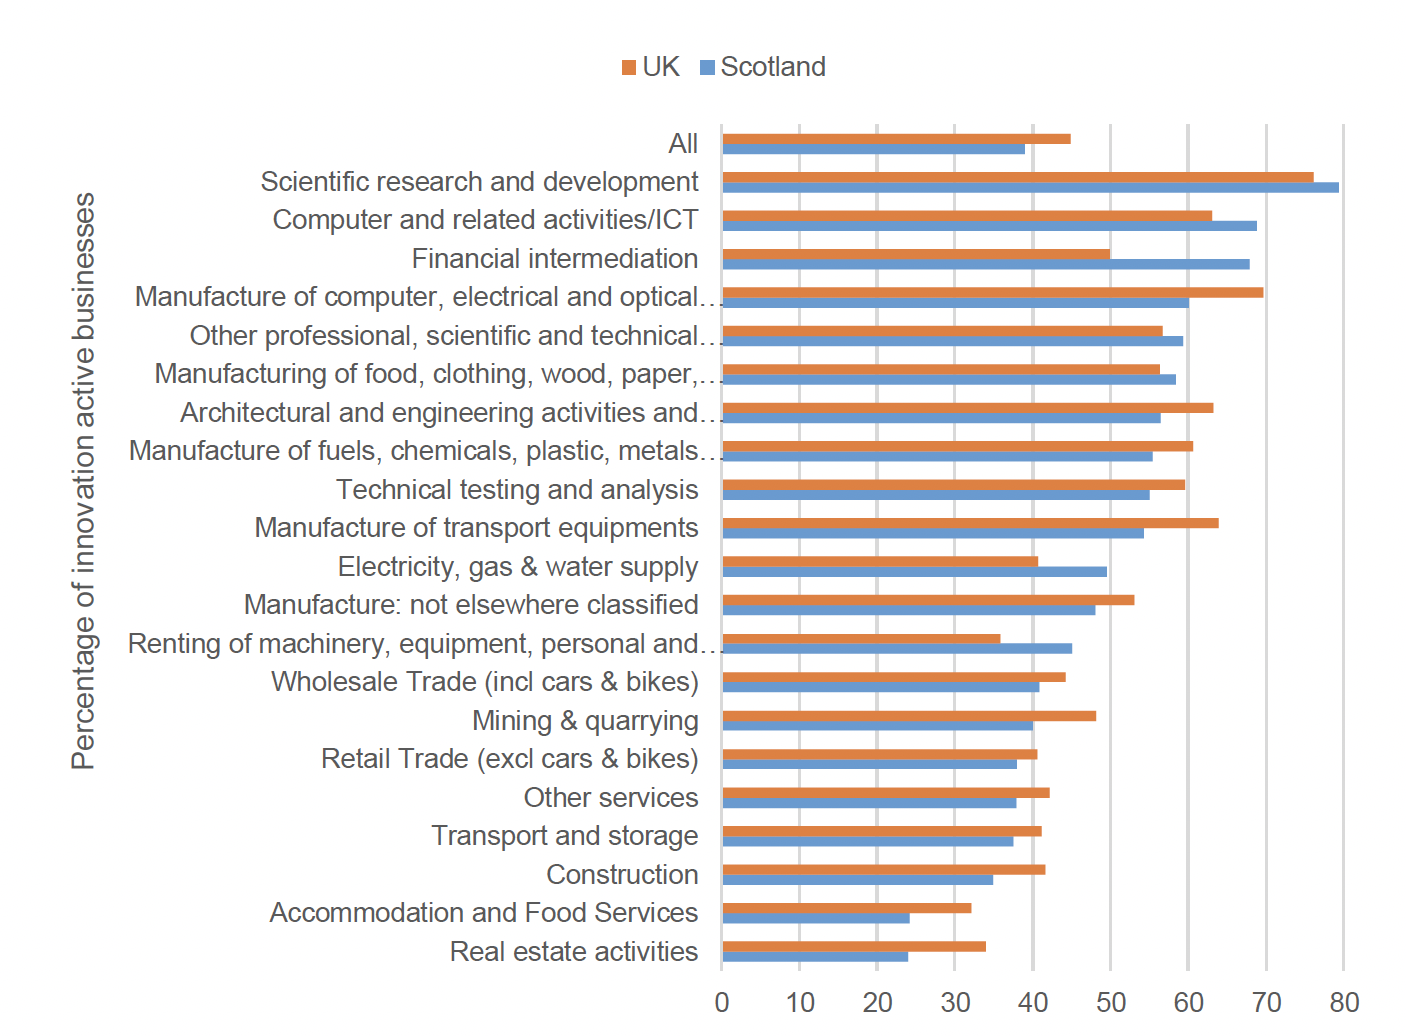
Source: Scottish Government, UK Innovation Survey 2021 – Results for Scotland
4.3 Broader Innovation Performance
The European Commission's Regional Innovation Scoreboard[39], which assesses the performance of 240 European regional innovation systems against 21 indicators, provides an insight into Scotland's key strengths and weaknesses in relation to innovation compared to the UK and EU. In 2021, Scotland was classified as a strong+ innovator, with its performance improving over time.
Of the 12 UK regions, Scotland ranked fifth, behind Southeast England, London, East England and South West England. Three UK regions (London, Southeast England and East England) were classified as innovation leaders with the remaining nine classified as strong innovators. Of the 240 European regions, Scotland ranked within the first quintile (43rd).
As shown the diagram below, Scotland has mixed performance in innovation when compared to the EU, with some areas of strength but also some notable challenges. Scotland's innovation performance exceeds the EU average in the following areas: tertiary education; lifelong learning; international scientific co-publications; most-cited publications; above average digital skills; R&D expenditure public sector; non-R&D innovation expenditure; innovation expenditures per person employed; innovative SMEs collaborating; public-private co-publications; and employment in innovative enterprises.
Scotland's innovation performance falls short of the EU average in the following areas: R&D expenditure business sector[40]; employed ICT specialists; product innovators; business process innovators; patent applications; trademark applications; design applications; employment in knowledge-intensive activities; and sales of innovative products.
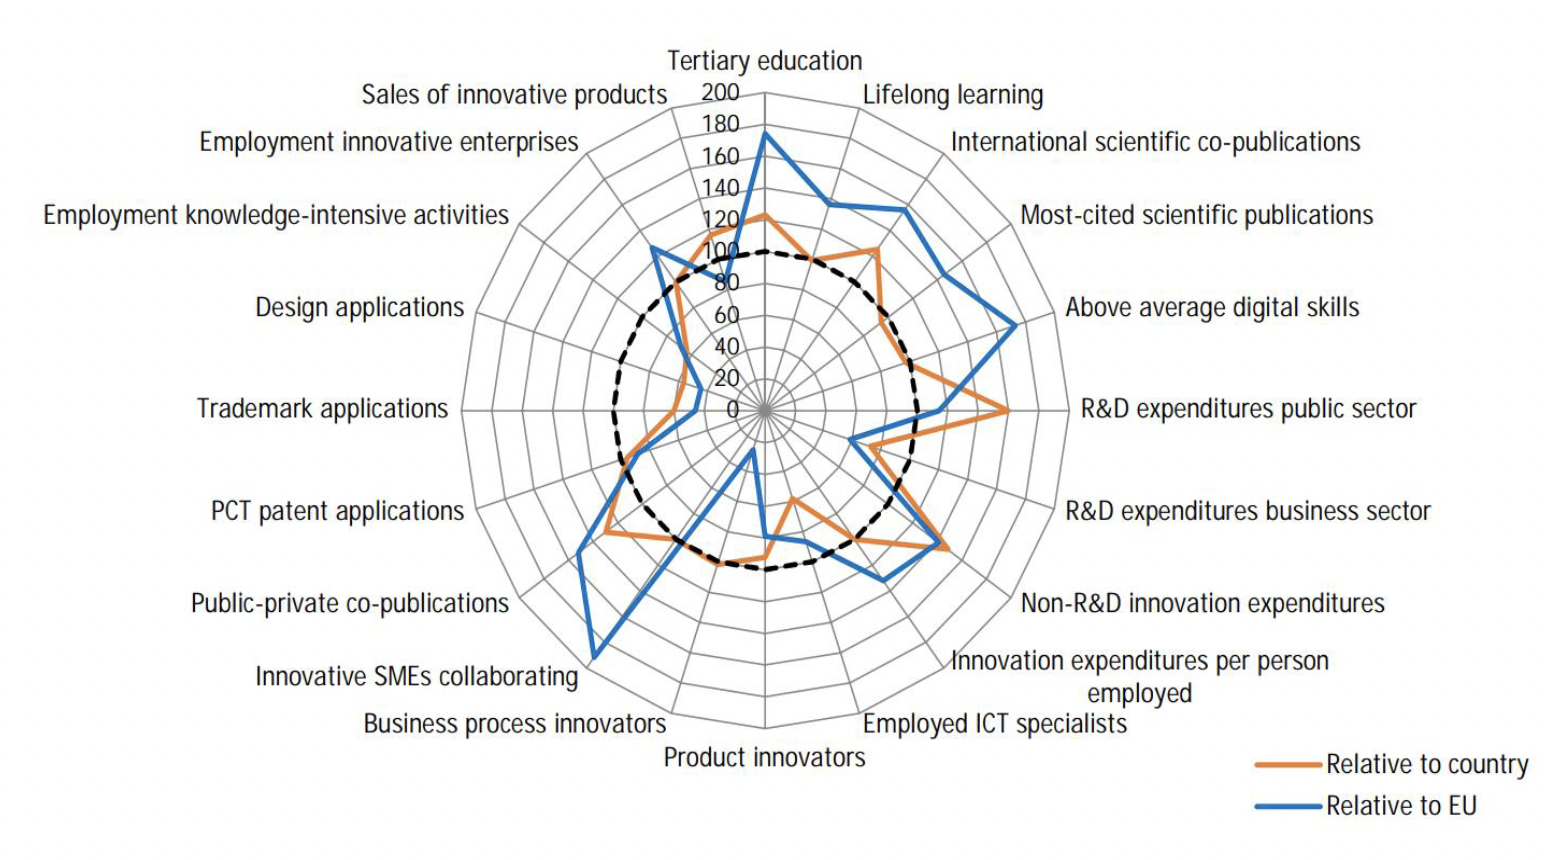
Source: European Commission's Regional Innovation Scoreboard 2021
Contact
Email: Innovation@Gov.Scot