Innovation strategy: economic evidence paper
Summary of the theory and selected evidence on the role of innovation and its drivers in generating economic growth and Scotland’s innovation performance to provide context for and inform the development of Scotland’s National Innovation Strategy.
5. Scotland's Sectoral Innovation Strengths – Analysis to Support the Choice of Priority Sectors
This section draws on existing evidence from a range of sources to identify sectors in which Scotland currently performs comparatively strongly on innovation and where it has the potential for further growth. It is anticipated that this analysis will be used alongside other analysis and expert advice from key stakeholders to identify a number of innovative technologies and economic clusters in which Scotland has the potential to be world leading.
The analysis draws on existing data to identify the sectors in which Scotland currently excels in and has the potential for further growth in three tiers:
- Business capabilities (closest to market): to identify sectors where businesses in Scotland currently perform most strongly in innovation. For this, we draw on Business Enterprise Research and Development (BERD) spend data and data on the proportion of innovation active businesses from the UK Innovation Survey. We also examine the relative proportion of risk capital and inward investment that sectors attract to provide an indication of which sectors have the most growth potential.
- Application of innovation into business: to identify the sectors where the application of innovation into business is highest. Here, we draw on analysis undertaken by NESTA which considers sectoral data on the level of patenting and business-higher education collaboration.
- Higher education sector capabilities (furthest from market): to identify the research areas in which Scottish higher education institutions (HEIs) currently excel in. For this, we draw on analysis undertaken by NESTA which considers how Scottish HEIs perform relative to UK HEIs on a range of research outputs including technical products, spin outs, patents and publications as well as data on the proportion of EU research funding secured by Scottish HEIs.
The strongest performing sectors are selected based on the extent to which they score highly across the metrics considered in each tier. If there is a desire to continue with this analysis, then one option might be to take a weighted composite indicator approach to further refine it.
It is important to consider the limitations of this analysis:
- The sectoral data from the existing official datasets used in this paper is not sufficiently disaggregated to identify sub-sectors at the level of detail required to identify 'niche' areas of expertise. For example, for the BERD and UKIS data, data is only available at the standard industrial classification (SIC) of economic activities division level or for groups of division level sectors. For this reason, this paper considers Scotland's innovation strengths in terms of broad sectors.
- The official data sources drawn on in this paper, by the nature of the way they are disaggregated at a sectoral level using SIC, do not provide sectoral breakdowns for emerging sectors that are not already an established part of Scotland's economy. It is therefore important that the data analysis is supplemented with expert advice to provide the required 'forward look' on the sectors in which Scotland could and would like to be world leading.
- The sector definitions (in terms of the SIC codes they comprise) across the sources used are not consistent. It is therefore difficult to draw out the sectors in which Scotland excels consistently across the different metrics.
- Data on higher education sector capabilities at the sectoral level is not currently available, although it is possible to read across to an extent from subject specialisms.
5.1 Business Capabilities
This section seeks to identify the sectors in which businesses in Scotland currently perform most strongly in innovation and those that have the greatest growth potential. This provides an indication of sectoral innovation strengths that is 'closest to the market'. It reviews evidence on sectoral R&D spending, innovation activity and investment secured and finds that Scotland's business innovation capabilities lie primarily in the following sectors: scientific R&D (part of life sciences); computing/ICT; financial and insurance activities; professional/scientific/technical activities, with strengths also in business services; architectural, engineering and technical activities; energy; food and drink; space; fin tech and health tech.
5.1.1 R&D Spending
As noted in section 2, investment in R&D is a central pillar of innovation. By seeking new knowledge through research, businesses innovate by developing, designing and enhancing products, services, technologies and processes.
Here, data on business enterprise research and development (BERD) spending as a proportion of national gross domestic product (GDP) has been used to analyse how the level of R&D undertaken by businesses across different sectors in Scotland compares internationally (in this case, with the 16 countries for which data was available[42]). This provides an indication of whether Scotland is over or under performing on the international stage in terms of business R&D relative to its size.
It is important to note that the BERD data used for this analysis has not been revised to take account of the methodological changes to BERD outlined in Box 1 in section 4. It is therefore not comparable with the BERD data discussed in section 4.1.2 and is subject to change. Currently only headline Scotland BERD spend figures for 2018 to 2021 are available - further breakdowns (including by sector) under the new methodology are not yet available.
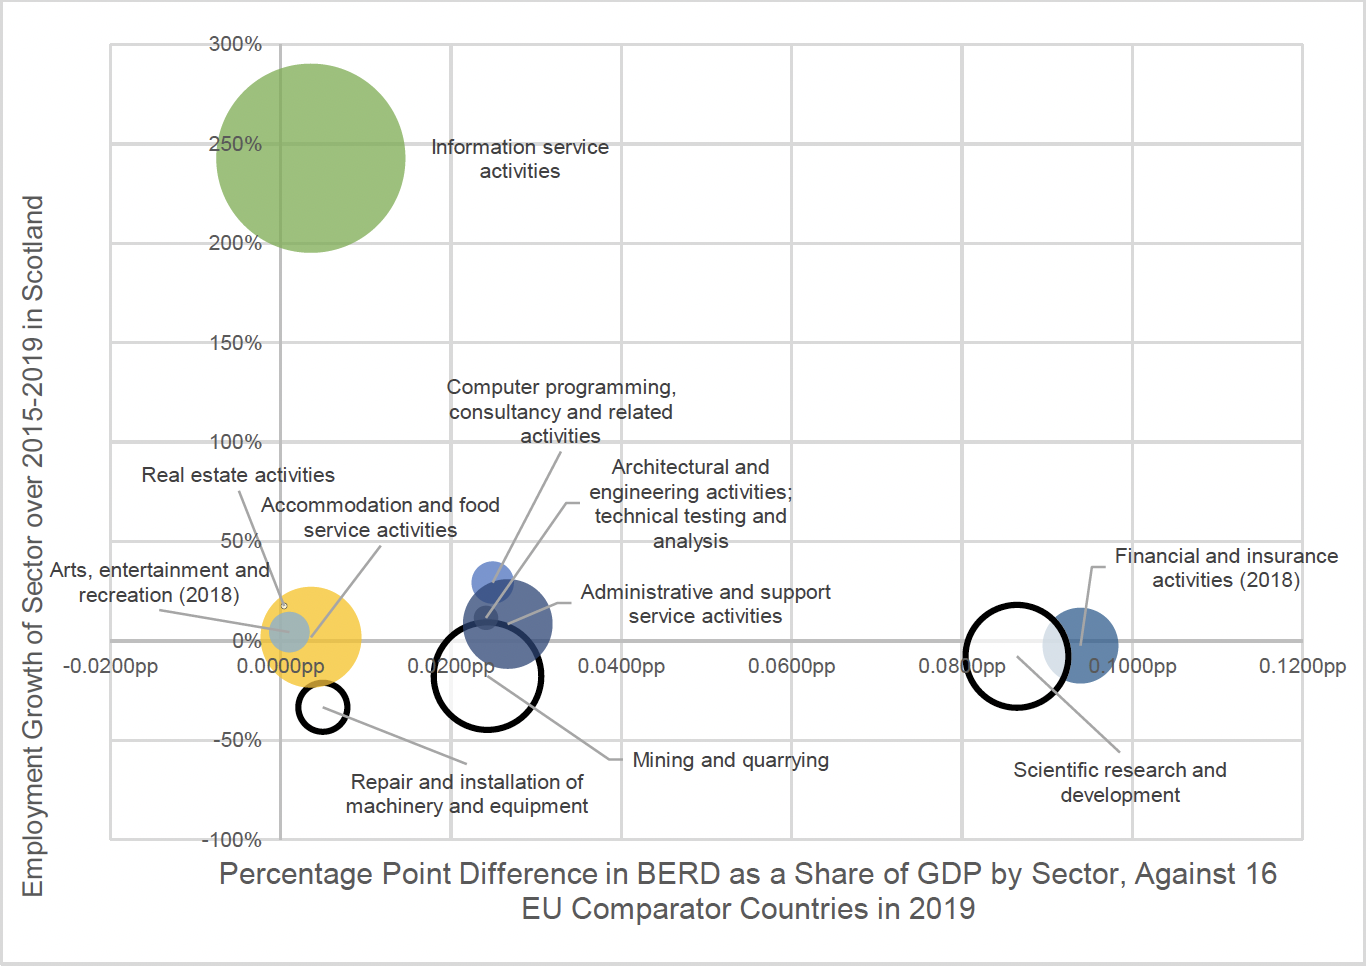
Figure 11 shows, for each sector[43], the percentage difference between BERD (as a proportion of GDP) for Scotland and the set of 16 other countries as a whole in 2019 (x-axis). This is mapped against the percentage difference in sectoral employment growth (percentage growth over the period 2015 – 2019[44]) for Scotland to add a dynamic element indicating potential future growth. Also shown is the level of GVA growth in each sector in Scotland (2015-2019), shown by the size of the bubble. Sectors which experienced negative GVA growth over 2015-2019 are shown as 'hollow bubbles' to indicate a fall in GVA. Together, these three elements can be taken to provide an indication of the sectors in which Scotland has a comparative advantage in business innovation.
To provide further detail, the data used in Figure 11 are set out in the table in Figure 12. Areas where the sector is performing positively are shaded green (varying from dark to light green to indicate strongest to weakest performance) and areas where the sector is performing negatively are shaded red.
Sources: Eurostat (EU BERD 2019) & Scottish Government Business enterprise research and development Scotland 2019 (BERD), Business Register and Employment Survey (BRES) 2015-2019 for Scottish Employment by sector, ABS (2015,2019) for GVA by division, QNAS (2015,2019) for GVA by Section.
| Sector |
Difference (% point) in BERD as a share of GDP between Scotland and comparator countries (2019) |
Employment growth, Scotland 2015-2019 (%) |
GVA growth, Scotland 2015-2019 (%) |
|---|---|---|---|
| Real estate activities (SIC 68) |
0.0004 |
17.6% |
-0.1% |
| Arts, entertainment and recreation (SIC 90 - 93)[46]* |
0.0010 |
4.5% |
3.4% |
| Information service activities (SIC 63) [47] |
0.0035 |
242.9% |
74.4% |
| Accommodation and food service activities (SIC 55, 56) |
0.0036 |
1.9% |
21.1% |
| Repair and installation of machinery and equipment (SIC 33) |
0.0049 |
-33.3% |
-6.3% |
| Architectural, engineering and technical activities (SIC 71) |
0.0241 |
11.7% |
1.2% |
| Mining and quarrying (SIC 5 - 9) |
0.0243 |
-17.6% |
-26.9% |
| Computer programming and consultancy activities (SIC 62) |
0.0249 |
29.4% |
3.7% |
| Administrative and support service activities (SIC 77 - 82)[48] |
0.0267 |
8.6% |
16.7% |
| Scientific R&D (part of Life sciences) (SIC 72) |
0.0865 |
-7.7% |
-24.7% |
| Financial and insurance activities (SIC 64 - 66)* |
0.0939 |
-2.3% |
11.9% |
* 2018 BERD figures used due to disclosure issues with 2019 data
The following sectors perform strongly relative to the international comparator countries average for BERD spend as a proportion of GDP:
- Scientific R&D (part of Life Sciences)[49]
- Financial and insurance activities
However, the Scientific R&D sector saw negative growth for both GVA and employment while the Financial and insurance activities sector saw negative employment growth.
The following sectors achieved less strong BERD performance in comparison, but were still positive. For the most part (with the exception of Mining and quarrying and Repair and installation of machinery and equipment), these sectors also saw positive GVA and employment growth:
- Administrative and support service activities
- Computer programming and consultancy activities
- Mining and quarrying
- Architectural, engineering and technical activities
- Information service activities
- Arts, entertainment and recreation
- Real estate activities
5.1.2 Innovation Active Businesses
R&D is only one component of innovation. To provide a wider indication of Scotland's sectoral strengths in business innovation, sectoral data on the proportion of innovation active businesses[50] from the UK Innovation Survey[51]is used to determine the sectors in which Scotland has exhibited the highest growth in the innovation active businesses over recent years and where Scotland outperforms the UK in the latest period (2018-20) (Figure 13). Only sectors with around 50% or more innovation active businesses in the latest period are shown to focus on the most innovative sectors. Sectors where Scotland has both a positive average growth rate and outperforms the UK in the latest period are shown in green.
The analysis shows that Scotland performs strongly in terms of the proportion of innovation active businesses both in terms of growth over time and compared to the UK in the following sectors:
- Financial and insurance activities
- Computer and related activities/ICT[52]
- Scientific R&D (part of Life sciences)
- Other professional, scientific and technical activities[53]
These sectors also saw the highest proportion of innovation active businesses in the latest period.
In addition, Scotland performs strongly relative to the UK in electricity, gas and water supply (SIC 35-39) although the sector's average growth rate in the proportion of innovation-active firms was moderately negative.
| Sector |
Percentage of innovation active businesses, Scotland |
Performance relative to UK in 2018-20 (% point difference) |
||||
|---|---|---|---|---|---|---|
| 2012-2014 |
2014-2016 |
2016-2018 |
2018-2020 |
Average growth rate (2012-14 to 2018-20) |
||
| Scientific R&D (SIC 72) |
61.9 |
79.4 |
70.2 |
79.3 |
9.9% |
3.3 |
| Computer and related activities/ICT (SIC 58,62&63)[54] |
52.7 |
81.2 |
61 |
68.8 |
14.0% |
5.8 |
| Financial and insurance activities (SIC 64-66) |
67.8 |
46.3 |
28 |
67.9 |
23.8% |
18.0 |
| Manufacture of computer, electrical and optical equipment (SIC 26-28) |
60.1 |
69.3 |
54.8 |
60 |
1.3% |
-9.6 |
| Other professional, scientific and technical activities (SIC 74)[55] |
73.1 |
51.5 |
38 |
59.3 |
0.1% |
2.6 |
| Manufacturing of food, clothing, wood, paper, publish & print (SIC 10-18) |
76.9 |
62 |
48.1 |
58.4 |
-6.8% |
2.1 |
| Architectural, engineering and technical activities (SIC 71.1) |
63.1 |
70.3 |
57.3 |
56.5 |
-2.8% |
-6.8 |
| Manufacture of fuels, chemicals, plastic, metals and minerals (SIC 19-25) |
51.5 |
60.7 |
50 |
55.4 |
3.7% |
-5.2 |
| Technical testing and analysis (SIC 71.2) |
[c] |
95 |
80 |
55.1 |
[c] |
-4.6 |
| Manufacture of transport equipment (SIC 29-30) |
[c] |
56.6 |
[c] |
54.3 |
[c] |
-9.6 |
| Electricity, gas & water supply (SIC 35-39) |
59.2 |
47.3 |
35.1 |
49.6 |
-1.5% |
8.9 |
Source: UK Innovation Survey 2021: Results for Scotland
5.1.3 Investment: Risk Capital
While the analysis of R&D investment and innovation active businesses above primarily provides an indication of Scotland's current sectoral strengths in innovation, it is important to consider what sectors have the most growth potential. The availability of early-stage equity investment is an indicator of a strong business environment. It is a vital source of finance for start-ups and rapidly growing businesses looking to bring new technologies and innovative products and services to the market. Sectors attracting significant amounts of early-stage equity investment (risk capital) may therefore be seen to be those in which the market is signalling anticipation of bright future growth prospects.
Scottish Enterprise analysis[56] of Beauhurst data on the number of early-stage equity deals across sectors[57] in Scotland finds that the top three sectors in Scotland for risk capital have been consistent over the last six years. These are:
- Digital and IT
- Business Services
- Technology and Engineering
And to a lesser extent:
- Energy including renewables
- Food and drink
- Life sciences
In 2021, Digital and IT accounted for the largest share of deals at 26%, followed by Business Services (22%) and Technology and Engineering (20%). The remaining deals were spread across a range of sectors with Food and Drink and Life Sciences well represented alongside emerging areas such as Renewables, Fintech and Aerospace and Satellites.
| 2016 | 2017 | 2018 | 2019 | 2020 | 2021 | |
|---|---|---|---|---|---|---|
| SE - Aerospace and Satelites | 4 | 7 | 1 | 2 | 7 | 12 |
| SE - Business Services | 104 | 165 | 140 | 185 | 164 | 162 |
| SE - Digital & IT | 153 | 200 | 203 | 228 | 243 | 193 |
| SE - Energy-Other | 20 | 20 | 21 | 21 | 26 | 16 |
| SE - FinTech | 11 | 16 | 13 | 21 | 23 | 21 |
| SE - Food & Drink | 43 | 56 | 66 | 58 | 64 | 67 |
| SE - Life Sciences | 34 | 59 | 48 | 23 | 61 | 50 |
| SE - Oil & Gas | 9 | 19 | 15 | 23 | 22 | 11 |
| SE - Other | 23 | 29 | 23 | 25 | 33 | 32 |
| SE - Renewable Energy | 15 | 19 | 14 | 22 | 20 | 24 |
| SE - Technology and Engineering | 90 | 141 | 115 | 165 | 155 | 145 |
Source: Scottish Enterprise, July 2022, Investing in Ambition: Scotland's Risk Capital Market in Context 2021
5.1.4 Investment: Inward Investment
As noted in section 2, there are strong links between innovation and inward investment, through knowledge exchange, technological diffusion, competition effects and supply chain linkages[58]. It is therefore important to consider which sectors Scotland performs most strongly in attracting foreign direct investment (FDI) to inform the choice of sectors for the Innovation Strategy.
Shaping Scotland's Economy: Inward Investment Plan,[59] published in October 2020, analysed Scotland's strengths in attracting FDI relative to European flows, then mapped these sectors according to their potential wider economic impacts, such as in supply chain impacts and innovation (see Figure 5 overleaf). This used a bespoke global database of FDI (fDi Markets) which allowed for detailed sectoral analysis. The following sectors were selected, following discussion with key stakeholders with knowledge in the area:
- Energy transition
- Decarbonisation of Transport
- Software and IT
- Digital Financial Services
- Digital Business Services
- Space
- Healthtech
- Transformation of Chemical Industries
- Food & Drink Innovation
These nine opportunity areas broadly fall under three overarching areas: Net Zero; Digital; and High Value Manufacturing, with several of the opportunity areas contributing to more than one of these priority themes.
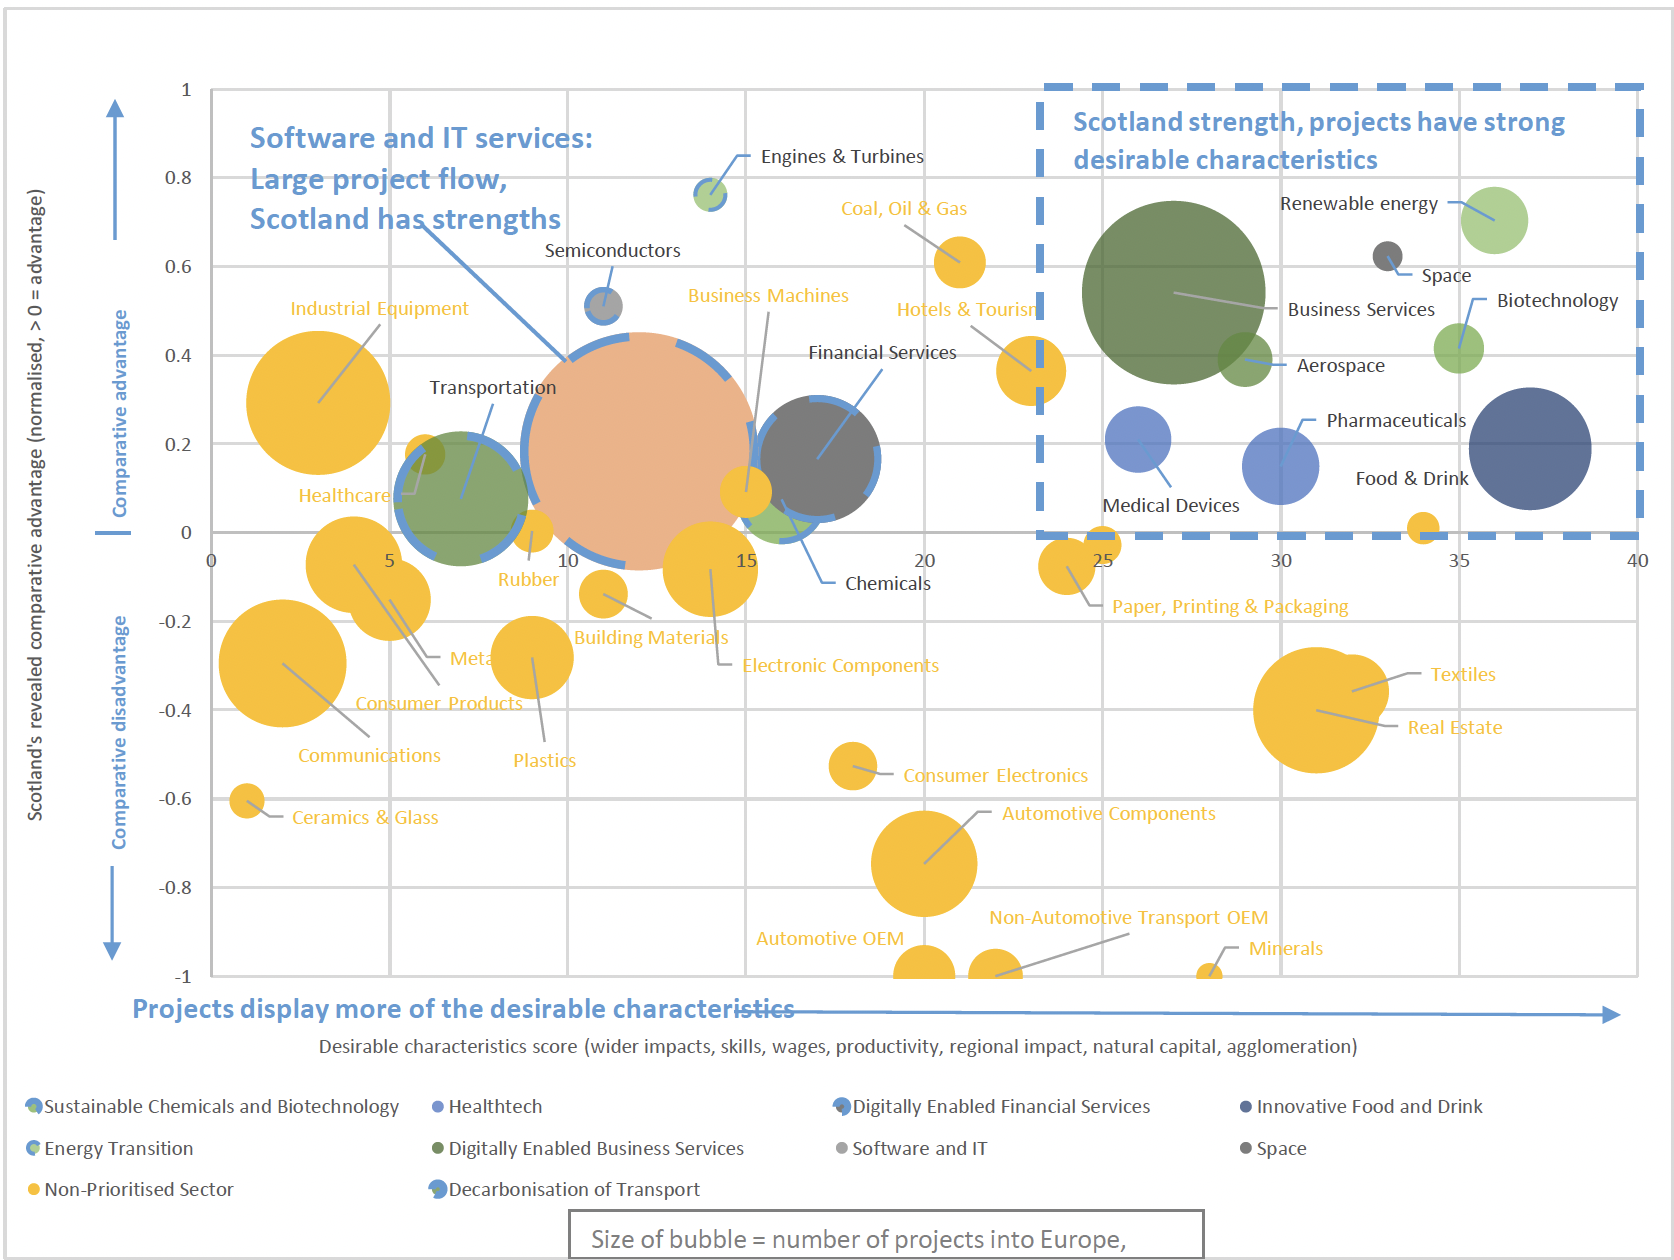
Source: Shaping Scotland's Economy: Scotland's Inward Investment Plan
Contact
Email: Innovation@Gov.Scot