Scotland's Labour Market: People, Places and Regions - Statistics from the Annual Population Survey 2020/21
Summary publication of results from the Annual Population Survey 2020/21, presenting analysis on the labour market, education and training.
Part of
Section 5: Inactivity
5.1 Inactivity over time
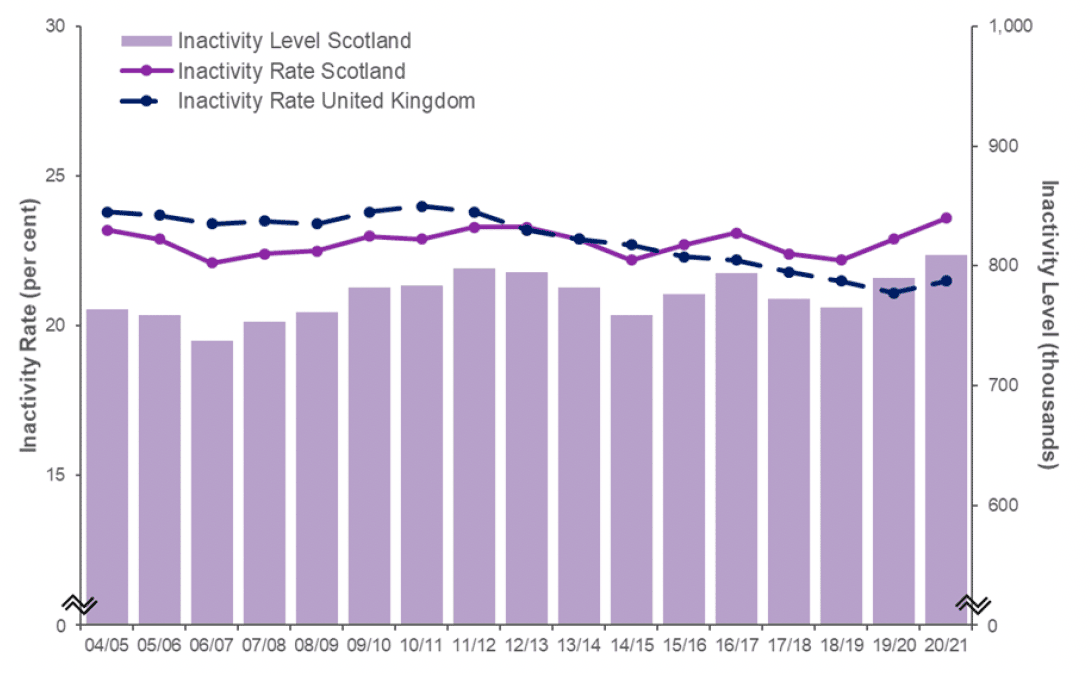
Scotland's inactivity rate in April 2020-March 2021 was above the rate for the UK.
The inactivity rate for those aged 16-64 in Scotland in April 2020-March 2021 was 23.6 per cent, higher than the UK rate of 21.5 per cent.
Over the year, the rate has increased marginally in Scotland (up 0.6 percentage points) and the UK (up 0.4 percentage points, which is statistically significant).
Scotland's inactivity rate is slightly higher in April 2020-March 2021 compared with April 2010-March 2011 (up 0.6 percentage points), while in the UK the inactivity rate is 2.6 percentage points lower, a statistically significant decrease.
Source: Annual Population Survey, April-March datasets, ONS
Who is classed as economically inactive?
Individuals aged 16 to 64 who are neither employed nor unemployed under ILO definitions are classed as economically inactive. There are many reasons why people may be inactive and not considered an active part of the labour supply: they may have a long-term illness or disability, be studying for a qualification, staying at home to look after their family, or have retired.
Inactivity rate is higher for women (16 to 64 years) at 26.5 per cent compared with 20.6 per cent for men.
Overall women account for 57.4 per cent of economically inactive people (16 to 64).
5.2 Sex and age
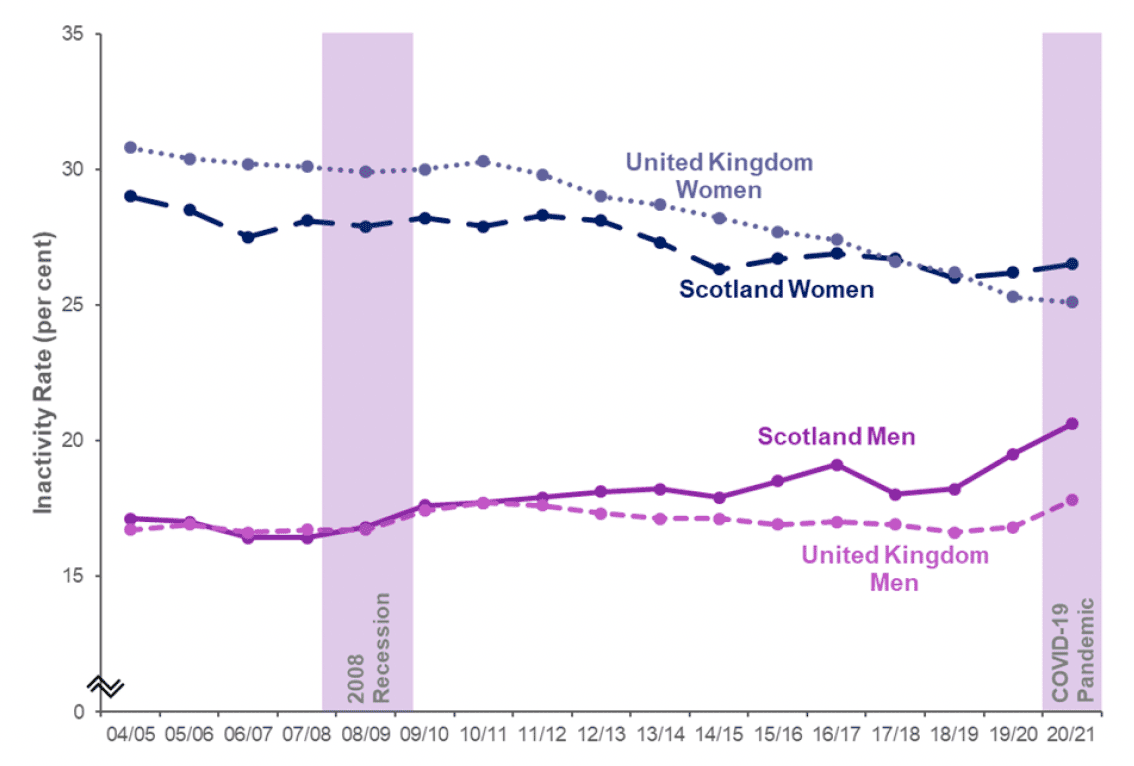
The inactivity rate has increased for men and women in Scotland since April 2019-March 2020.
The inactivity (16 to 64) rate for women in Scotland increased slightly, by 0.2 percentage points, from 26.2 per cent in April 2019-March 2020 to 26.5 per cent in April 2020-March 2021.
Over the same period the inactivity rate for men increased by 1.1 percentage points (from 19.5 per cent to 20.6 per cent).
Source: Annual Population Survey, April-March datasets, ONS
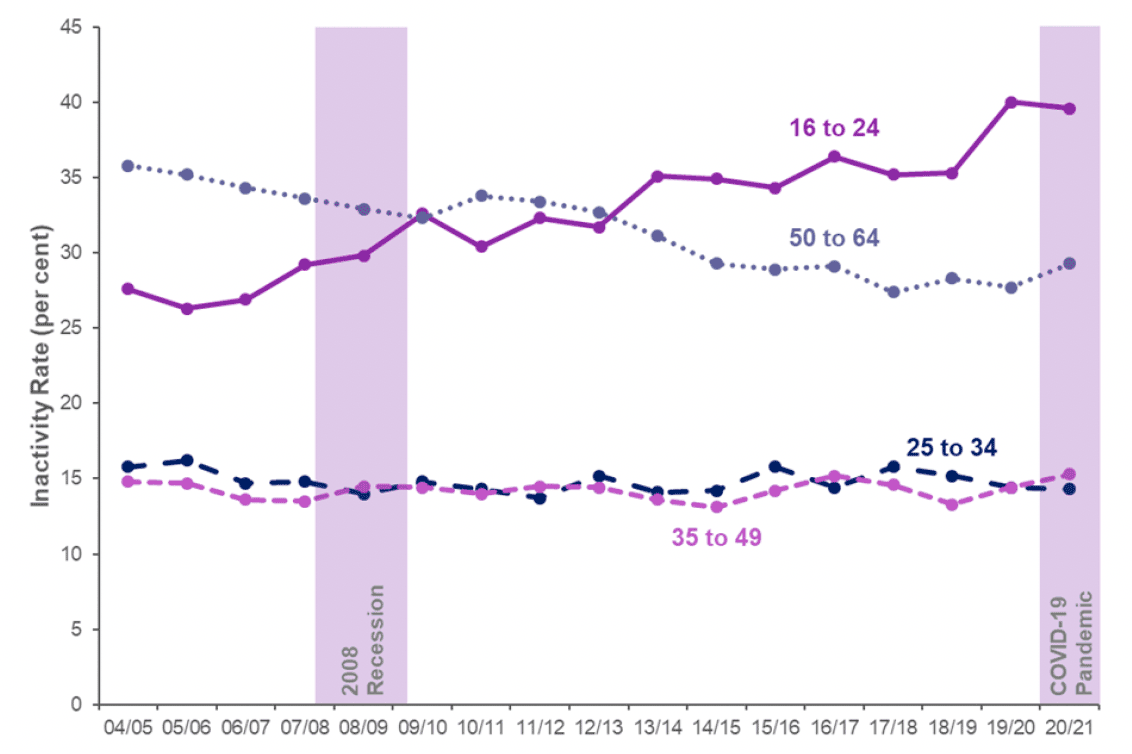
Economic inactivity rates since April 2010-March 2011 have increased for the younger age band (16 to 24 years) mainly due to increases in full-time education. The rate has decreased for those aged 50 to 64 over this period, as the employment rate has increased over time for this age group.
The economic inactivity rate for 25 to 34 year olds has remained around 15 per cent from April 2004-March 2005 to April 2020-March 2021. For 35 to 49 year olds, the rate is usually similar, at around 14 per cent, although it is currently 1.0 percentage point higher.
Source: Annual Population Survey, April-March datasets, ONS
5.3 Reasons for Inactivity
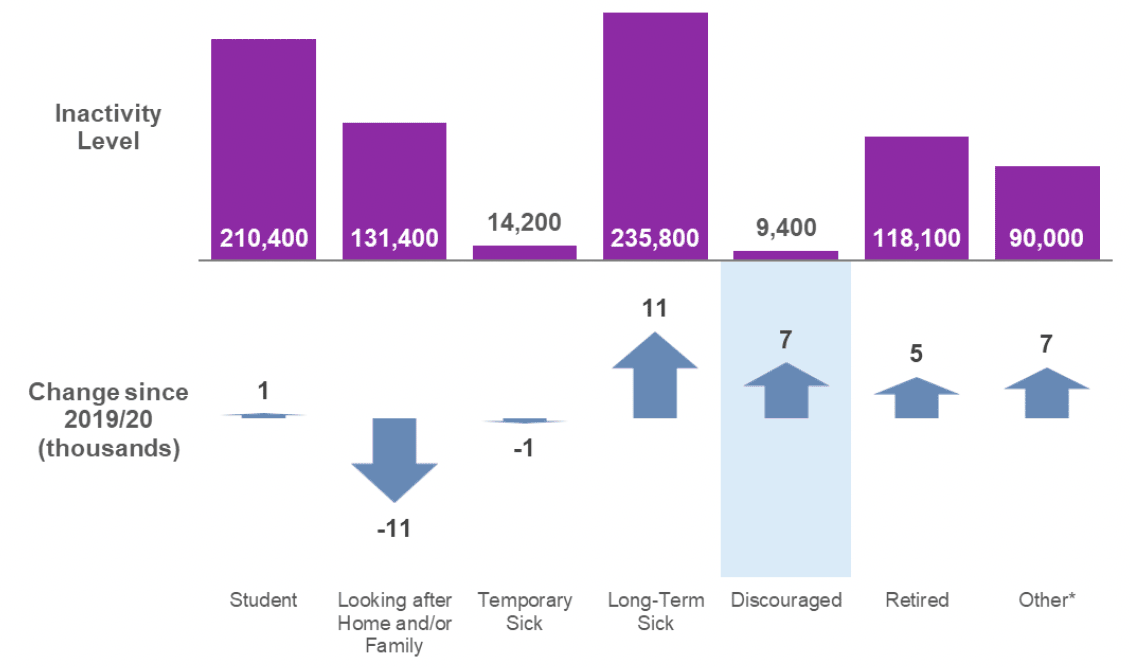
Over half (55.1 per cent) of the 809,200 economically inactive people (16 to 64) in Scotland were inactive because they were long-term sick or students.
Of the 809,200 economically inactive people (16 to 64) in April 2020-March 2021, the main reasons for being inactive were having long-term sickness or disability (235,800, 29.1 per cent) and student (210,400, 26.0 per cent).
A quarter (25.2 per cent) of all inactive people aged 16 to 64 years are in full time education, the majority of whom are aged 16 to 24 years old.
Increase in economic inactivity levels since April 2019-March 2020 has been driven by increases in the number of long-term sick.
Source: Annual Population Survey, April-March datasets, ONS
Note: A shaded background indicates estimates are based on a small sample size. This may result in less precise estimates, which should be used with caution.
Economic inactivity levels (16 to 64) in Scotland have increased by 19,400 since April 2019-March 2020. This has been driven mainly increases in the number of those inactive due to being long-term sick (up by 11,100), those who gave 'Other'[8] reasons (up 6,500) and Retired (up by 5,300).
Since April 2019-March 2020 the number of those inactive due to looking after family or home has decreased by 10,700.
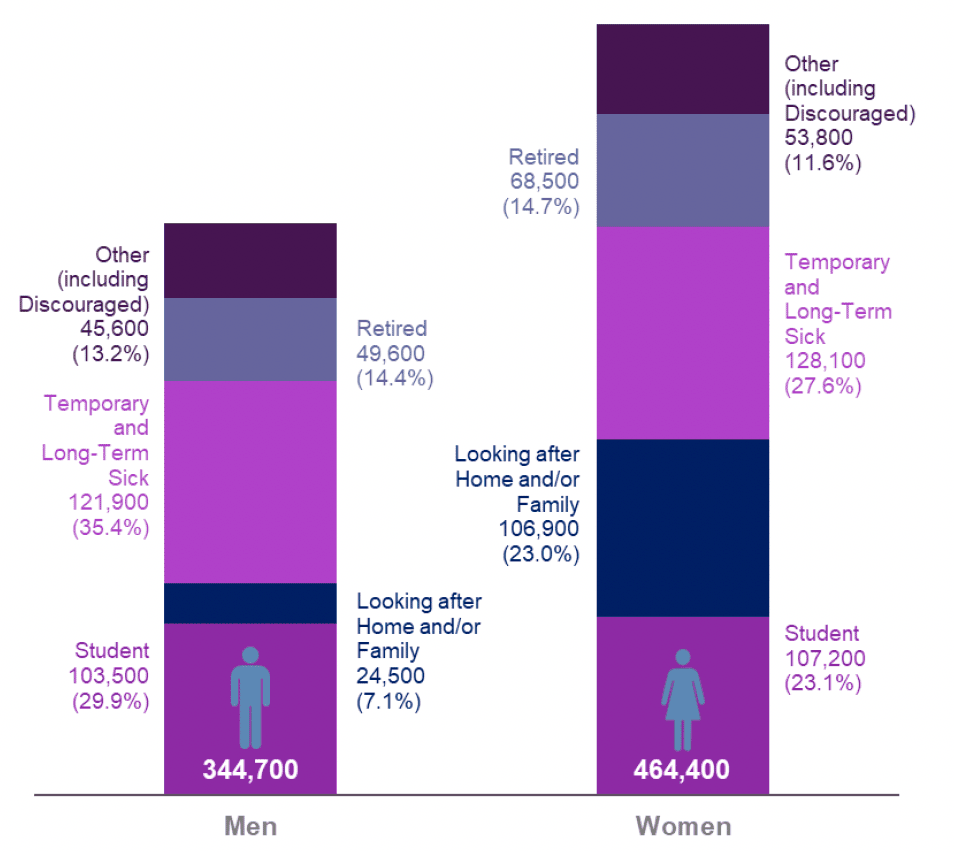
Reasons for inactivity differ by sex with looking after family/home accounting for 7.1 per cent of inactive men, but 23.0 per cent of inactive women.
Long-term sick and temporary sick accounted for 35.4 per cent of inactive men, while the proportion amongst inactive women was 27.6 per cent.
5.4 Local authorities
Some estimates in this section are based on small sample sizes. Estimates of this type are marked with an * to indicate they may be less precise and should be used with caution.
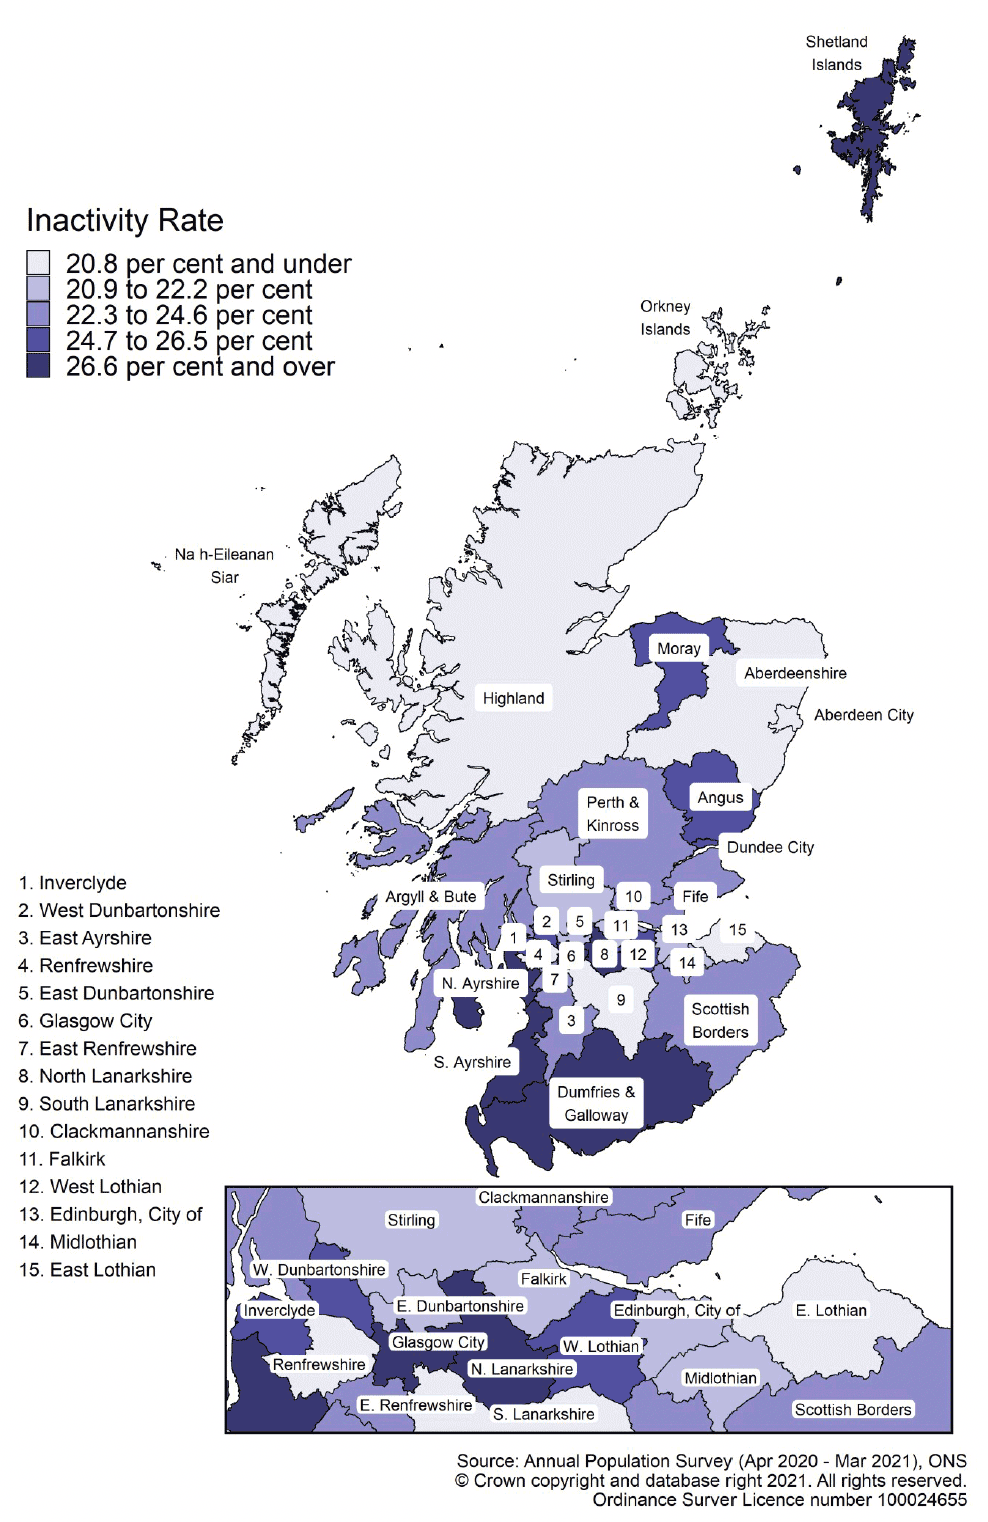
There is considerable variation in inactivity rates for those aged 16 to 64 across Scotland's local authorities.
In April 2020-March 2021, the highest economic inactivity rates were seen in:
- Shetland Islands (29.9* per cent);
- North Ayrshire (28.5 per cent); and
- North Lanarkshire (28.1 per cent).
The lowest rates were seen in:
- Orkney Islands (12.0* per cent),
- Na h-Eileanan Siar (14.3 per cent),
- Renfrewshire (19.6 per cent).
Since March 2019-April 2020, economic inactivity rates decreased in 13 of the 32 local authority areas while 19 saw an increase in their inactivity rates.
The local authorities with the largest decreases over the year were:
- Glasgow City (down 4.6 percentage points from 31.3 per cent to 26.7 per cent);
- Clackmannanshire (down 3.9 percentage points from 26.4 per cent to 22.5 per cent); and
- Stirling (down 3.5 percentage points from 25.5 per cent to 22.0 per cent).
The change for Glasgow City represents a statistically significant decrease over the year.
While the local authorities with the largest increases over the past year were:
- Shetland Islands (up 7.4* percentage points from 22.6* per cent to 29.9* per cent);
- Perth and Kinross (up 6.5 percentage points from 16.8 per cent to 23.2 per cent); and
- West Lothian (up 6.2 percentage points from 19.3 per cent to 25.5 per cent).
The changes for Perth & Kinross and West Lothian represent statistically significant increases over the year.
Since March 2010-April 2011, economic inactivity rates increased in 22 of the 32 local authority areas while ten saw a decrease in their inactivity rates.
The local authorities with the largest decreases were:
- Na h-Eileanan Siar (down 17.3 percentage points from 31.6 per cent to 14.3 per cent);
- Orkney Islands (down 7.5* percentage points from 19.6 per cent to 12.0* per cent); and
- Renfrewshire (down 5.4 percentage points from 24.9 per cent to 19.6 per cent).
The changes for Na h-Eileanan Siar and Renfrewshire represent statistically significant decreases over the year.
While the local authorities with the largest increases were:
- Shetland Islands (up 15.5* percentage points from 14.5 per cent to 29.9* per cent);
- Moray (up 6.4 percentage points from 18.8 per cent to 25.2 per cent); and
- North Lanarkshire (up 6.2 percentage points from 21.9 per cent to 28.1 per cent).
These changes represent statistically significant increases over the year.
5.5 Want to Work
Some estimates in this section are based on small sample sizes. Estimates of this type are marked with an * to indicate they may be less precise and should be used with caution.
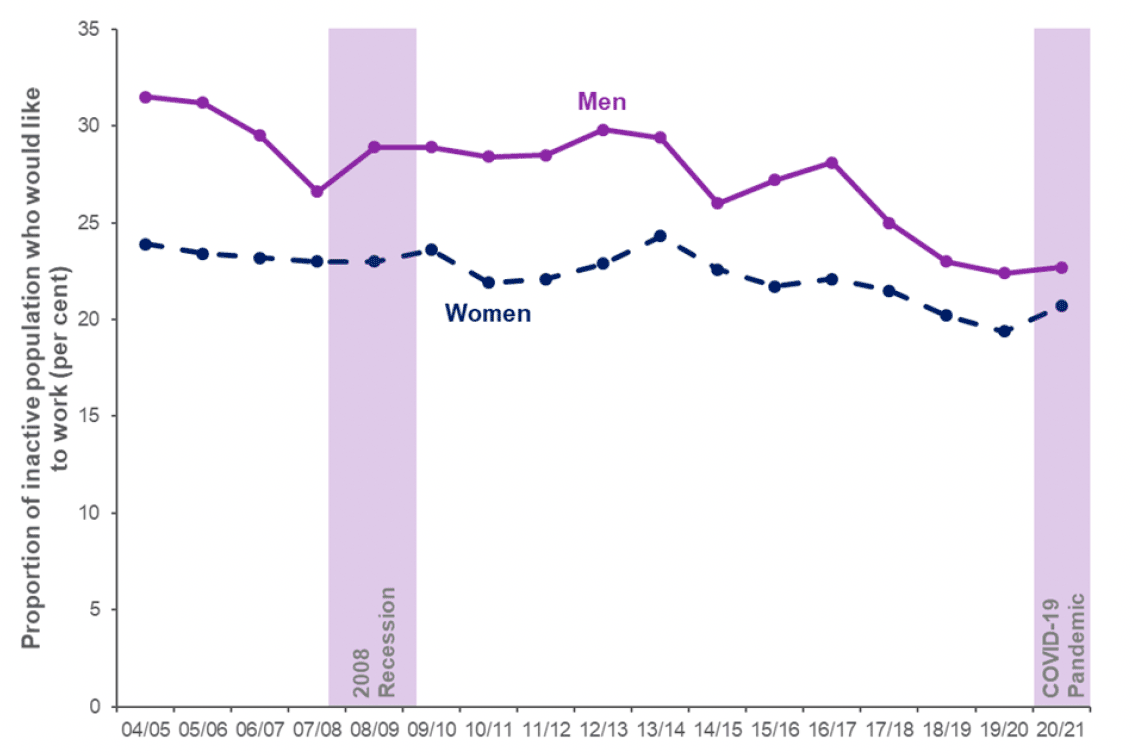
Of those who are aged 16-64 and economically inactive in Scotland in April 2020-March 2021, around one in five (174,700) would like to work but were currently unable to do so.
Since April 2019-March 2020, the proportion of those who were economically inactive and would like to work increased by 0.9 percentage points, from 20.7 per cent in April 2019-March 2020 (the lowest point in the series to date) to 21.6 per cent in April 2020-March 2021.
The percentage of economically inactive who would like to work increased for both men (by 0.3 percentage points) and for women (by 1.3 percentage points). The percentage is lower for women at 20.7 per cent compared with 22.7 per cent for men.
Regional Differences
In April 2020-March 2021, the local authorities with the highest proportion of economically inactive people who would like to work were:
- West Lothian (31.1* per cent);
- Renfrewshire (30.2* per cent); and
- Highland (28.9* per cent).
The lowest proportions were seen in:
- Perth & Kinross (15.8* per cent);
- Inverclyde (15.9* per cent); and
- Clackmannanshire (16.9* per cent).
Source: Annual Population Survey, April-March datasets, ONS
Contact
Email: lmstats@gov.scot