Scotland's Labour Market: People, Places and Regions - Statistics from the Annual Population Survey 2020/21
Summary publication of results from the Annual Population Survey 2020/21, presenting analysis on the labour market, education and training.
Part of
Section 1: Employment
1.1 Overview
Please see the What you need to know section for further details on how the COVID-19 pandemic has affected labour market measures.
In April 2020-March 2021, it was estimated that 2,717,100 people aged 16 years and over were economically active in Scotland. Scotland's economic activity rate (16 to 64) in April 2020-March 2021 was estimated at 76.4 per cent, lower than the UK rate of 78.5 per cent.
Who is classed as economically active?
Economically active individuals are those who are in employment or have been actively seeking work and are available to start work (International Labour Organisation (ILO) definition).
Of the population aged 16 years and over in Scotland in April 2020-March 2021, 2,591,100 were estimated to be in employment and 126,000 were estimated to be unemployed.
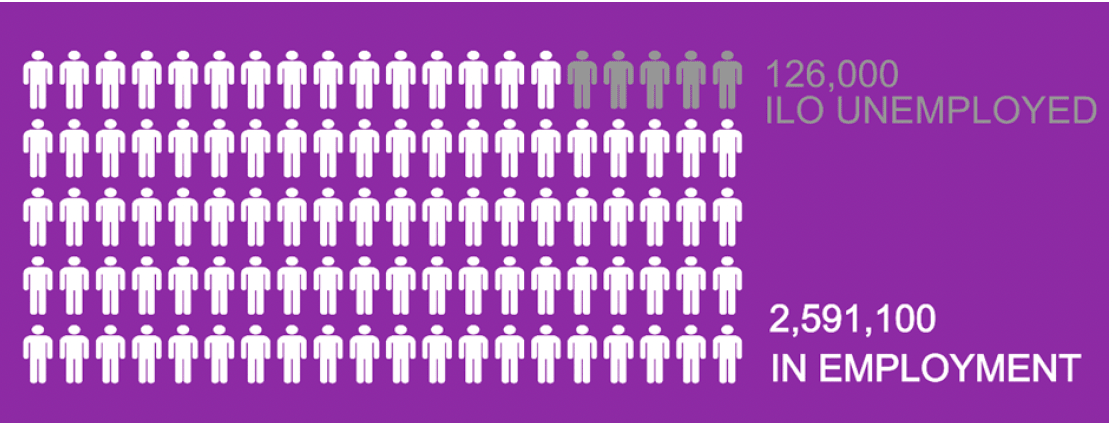
Infographic text below:
126,000 ILO Unemployed
2,591,100 in Employment
Note: The remainder of the population aged 16 years and above are economically inactive i.e. neither in employment or actively seeking and available for work.
As in the UK, the estimated employment level and rate in Scotland has decreased over the last year.
In April 2020-March 2021, the employment rate (16 to 64) in Scotland was estimated at 72.8 per cent, lower than the UK rate of 74.7 per cent.
The employment rate for Scotland decreased from 74.5 per cent in April 2019-March 2020 to 72.8 per cent in April 2020-March 2021 while the UK employment rate decreased from 75.8 per cent to 74.7 per cent over the same period, representing statistically significant decreases over the year.
Who is classed as being in employment?
A person aged 16 years or over and has done at least one hour of paid work in the week prior to their Labour Force Survey (LFS) interview or has a job that they are temporarily away from.
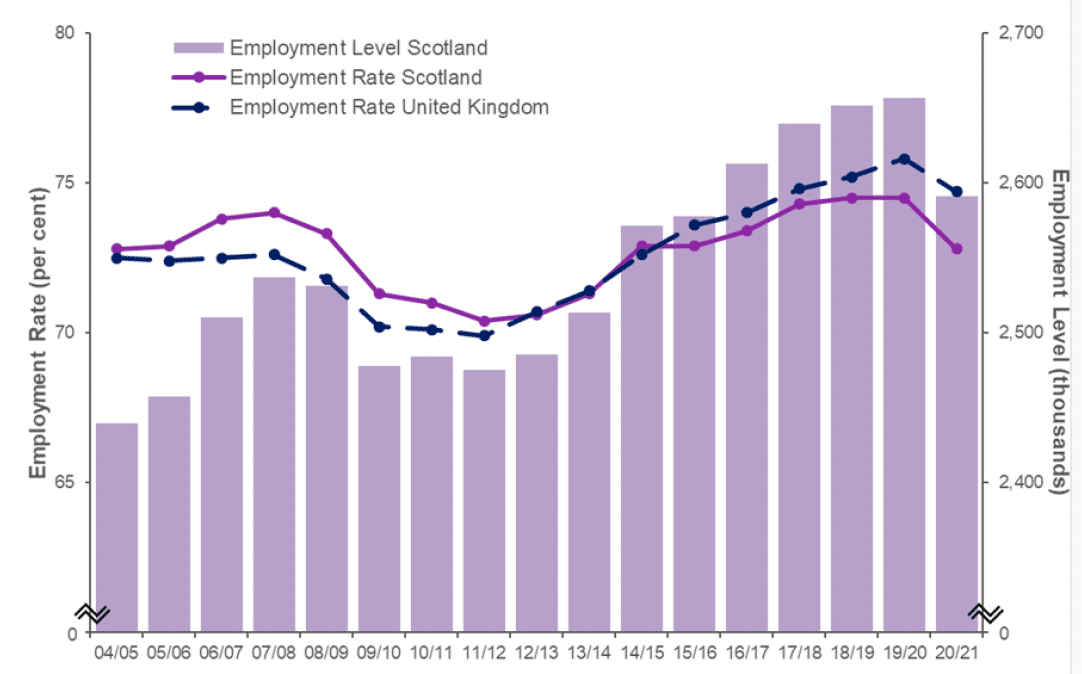
Source: Annual Population Survey, April-March datasets, ONS
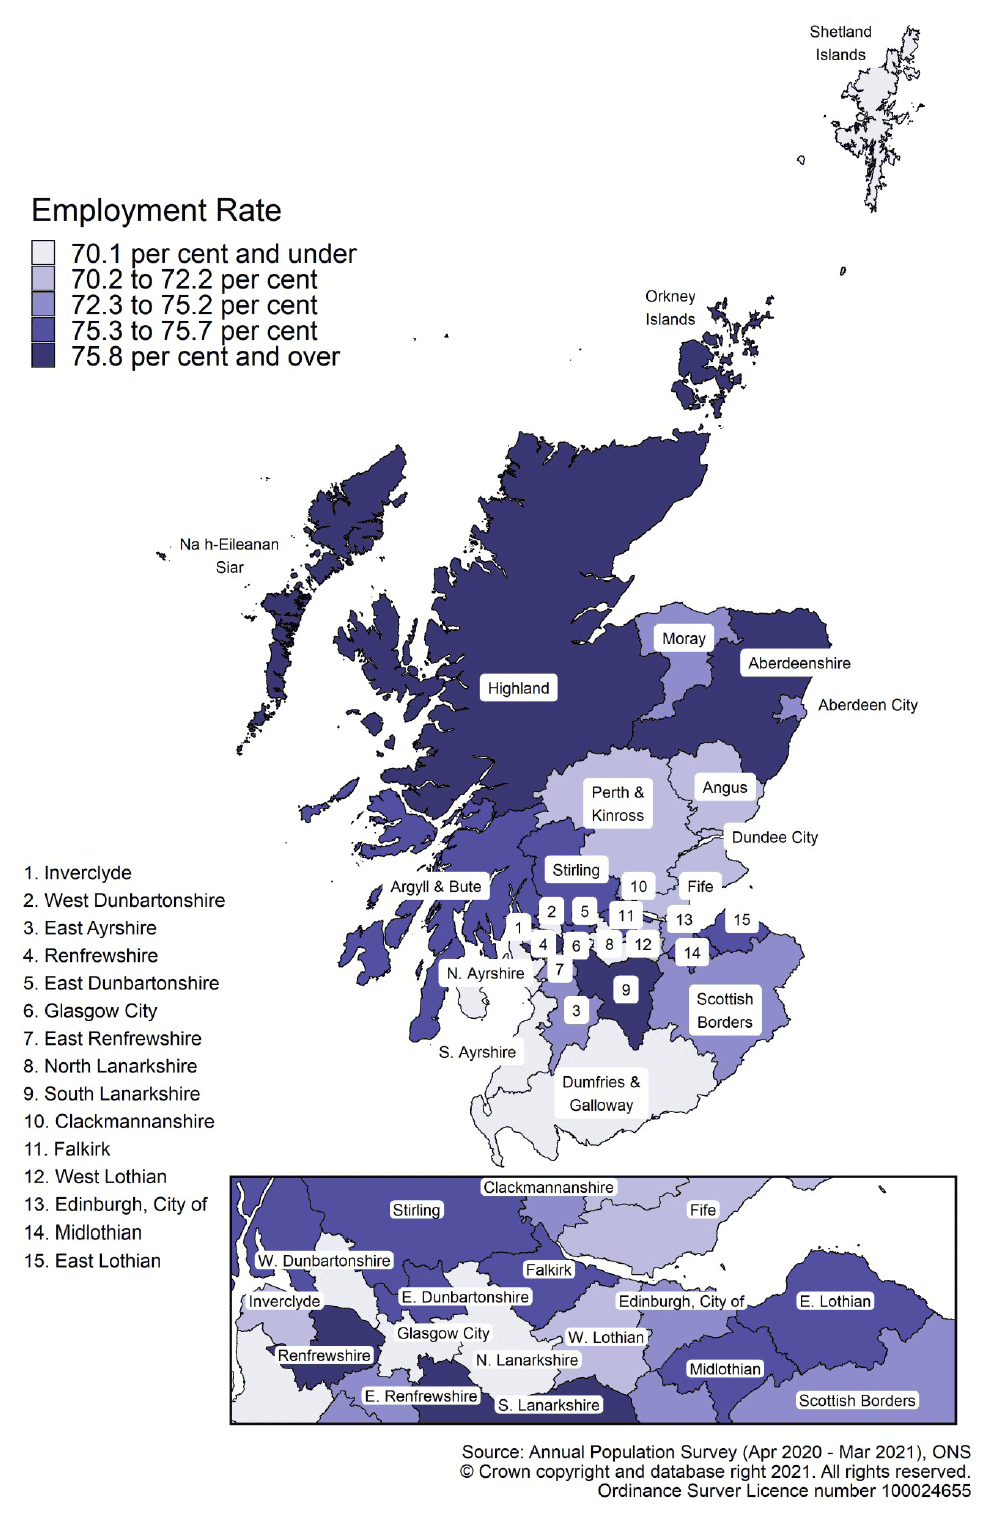
1.2 Local Authorities
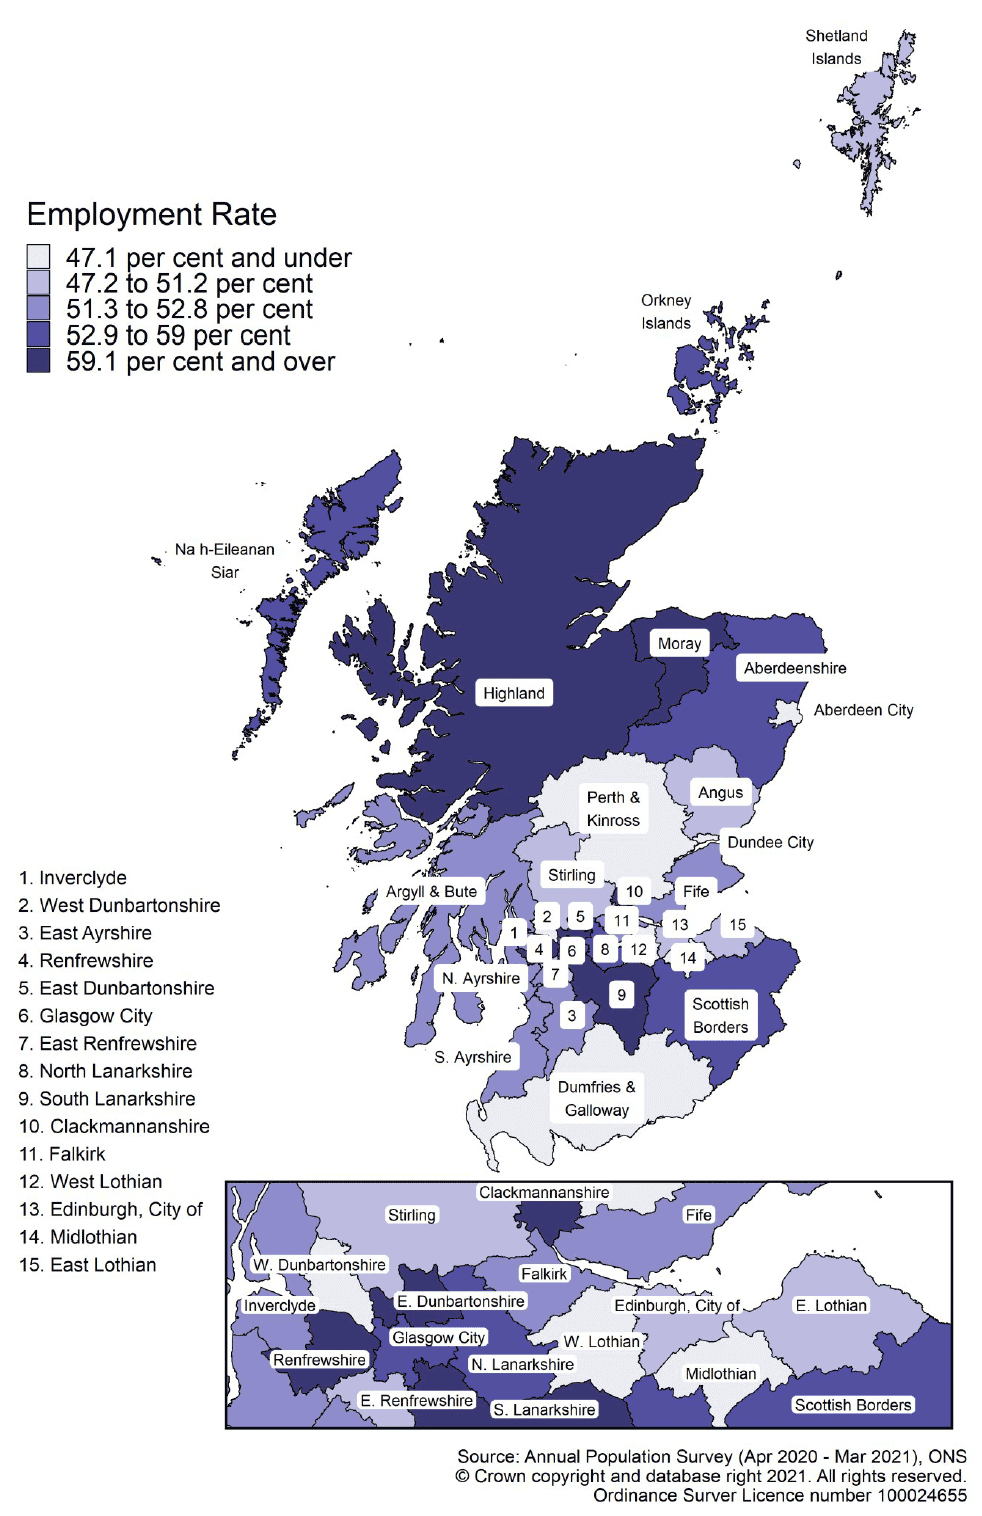
There are long-standing variations in employment rate estimates for those aged 16 to 64 across Scotland's local authorities.
In April 2020 to March 2021, the highest employment rate estimates were seen in:
- Orkney Islands (84.2 per cent);
- Na h-Eileanan Siar (81.2 per cent); and
- Highland (77.6 per cent).
The lowest employment rate estimates were seen in:
- North Ayrshire (66.4 per cent);
- North Lanarkshire (66.8 per cent); and
- Dumfries & Galloway (67.1 per cent).
Since April 2019-March 2020, the employment rate had increased in nine local authority areas and had decreased in 23 local authority areas.
The local authorities with the largest increases over the past year were:
- Glasgow City (up 4.2 percentage points);
- Stirling (up 3.5 percentage points); and
- Falkirk (up 1.9 percentage points)
while the local authorities with the largest decreases over the past year were:
- Perth & Kinross (down 8.5 percentage points);
- North Lanarkshire (down 7.0 percentage points); and
- Dumfries & Galloway (down 6.9 percentage points).
These represent statistically significant decreases over the year.
1.3 Sex
National Performance Framework Indicator
Gender balance in organisations
The gender employment gap is the difference between the employment rate for men and women aged 16-64. It is calculated as the employment rate for men minus the employment rate for women.
The gender employment gap decreased from 6.3 percentage points in April 2019-March 2020 to 4.7 percentage points in April 2020-March 2021.
The decrease in the gender employment gap over the past year was due to the employment rate for men decreasing at a faster rate than for women.
From April 2011-March 2012 to April 2014-March 2015, the employment rate had increased at a faster rate for women compared with men in Scotland. However, since then the rate of change had been similar for women and men up until April 2019-March 2020.
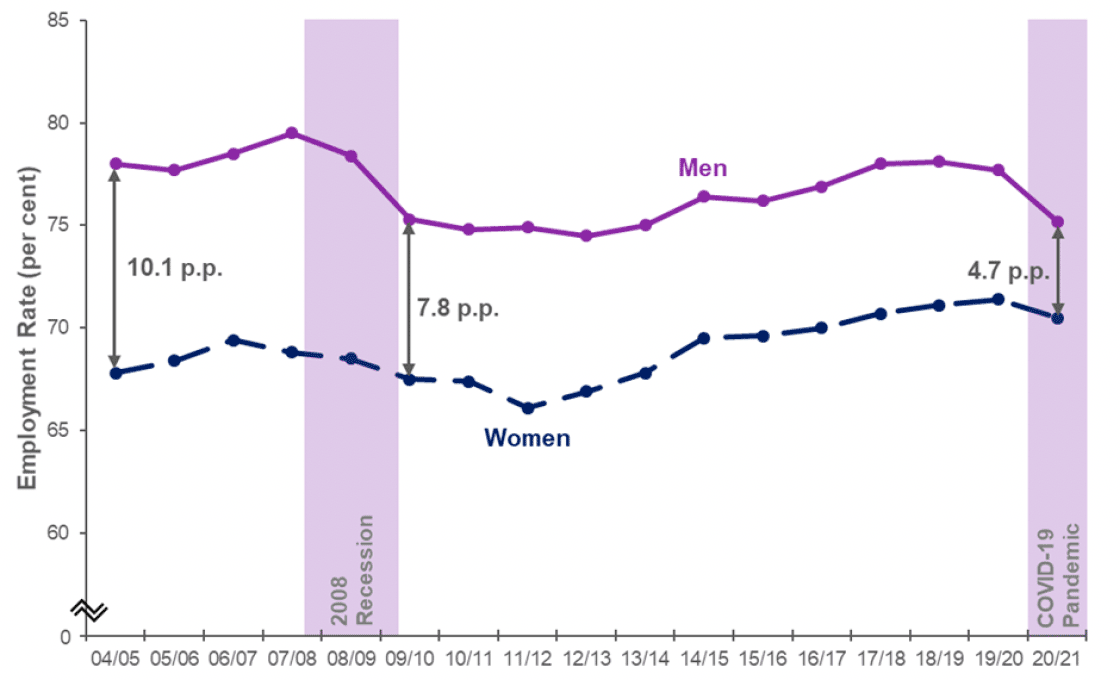
Source: Annual Population Survey, April-March datasets, ONS
In April 2020-March 2021, 1,274,400 women aged 16 years and over were estimated to be in employment in Scotland, 19,800 less than the number of women employed in April 2019-March 2020. The employment rate (16-64 year olds) for women was estimated at 70.5 per cent, 1.0 percentage point lower than the year before (71.4 per cent).
1,316,700 men aged 16 years and over were estimated to be in employment in April 2020-March 2021, 45,800 less compared with April 2019-March 2021. The employment rate (16-64 year olds) for men was estimated to have decreased by 2.5 percentage points from 77.7 per cent in April 2019-March 2020 to 75.2 per cent in April 2020-March 2021. This represents a statistically significant decrease over the year.
1.4 Sex by Local Authority
In April 2020-March 2021, men were estimated to have higher employment rates (16-64) than women across all local authorities in Scotland, except the City of Edinburgh, South Ayrshire, Aberdeen City, Na h-Eileanan Siar and Orkney Islands, where women had higher employment rates than men.
Since April 2019-March 2020, the employment rate for men had increased in only seven of the 32 local authorities:
Local Authorities which showed the largest percentage point decrease in the employment rate for men over the year were:
- South Ayrshire (down 11.1 percentage points to employment rate of 68.1 per cent);
- Aberdeen City (down 10.6 percentage points to 71.7 per cent); and
- Orkney Islands (down 9.2 percentage points to 81.6 per cent).
The changes for South Ayrshire and Aberdeen City represent statistically significant decreases over the year.
Whereas, since April 2019-March 2020, the employment rate for women has increased in 13 of the 32.
Local Authorities which showed the largest percentage point decrease in the employment rate for women over the year were:
- Perth & Kinross (down 10.9 percentage points to employment rate of 65.2 per cent);
- Dumfries & Galloway and North Lanarkshire (down 7.2 percentage points to 62.6 per cent and 64.5 per cent respectively); and
- Angus (down 7.0 percentage points to 66.7 per cent).
The change for Perth & Kinross represents a statistically significant decrease over the year.
In April 2020-March 2021, the highest gender employment gap estimate was in Perth & Kinross at 15.9 percentage points, with an employment rate of 65.2 per cent for women compared with a rate of 81.1 per cent for men.
Shetland Islands had the second highest gender employment gap estimate (13.7* percentage points), with an employment rate of 63.3* per cent for women compared to 77.0* per cent for men.
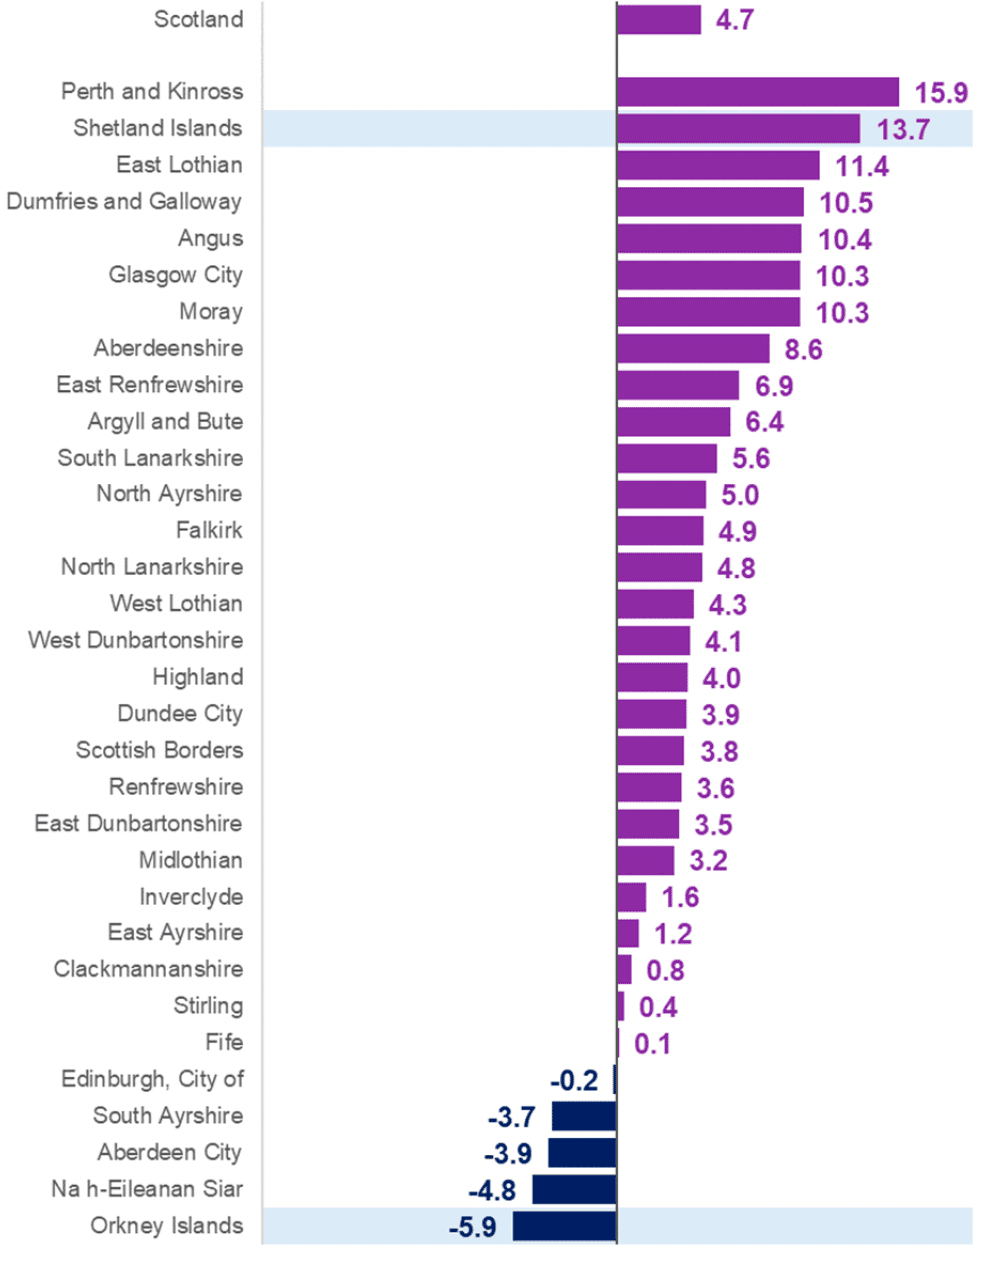
Note: Estimates marked with an * or with a shaded background in the chart indicate they are based on small sample sizes which may be less precise and should be used with caution.
1.5 Age
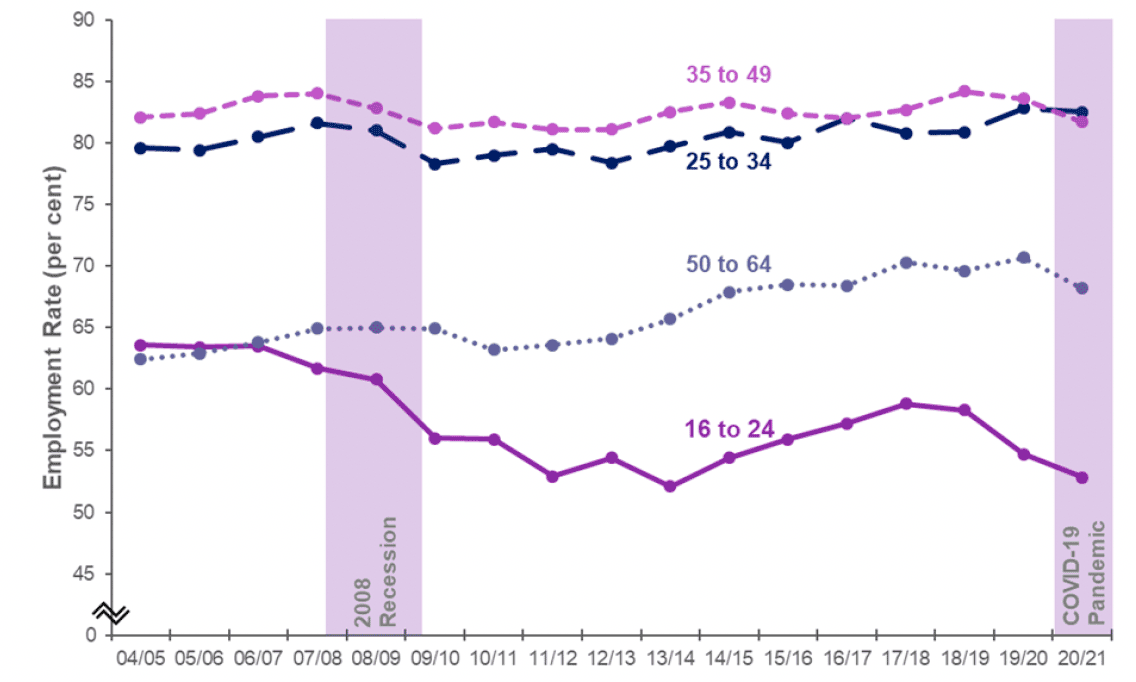
In the last year, the employment rate has decreased in all age bands up to 65 years.
The employment rate for young people (16 to 24) in Scotland was estimated at 52.8 per cent in April 2020-March 2021, 1.8 percentage points lower than in April 2019-March 2020 (54.7 per cent). The employment rate for young people (16-24 years) is the lowest of any age group due to higher rates of education participation. Following the 2008 recession, there was a substantial decrease in the employment rate for this age group and in the last year the Covid-19 pandemic has also adversely impacted this age group. The employment rate for young people had been gradually increasing since April 2013-March 2014 but has decreased significantly since April 2018-March 2019.
The employment rates for 25 to 34 year olds and 35 to 49 year olds have been fairly stable in the period April 2004-March 2005 to April 2019-March 2020 although slightly lower in the years following the 2008 recession (April 2009-March 2010 to April 2012-March 2013). The employment rate for 25-34 year olds was estimated at 82.5 per cent in April 2020-March 2021, slightly lower than the year before (82.8 per cent). The employment rate for 35 to 49 year olds was estimated at 81.7 per cent, significantly lower than the year before (83.6 per cent).
The estimated employment rates for those aged 50 to 64 have increased throughout the economic recovery from the 2008 recession to 70.7 per cent in April 2019-March 2020. However, the employment rate for 50 to 64 year olds decreased by 2.6 percentage points over the last year to 68.2 per cent in April 2020-March 2021. This represents the largest annual decrease over the year of any age group and a statistically significant decrease.
Source: Annual Population Survey, April-March datasets, ONS
Similarly the estimated employment rates for those aged 65 years and over had increased from 5.2 per cent in April 2004-March 2005 to 9.2 per cent in April 2016-March 2017. In April 2020-March 2021, the employment rate for those aged 65 and over was estimated at 8.9 per cent, the same as in April 2019-March 2020.
1.6 Ages 16 to 24 by Local Authority
Some estimates in this section are based on small sample sizes. Estimates of this type are marked with an * to indicate they may be less precise and should be used with caution.
The employment rate for young people (16 to 24 year olds) in Scotland decreased by 1.8 percentage points over the year from 54.7 per cent in April 2019-March 2020 to 52.8 per cent in April 2020-March 2021[2].
The employment rate for young people in the UK decreased by 2.9 percentage points from 53.9 per cent to 51.1 per cent over the same period. This represents a statistically significant decrease.
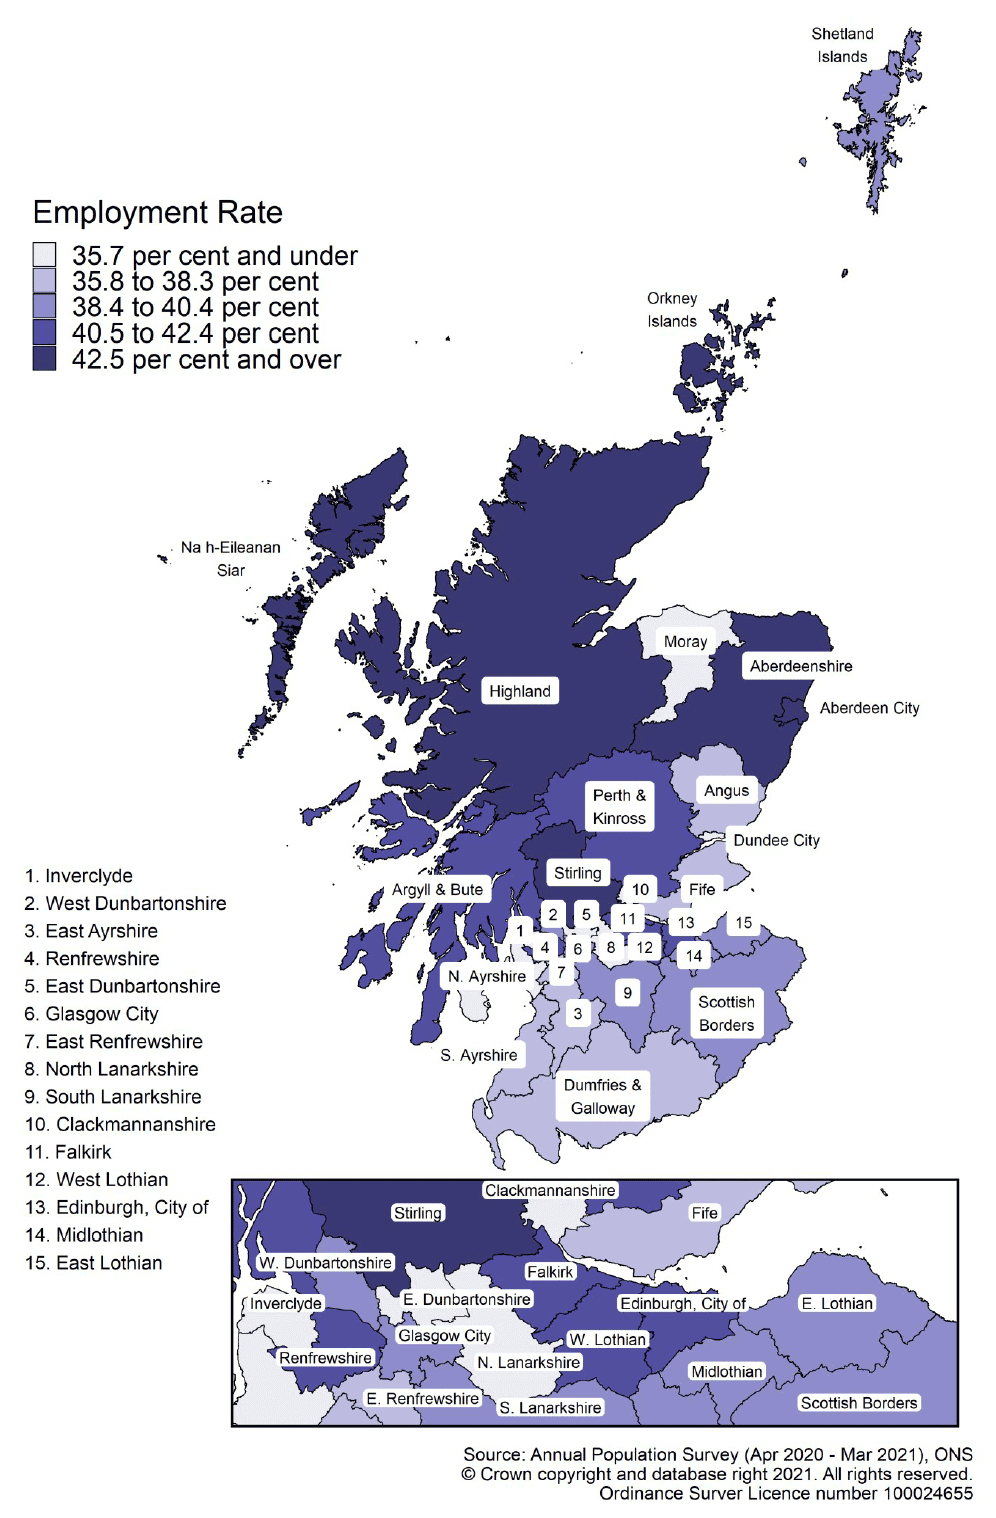
In April 2020-March 2021, the local authority areas with the highest employment rate estimates for young people in Scotland were:
- Highland (69.6 per cent);
- Clackmannanshire (63.4* per cent); and
- South Lanarkshire (63.0 per cent).
The local authority areas with the lowest employment rate estimates for young people in Scotland were:
- Aberdeen City (39.6* per cent);
- West Lothian (40.6* per cent); and
- Midlothian (42.5* per cent).
These figures will be partly influenced by the location of further and higher education provision and since April 2019-March 2020, the employment rate for young people had increased in ten local authority areas and had decreased in 22 local authority areas.
1.7 Ages 50 and over
50 to 64 years
The employment level for those aged 50 to 64 years decreased by 26,600 from 793,300 in April 2019-March 2020 to 766,700 in April 2020-March 2021. The employment rate decreased by 2.6 percentage points from 70.7 per cent to 68.2 per cent over the same period. This represents a statistically significant decrease.
Men accounted for nearly two thirds (63.7 per cent) of the decrease in the employment level for those aged 50 to 64.
65 years and over
92,400 people aged 65 and over were in employment in Scotland in April 2020-March 2021, slightly higher than the year before (91,500) and 60.9 per cent more than in April 2010-March 2011.
The most common reason for working past the age of 65 years was being "Not ready to stop working" reported by 36.9 per cent.
50 years and over
In April 2020-March 2021, the local authority areas with the highest employment rate estimates for those aged 50 and over in Scotland were:
- Na h-Eileanan Siar (45.8 per cent);
- Highland (45.2 per cent); and
- Aberdeen City (45.1 per cent).
The local authority areas with the lowest employment rate estimates for those aged 50 and over in Scotland were:
- North Ayrshire (33.8 per cent);
- Clackmannanshire (34.9 per cent); and
- North Lanarkshire (35.1 per cent).
Since April 2019-March 2020, the employment rate for those aged 50 and over had increased in nine local authority areas and had decreased in 23 local authority areas.
1.8 Industry by Age
Just over a quarter (25.9 per cent) of people aged 16 to 24 in employment reported that they were employed in the "Wholesale, Retail, Repair of Vehicles" sector; accounting for 24.7 per cent of the total workforce in this sector.
Around one in six young people (16.7 per cent) in employment reported being employed in the "Accommodation and Food Services" sector, accounting for 33.5 per cent of all employed in this sector.
Almost one in 12 young people (8.1 per cent) in employment are employed in the "Health and Social Work activities" sector. However, young people only account for 6.2 per cent of all employment in that sector.
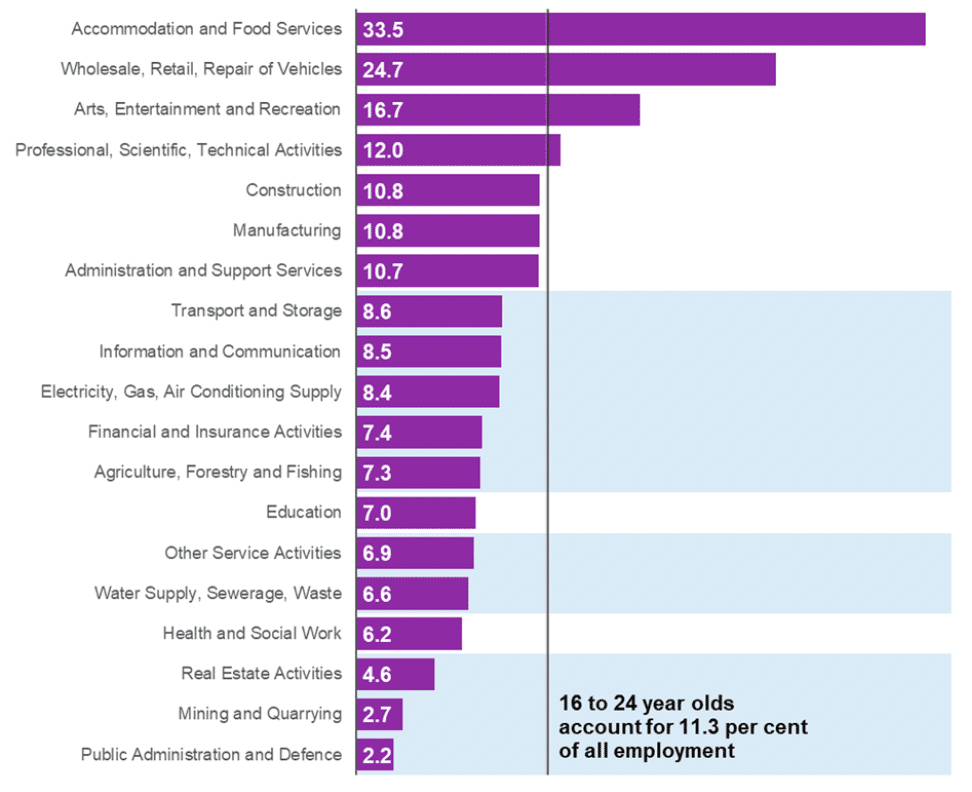
Note: A shaded background indicates estimates are based on a small sample size. This may result in less precise estimates, which should be used with caution.
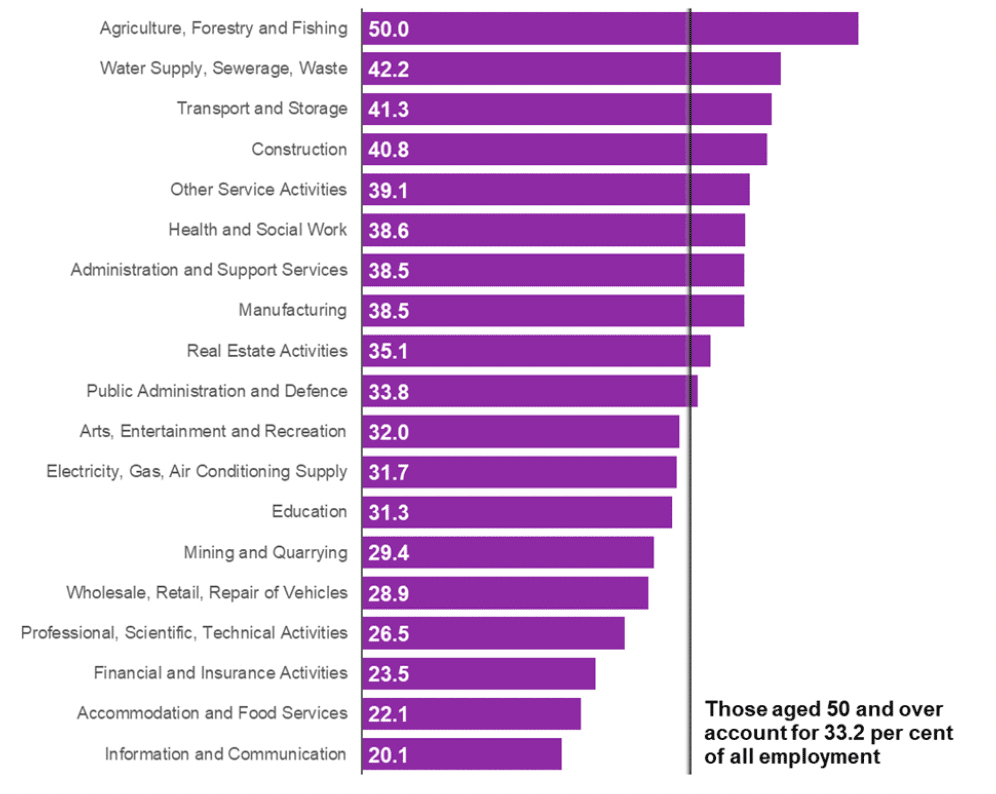
While young people (16 to 24 years) account for an estimated 11.3 per cent of all in employment in April 2020-March 2021, the 50 and over age band accounts for just under one third of the workforce (33.2 per cent).
The highest proportion of people in employment aged 50 years and over are employed in the "Health and Social Work" sector. An estimated 146,600 people in this age group are employed in the "Health and Social Work" sector, accounting for 38.6 per cent of all employed in that sector.
People in employment aged 50 years and over account for over 40 per cent of the workforce in the "Agriculture, Forestry and Fishing", "Water Supply, Sewage, Waste", "Transport and Storage" and "Construction" sectors.
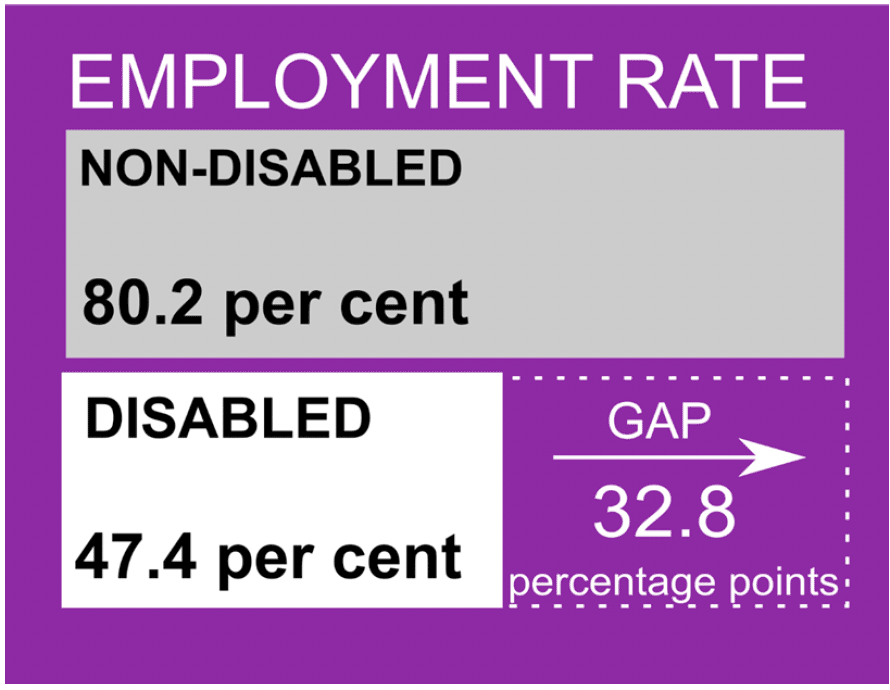
1.9 Disability
In April 2020-March 2021, the employment rate for those classed as disabled under the Equality Act 2010 was estimated at 47.4 per cent which is significantly lower than the employment rate for non-disabled people (80.2 per cent). In April 2020-March 2021, the disability employment gap was estimated at 32.8 percentage points. This represents a statistically significant gap.
Disability employment rate gap
The disability employment gap is the difference between the employment rates of disabled people and non-disabled people aged 16 to 64 years. It is calculated as the non-disabled employment rate minus disabled employment rate.
The gap between the employment rate for disabled and non-disabled people has decreased by 0.5 percentage points over the year and by 5.5 percentage points since April 2015-March 2016.
The employment rate for non-disabled people decreased significantly from 81.6 per cent in April 2019-March 2020 to 80.2 per cent in April 2020-March 2021 (1.4 percentage points) while the employment rate for disabled people decreased from 48.3 per cent to 47.4 per cent over the same period (0.9 percentage points). The employment rate for non-disabled people decreasing at a faster rate than for disabled people was the primary reason for the reduction in the employment gap.
The disability employment gap was lower for women aged 16 to 64 (26.9 percentage points) than men (39.5 percentage points) and across all other age bands.
The disability employment gap was lower for young people and increased with age with the gap being highest for those aged 50 to 64.
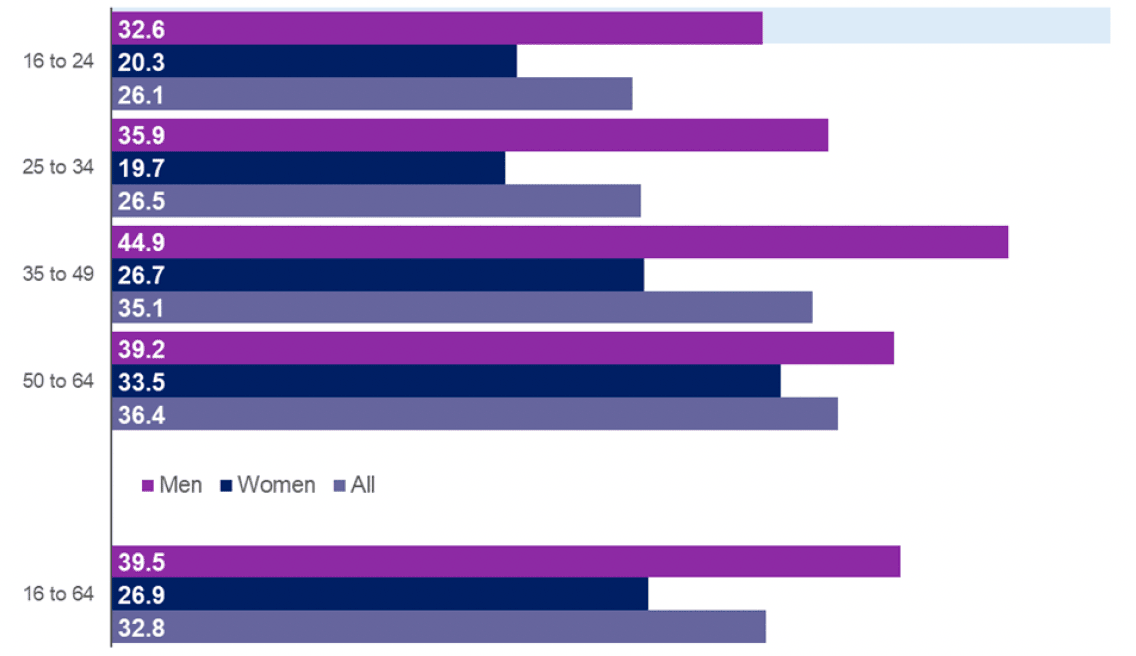
Note: A shaded background indicates estimates are based on a small sample size. This may result in less precise estimates, which should be used with caution.
1.10 Ethnicity
Estimates marked with an * to indicate they may be less precise and should be used with caution.
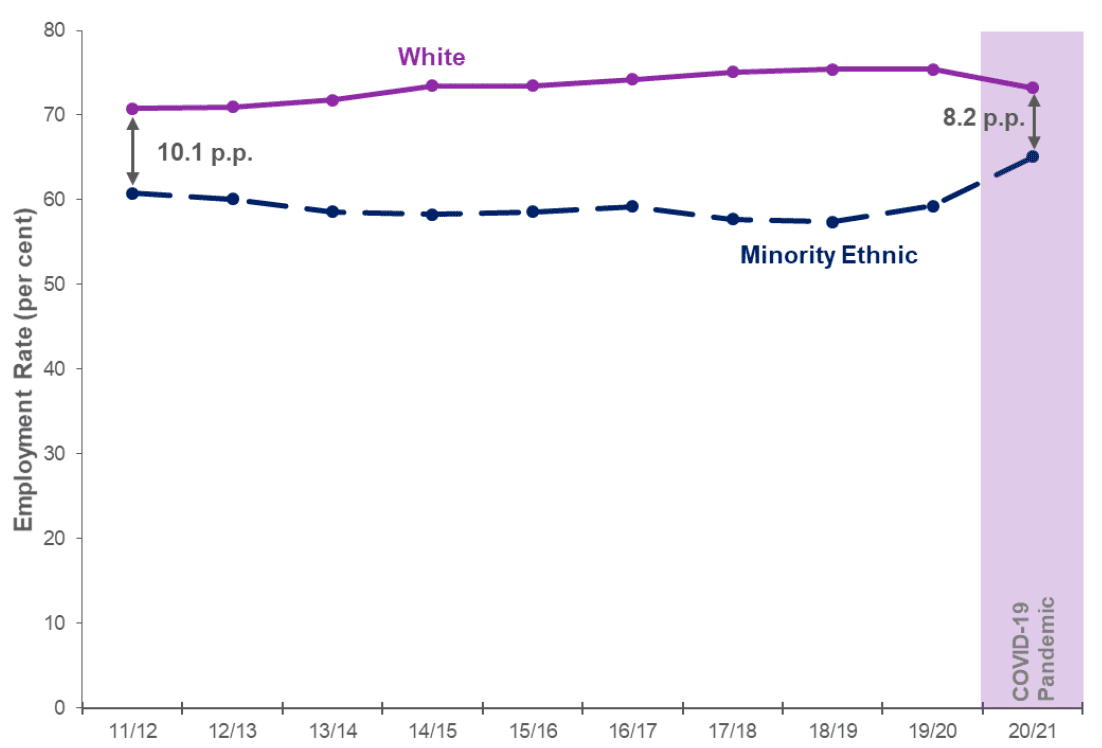
The employment rate for the minority ethnic*[4] population aged 16 to 64 was estimated at 65.1 per cent in April 2020-March 2021. This is significantly lower than the rate for the white population[5] (73.2 per cent) giving an estimated gap in employment rates between the minority ethnic and white populations of 8.2 percentage points. This represents a statistically significant gap.
Minority ethnic employment rate gap
The minority ethnic employment gap is the difference between the employment rates of minority ethnic people and white people aged 16 to 64 years. It is calculated as the white employment rate minus minority ethnic employment rate.
The white population aged 16 to 64 has consistently had a higher employment rate than the minority ethnic population.
The minority ethnic employment rate gap has reduced over the year from 16.1 percentage points in April 2019-March 2020. This change has been driven by a statistically significant annual increase in the employment rate for the minority ethnic population (increased by 5.8 percentage points from 59.3 per cent in April 2019-March 2020), compared with an annual decrease in the employment rate for the white population which was statistically significant (decreased by 2.1 percentage points from 75.4 per cent in April 2019-March 2020).
Source: Annual Population Survey, April-March datasets, ONS
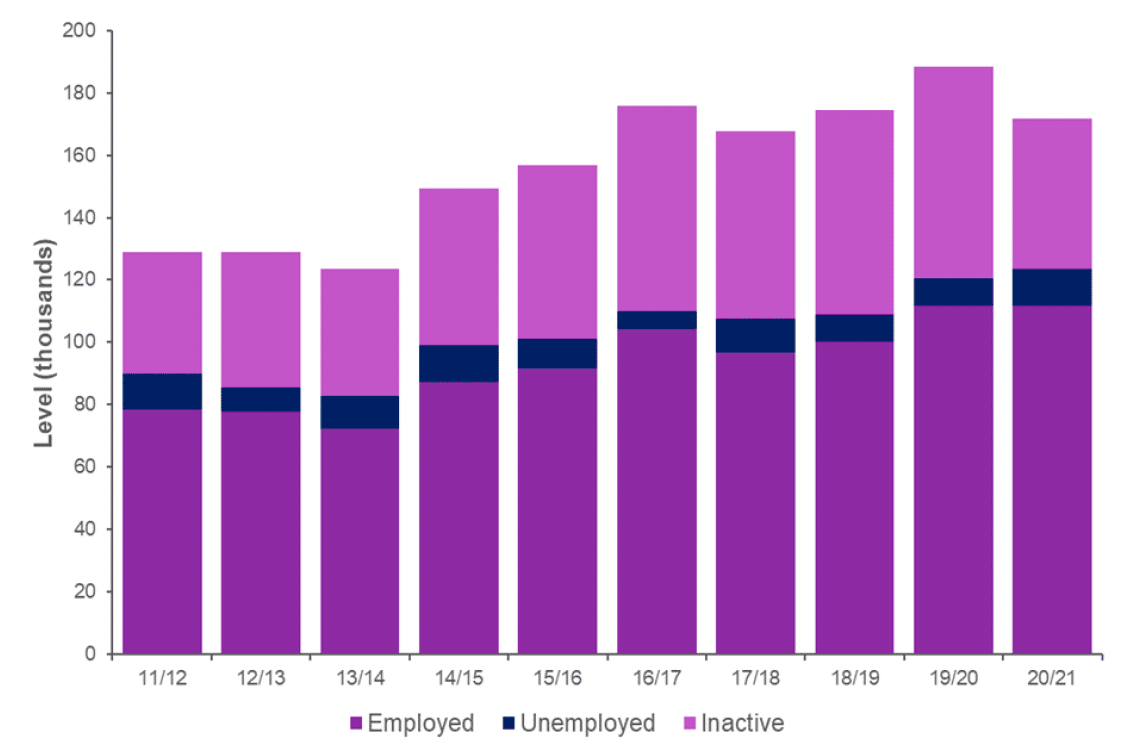
There has been little change in the level of employment for the Minority Ethnic population. The employment rate is calculated based on those in employment as a percentage of the minority ethnic population aged 16-64 years. The APS estimates that the minority ethnic working age population has decreased over the year from April 2019 to March 2020, compared with April 2020 to March 2021, the decrease has been largest in the economic inactivity group.
Source: Annual Population Survey, April-March datasets, ONS
The minority ethnic employment gap was much higher for women than men. In April 2020-March 2021, the minority ethnic employment gap was estimated at 13.2 percentage points for women and at 2.2 percentage points for men. The minority ethnic employment gap for women represents a statistically significant difference between the employment rates for the minority ethnic and white populations.
In April 2020-March 2021, the minority ethnic employment gap was estimated to be largest for those aged 25 to 34 (16.7 percentage points); followed by ages 35 to 49 (14.4 percentage points), ages 16 to 24 (7.2* percentage points) and ages 50 to 64 (-8.3 percentage points, where the minority ethnic employment rate is higher than the white employment rate). The minority ethnic employment gaps for 25 to 34 year olds and 35 to 49 year olds represent statistically significant differences between the employment rates for the minority ethnic and white populations.
Contact
Email: lmstats@gov.scot