Coronavirus (COVID-19) asymptomatic testing programme: evaluation - November 2020 to June 2021
This evaluation report examines the asymptomatic testing programme in Scotland. It covers the period November 2020 to June 2021.
The Public Health Impact of Asymptomatic Testing
It is important to note from the outset that the data discussed in this chapter reflects reporting of results. There may be greater uptake of testing, but if individuals do not report their results this picture will not be reflected in the data. The data picture for testing is complex and will inevitably be incomplete, but we provide as robust a picture as possible in the data below.
How many positive cases have been identified in total via LFD and through which pathways? What is the PCR conversion rate?
In total, between 19 November 2020 and 27 June 2021 there have been 14,728 positive LFD tests recorded.[10] People are requested to get a confirmatory PCR test if their LFD test is positive.
Over a similar but slightly different time period (23 November 2020 to 25 June 2021), 72% of positive LFD results were followed up with a PCR test and 81% of these were confirmed as positive. Therefore, the LFD testing programme identified 7,271 confirmed cases during the evaluation period. These are cases that may not otherwise have been detected in the absence of symptoms, or were identified earlier than they otherwise would have been via PCR-based testing once symptomatic.[11]
| Positive LFDs Reported | % with confirmatory PCR | Total PCRs | % Positive PCR | Number Positive PCR |
|---|---|---|---|---|
| 12,595 | 72% | 9,028 | 81% | 7,271 |
(Source: Public Health Scotland)
Overall, the pathway that has identified the most cases in terms of numbers via LFD testing is 'Other', which mainly includes the Universal Testing offer. This is followed by Schools and Healthcare Worker pathways.[12] Table 2 provides these numbers and some more detail, but the table requires some further contextualisation. The different pathways presented on Table 2 have a range of different start dates and models of implementation; some of these pathways are self-test only, while some provide assisted testing. They are therefore not directly comparable and the presentation on one table is for ease of overview rather than direct comparison. The positivity rates for each pathway are also provided, but it should be noted that this rate depends on individuals recording test results, and in particular their negative results, which our evidence suggests may not be the case. Table 2 is taken from the PHS weekly report.[13]
| Testing Pathway | Number of tests reported | Number of positive tests | % LFD positive |
|---|---|---|---|
| School | 1,925,138 | 2,378 | 0.1% |
| Healthcare Worker | 1,714,434 | 1,811 | 0.1% |
| Other (including Universal offer) | 994,671 | 8,127 | 0.8% |
| Care Home Staff | 888,502 | 563 | 0.1% |
| Social Care | 354,435 | 228 | 0.1% |
| Unspecified | 248,857 | 714 | 0.3% |
| Care Home - Visitor | 224,708 | 72 | 0.0% |
| University Testing | 95,497 | 371 | 0.4% |
| Primary Care And Independent Contractors | 91,304 | 37 | 0.0% |
| Community Testing | 55,397 | 378 | 0.7% |
| Care Home - Visiting Professional | 29,588 | 22 | 0.1% |
| Emergency Control Room Staff | 23,406 | 23 | 0.1% |
| Food Processing | 2,773 | * | * |
| Quarantine Hotel Staff/Security Personnel | 1,940 | * | * |
| Total | 6,650,650 | 14,728 | 0.2% |
It is also important to note the additional use of asymptomatic PCR testing, occurring in Community Testing, Healthcare Workers, and Prisons pathways. At the time of this evaluation concluding, 59% of community testing was asymptomatic. Of these asymptomatic tests, 64% was occurring via asymptomatic PCR testing in Mobile Testing Units (MTUs). 5,202 asymptomatic cases were identified out of 133,931 asymptomatic tests, giving a positivity rate of 3.9%.
In the Prisons pathway, the full rollout of testing to all eligible staff began in May 2021. The table below shows the weekly number of tests completed since full rollout, with a total of 2,510 carried out. Some additional tests were carried out prior to full rollout, meaning 3,660 PCR tests have been conducted in the Prisons pathway since March 2021 to the end of the evaluation period.
| Week Beginning | 24-May | 31-May | 07-Jun | 14-Jun | 21-Jun | 28-Jun | Cumulative total |
|---|---|---|---|---|---|---|---|
| No. of tests | 436 | 443 | 429 | 399 | 350 | 453 | 2,510 |
(Source: NHS/Scottish Prison Service)
From the 2,510 PCR tests carried out since full rollout, 5 positive cases have been identified. This gives a positivity rate of 0.2%.
In the Healthcare Worker pathway, asymptomatic PCR testing has been available since July 2020 to the following staff: oncology and haemo-oncology, in wards and day patient areas including radiotherapy; in wards caring for people over 65 where the length of stay is over 3 months; in wards within mental health services where the anticipated length of stay is over 3 months. Uptake of PCR testing has been consistently high in these areas, at over 90%.
Has uptake of testing changed over time? Does this differ by pathway?
Uptake of testing is difficult to measure as we know that not everyone records their test result. Population survey findings (YouGov polling) find that around 40% of people say they record their test results. This is an important caveat to the data gathered from testing across pathways and provided by Public Health Scotland.
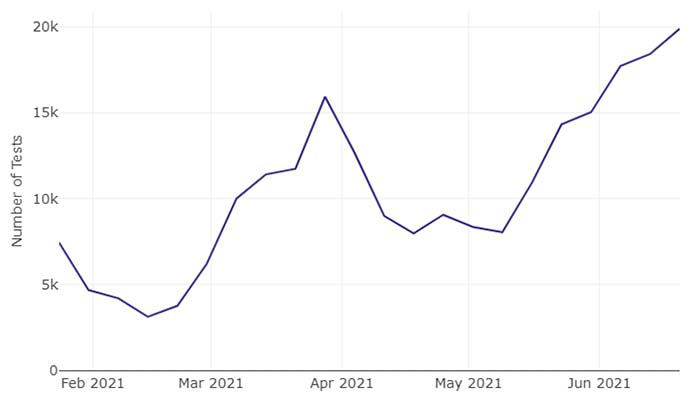
In total, between 19 November 2020 and 27 June 2021, 6,650,650 LFD test results were recorded (Source: PHS weekly report). The number of tests recorded increases over time as shown in the chart below. During this time period, 809,310 individuals have recorded at least one test result.

(Source: Public Health Scotland)
Some of the pathways have been able to provide more detailed information on uptake.
Community Testing: Uptake within the Community Testing pathway has generally also increased over time, as the graph below shows. This uptake data includes asymptomatic and symptomatic testing, however, so it is difficult to fully disaggregate the asymptomatic uptake (this data includes both Asymptomatic Testing Sites and Mobile Testing Units).
(Source: Public Health Scotland)
Healthcare workers: Looking at Healthcare workers specifically[14], over any 4 week period health care workers would be expected to take 8 LFD tests. Figure 2 shows that around 10% of eligible staff have been recording results to this extent. More staff are choosing to test and record results less than twice weekly. Staff may also be testing more than this data would suggest, but not recording results. It should also be noted that the number of staff testing has declined over this period from a peak of around 81,000 in mid-March to just over 52,000 at the end of June.
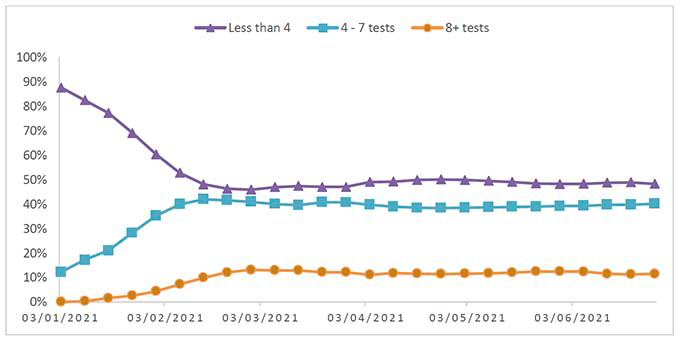
(Source: Public Health Scotland)
Highest risk group: From the 1,986 highest risk individuals who responded to an opt-in survey about the use of the universal offer in their household, over half (55%) indicated that they had ordered lateral flow tests after receiving a letter or text about the service from the Scottish Government. Of the 55% who had ordered tests, 34% said they took them as a one off, 25% said once a week, 40% said twice a week and 1% said more than twice a week. For adults who lived with those on the highest risk list, 33% said they took them as a one off, 25% said once a week, 41% said twice a week and 1% said more than twice a week.
Police Scotland and SFRS: The latest information available from partners (provided at the Board meeting on 7 June 2021) refers to 35%-40% uptake for PS staff. Similar evidence applies to SFRS.
Prisons: The Prisons pathway was able to provide data on the number and percentage of eligible staff consenting to take part in PCR testing since full rollout in May. This has been steady at around 40% in the weeks following. Staff mentioned some concerns about diminishing engagement, but over the period of the evaluation numbers were relatively steady.
| Week beginning | 24-May | 31-May | 07-Jun | 14-Jun | 21-Jun | 28-Jun |
|---|---|---|---|---|---|---|
| Number of eligible staff consenting (all eligible=5,157) | 1,995 | 2,075 | 2,131 | 2,168 | 1,984 | 2,063 |
| % of eligible staff consenting | 39% | 40% | 41% | 42% | 38% | 40% |
(Source: NHS/Scottish Prison Service)
Schools: Figure 3 shows that testing uptake and/or reporting in schools has declined for staff, pupils and childcare workers. In mid-March, around 42% of staff were recording test results but by mid-June this dropped to 28%. Testing and reporting of results among pupils was considerably lower. However, our evidence suggests that it is likely people have been taking tests but not recording their positive results, and that there may have challenges for some in accessing the online portal, indicating that uptake may be higher than these figures suggest.
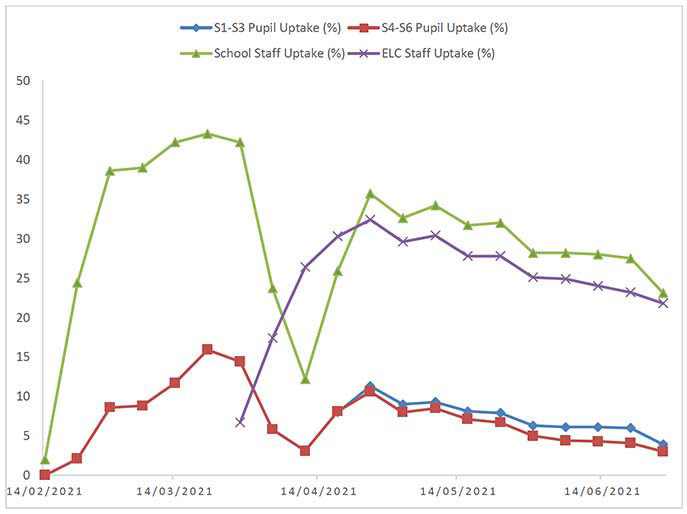
(Source: Public Health Scotland)
Universal offer: The Scottish Government/YouGov survey of 1,000 members of the public conducted between 29-30 June asked about uptake of the universal offer. This found that 37% of people had accessed tests via the universal offer, 29% had used tests, 14% were testing at least once a week, and 9% were testing at least twice a week and had reported their last test result.
University and College: Responses to the survey in this pathway reported low demand, with the same students and staff returning regularly. Other responses stated that demand rose when people wanted to return home, go out or during local outbreaks. It was stated that home tests were preferred to on site testing. These results are set within a context of home testing not being available to universities until the start of the academic year 2021/22. Most students were also unable to return to in-person learning after the Christmas break in January 2021 due to the return to lockdown, which will have had a significant impact on uptake of on-campus asymptomatic testing.
Overall, workplaces do seem to be a key site of engagement with asymptomatic testing, where the encouragement or requirement to test keeps people testing regularly and recording results. This appears to be particularly the case for the earlier testing pathways, set up before there was a wide range of options for testing. Those testing outwith work settings are more likely to use testing sporadically than as intended (i.e. twice weekly testing).
The time period of this evaluation covers the earlier stages of the asymptomatic testing programme – demand has much increased since, as the pathways have established themselves. We would therefore assume that further confirmed cases have been established by the overall programme and contributed to the aim of reducing negative outcomes from Covid-19.
What is the profile of those tested and those that test positive in total and for each pathway? Is there a particular pathway that has a better 'reach'?
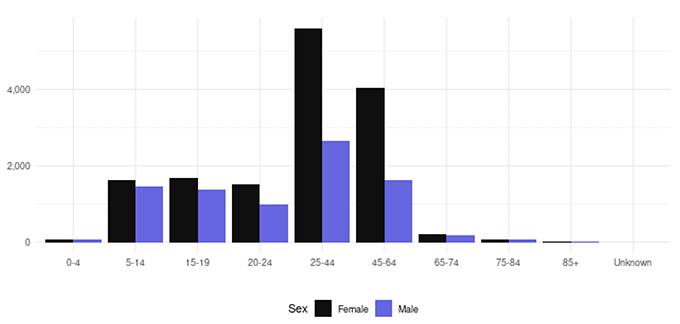
Overall, more women than men have recorded an LFD test result, and these are most likely to be aged 25-64. This may well reflect the larger number of women who work in schools, social care and health services and, potentially, gender differences in healthcare-seeking behaviours. More women have also recorded a positive test result.
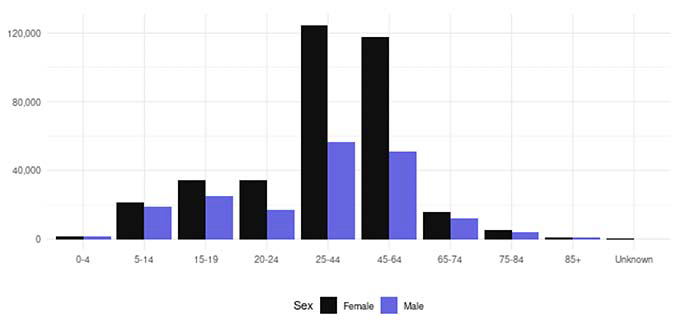
(Source: Public Health Scotland)
(Source: Public Health Scotland)
More people in the least deprived areas have recorded a test result, either positive or negative. However, more people in the most deprived areas have recorded a positive result.
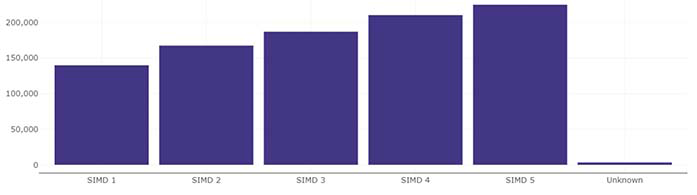
(SIMD 1 = most deprived; SIMD 5 = least deprived)
(Source: Public Health Scotland)
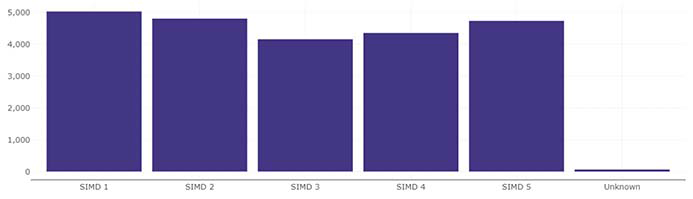
(Source: Public Health Scotland)
Demographic data is not currently available for each pathway.
Contact
Email: socialresearch@gov.scot