Soil organic carbon sequestration: scoping study
A report evaluating the ability of existing datasets to answer questions regarding the status of organic carbon in Scottish soils.
8 What is the potential for Scotland’s soils to store more, or to lose carbon?
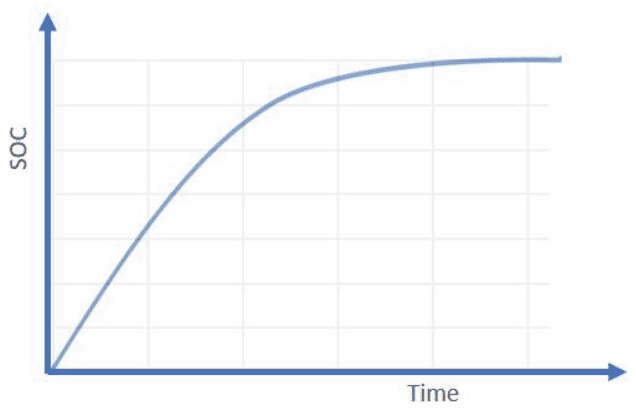
In a report to ClimateXchange (CxC) Yeluripati et all. (2018) wrote that the ‘amount of carbon that accumulates in soil is finite’. Using evidence from long-term experiments a Rothamsted Research station, Poulton et al. (2018) showed that the annual rate of soil carbon accumulation is non-linear (Figure 9) with greater SOC accumulation observed soon after the land management or land use change and slowing as the soil reaches a new equilibrium. Their observations were carried out over 160 years of recorded soil management practices. What was also clear was that the initial SOC content determines the rate at which SOC accumulates.
The work by Poulton et al. (2018) was with respect to the 4 per mille initiative where land managers are encouraged to increase SOM stocks by 0.4% per year and their conclusion was that, while possible, the management practices required were not practicable. Minasny et al. (2018) reviewed soil sequestration rates from 20 case studies around the world and concluded that ‘In regions with high inherent SOC content, it may prove difficult to further increase their C levels, as these areas may already have reached equilibrium with current practices.’ This proves to be a complex issue and requires a thorough and rigorous evaluation of the relevant literature.
8.1 Estimating potential losses or gains of SOC from observed data
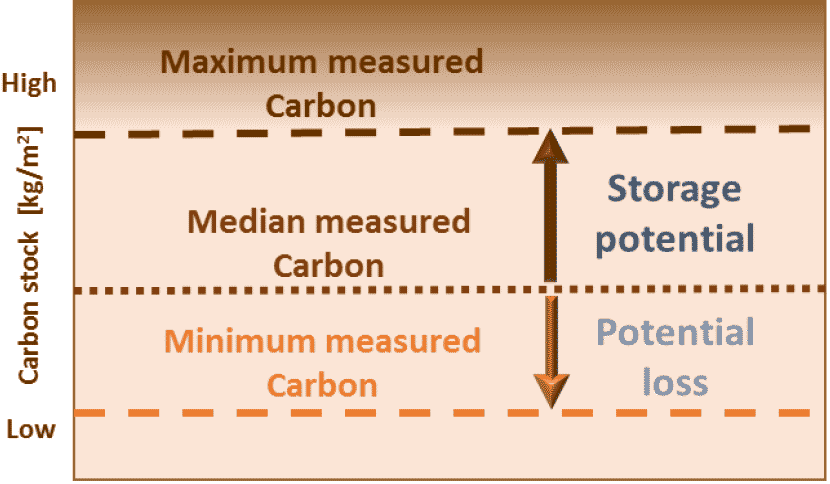
In 2013, Lilly and Baggaley took a simpler approach to evaluating the potential for Scottish cultivated topsoils to store additional SOC. This evaluation was based on the SOC concentrations in the Representative Soil Profile dataset. The observed median (middle value of the data), minimum and maximum SOC concentration of mineral topsoils were determined for each of the soil 313 individual soil types shown on the National Soil Map of Scotland (Soil Survey of Scotland Staff, 1981) and were deemed to be cultivated using a land cover map. The topsoil SOC stock was then calculated for each of the soils using estimated horizon thickness and predicted bulk densities. The Potential to gain SOC was then calculated by subtracting the median value for the maximum and the potential to lose SOC was calculated by subtracting the minimum SOC concentration from the median (Figure 10).
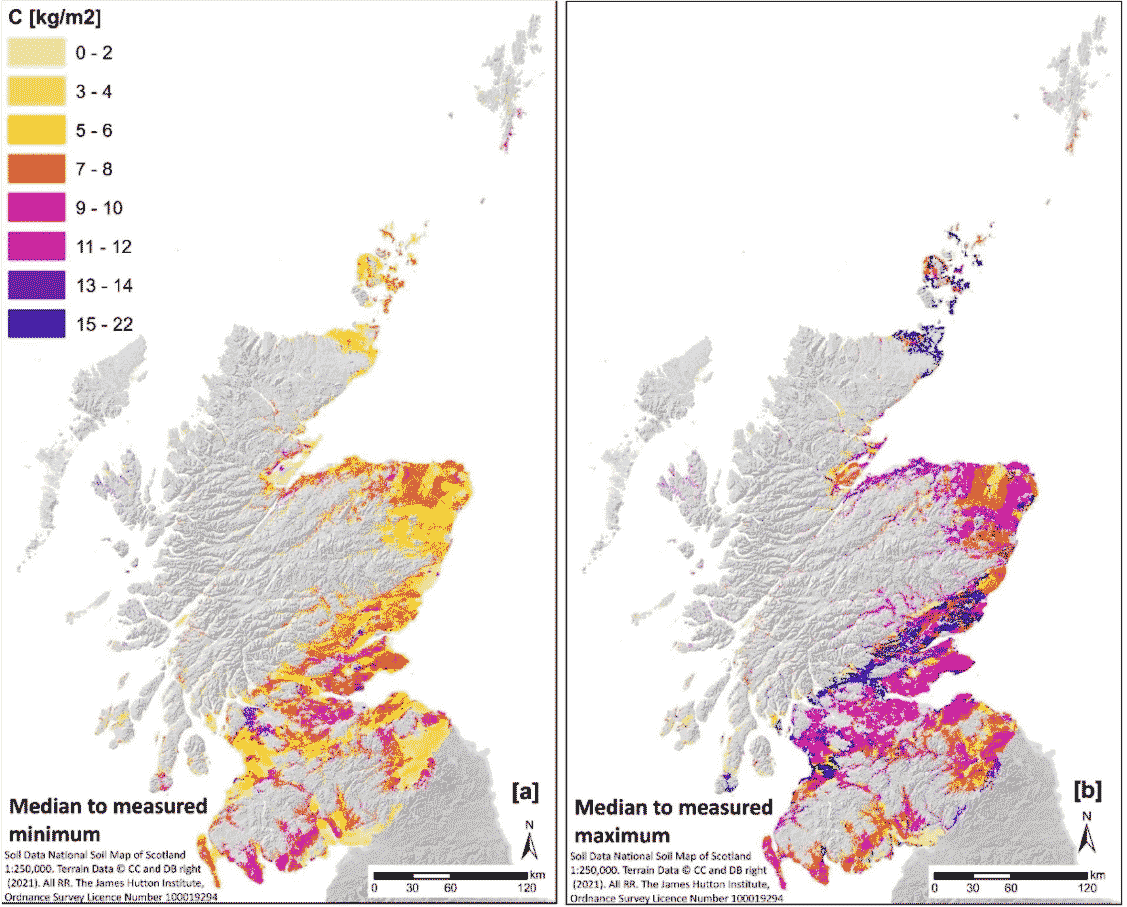
They estimated that there was the potential to store an additional 174 Mt C but there was the potential to lose 112 Mt C if SOC concentrations fell to the minimum value observed for each soil type in the database. They mapped both the potential losses and potential gains (Figure 11) on what was the most up to date digital version of the Soil map of Scotland.
Later they modified this evaluation to calculate potential gains and losses for grasslands and arable land separately (Yeluripati et al., 2018). They estimated that the potential additional storage capacity for grasslands was 60 Mt (range 48-86 Mt) and for soils under arable it was 88 Mt (range 78-104 Mt). However, this was based on an assumption that soils under grassland had, on average 1.4% SOC more than arable land which is slightly more than shown in Table 1.
Even with this approach key questions remain: are the observed maximum and minimum values the actual maximum and minimum, how long would it take to reach the maximum and what management practices are required to increase SOC stocks, how long would it take to reach the minimum and what management practices would lead to a decrease in SOC stocks? While there are simple ways to estimate the absolute minimum SOC content based on the proportion of fine silts and clays in the soil (for example, Hassink et al.,1997; Paterson et al., in press) the maximum value is much more difficult to determine.
In 2019, Yeluripati et al. produced a list of practices to sequester soil organic carbon in agriculture soils. They assessed their feasibility for Scottish conditions and gave estimated rates of sequestration. The list included reduced or no tillage, increased residue returns, fertilising and liming, crop rotation and organic manures, catch crops and changes in grazing intensity.
8.2 Impact of land use change on SOC
The role of land use change in both the loss and gain of SOC is complex with often conflicting evidence. Recent reports and papers (Smith et al., 2004; Rees et al., 2017; Yeluripati et al., 2018; Lilly et al., 2020) have attempted to collate existing information but it is clear that there are few data specifically on Scottish and/or UK soils. Some of the data do support the supposition that conversion to arable production systems can lead to a loss of SOC, while increasing the length of time a soil is under grass tends to lead to gains in SOC (Rees et al., 2018). Table 6 summaries some of the like likely impacts on SOC due to land use changes but this is a considerable simplification and within different land uses, different management practices can also influence both the rate and amount of SOC sequestration or loss. There is also conflicting evidence in upland systems, for example, the conversion of moorland to forestry. Lilly et al. (2016) reported an increase in SOC stock after a period of between 12 and 57 years since planting but Friggens et al. (2020) reported either loss or no change in SOC stock after 12 and 39 years.
Much of the literature is concerned with measuring the impacts of land use change and less so with changes due to different management options. There is a considerable number of papers that report changes in SOC with land use change. A search of an online database of scientific papers published since 2010 for the terms ‘Soil carbon sequestration AND grassland’ for papers, produced over 1800 results which were reduced to 870 when studies from South American and Asian countries were removed. A similar search for papers on ‘arable’ rather than grassland yielded over 500 papers, reducing to 340 when studies from South American and Asian countries were removed. While many of these are unlikely to provide sequestration rates or potential losses due to land use change specific to Scottish conditions, it would need a considerable effort to review and identify the ones with meaningful data to answer the question on the impact of land use change on Scottish soils, and importantly, the management practices that influence SOC contents.
| From To |
Arable | Grassland | Semi-natural grazing land |
Agroforestry | Forestry |
|---|---|---|---|---|---|
| Arable | ↓ | - | - | ↓ | |
| Grassland | ↑ | ↓ | - | ↑↓ | |
| Semi-natural grazing land | - | ↑ | - | ↑↓ | |
| Agroforestry | ↑ | ↑↓ | - | ↑↓ | |
| Forestry | ↑ | ↑ | ↑↓ | - |
Note: ↑ SOC increase; ↓SOC decrease; ↑↓ Can be either increase or decrease; - no information