Soil organic carbon sequestration: scoping study
A report evaluating the ability of existing datasets to answer questions regarding the status of organic carbon in Scottish soils.
6 How much carbon is stored in soils under different land uses
Appendix 1 shows the range of existing datasets that have SOC concentrations or stocks, or LoI data and which specific land uses the data represent. In some cases, such as the Representative Soil Profile dataset, the National Soil Inventories or the Countryside Survey, the data are from a number of habitats from lowland arable to montane while others are restricted to one or two land uses.
While some of the soils have been sampled in more recent times, some are either older or cover a long time period, and some are still being added to. All these datasets are useful; the most recent can help establish current SOC concentrations or stocks while the older datasets could be re-sampled to provide estimates of change over time in specific land uses.
6.1 SOC concentrations in relation to land use
The data in the Scottish Soils Database includes a record of the land use at the time the soils were sampled. These data can be used to calculate mean topsoil SOC concentration for soils under arable, rotational or permanent grassland (Table 1). Other datasets with similar SOC concentration data are shown in Table 2 though not all have the capacity to differentiate between these three land uses in the cultivated soils. Although there are data on SOC concentrations in rotational grassland, permanent grassland and arable land, the time since the land changed from arable to rotational grassland or vice versa is not recorded in these data sets. The same soil types occur in each of the three cultivated land use categories suggesting that land use is the main driver of the difference but other factors such as climate that predisposes an area to a particular land use (for example, arable land in eastern Scotland) cannot be wholly ruled out and requires further analyses.
| Land cover | SOC % | SOM % | Sample number | ||||||
|---|---|---|---|---|---|---|---|---|---|
| Mean | sd | 5%ile | 95%ile | Mean | sd | 5%ile | 95%ile | ||
| Arable | 3.48 | 2.03 | 1.37 | 7.16 | 6.0 | 3.5 | 2.36 | 12.34 | 2992 |
| Rotational grass | 4.4 | 1.98 | 2.09 | 7.7 | 7.59 | 3.41 | 3.6 | 13.27 | 545 |
| Permanent grass | 4.72 | 2.23 | 2.22 | 8.52 | 8.14 | 3.84 | 3.83 | 14.69 | 310 |
Note: no account is taken of the likely differences in measured SOC over time.
The Countryside Survey data measures carbon concentration, and bulk densities, for the top 15 cm of soil, allowing for the calculation of carbon stocks to this depth (Table 2). In 2007 the soils were sampled at 3 to 5 locations within each of 196 1 km grid squares in Scotland. As this survey was initially designed to investigate changes in vegetation, the soil types at the locations were not identified. Therefore, the results can be used to produce average values for broad habitat types (arable and horticultural land, improved grassland, various semi-natural grasslands, deciduous woodland, coniferous woodland, heather moorland and peatlands).
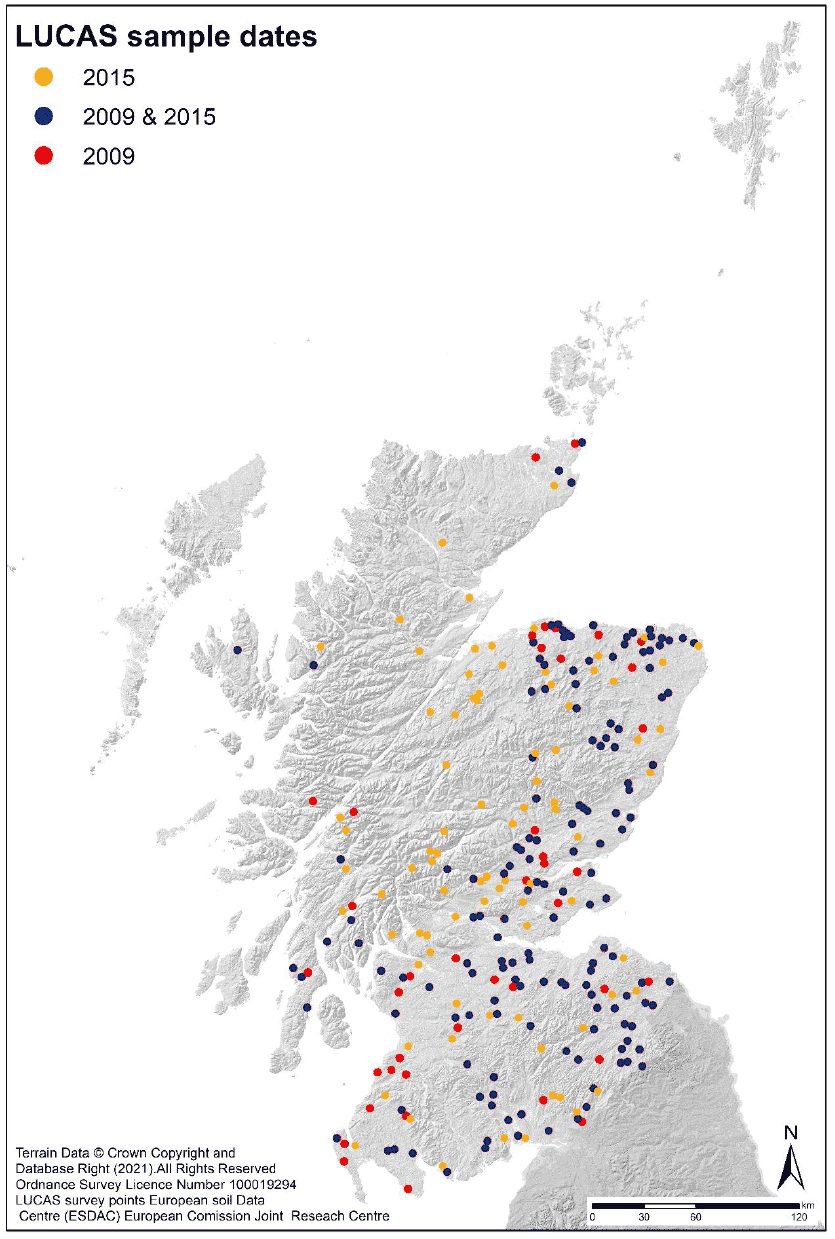
The LUCAS (Land Use and Cover Area frame Survey) dataset from a survey conducted in 2009 and in 2015 has been published by the European Soil Data Centre (JRC, Ispera). The LUCAS sampling frame was designed to survey land use in EU member states and comprised more than 250,000 sample locations. In 2009, the topsoil SOC concentrations was measured at a subset of these locations (around 20,000), 190 sites in Scotland. In 2015, 234 sites were sampled in Scotland (Figure 7) and this dataset also has measured carbon concentrations as well as recorded land cover at each point of which 156 are in arable and improved grasslands (Table 2).
| Source | SOC % | SOM % | n | |||
|---|---|---|---|---|---|---|
| Date | Mean | sd | Mean | sd | ||
| LUCAS (Arable) | 2015 | 2.54 | 0.98 | 4.38 | 1.69 | 52 |
| LUCAS (Temporary grassland) | 2015 | 3.62 | 1.41 | 6.24 | 2.44 | 4 |
| LUCAS (Grassland) | 2015 | 7.29 | 7.44 | 12.57 | 12.83 | 100 |
| Countryside Survey (Arable) | 2007 | 3.23 | - | 5.57 | - | - |
| Countryside Survey (improved grassland) | 2007 | 6.46 | - | 11.14 | - | - |
| East of Scotland Arable Farms | 2007 | 2.89 | 0.81 | 4.98 | 1.4 | 27 |
One way to assess the differences in SOC concentration under arable, rotational grass or permanent and long ley pastures is to make use of the annual Integrated Administration and Control System (IACS) land use data. IACS data contains information on the land use history of the fields and is available digitally from 2000. If positional accuracy of the measurements of carbon is sufficient to confidently place them within a field, then it may be possible to use the land use data in the IACS dataset to determine the sequence of crops and grass to establish the length of time a field has been in pasture or a grass ley with respect to the time the soil sample was taken.
Data sets such as the LUCAS data from 2009 and 2015 and NSIS 2007/2009 and East of Scotland Arable Farms, have sufficient time between the start of the available IACS records and sampling to potentially be able to explore the impact of longer-term management on SOC at a national level. In additional smaller scale surveys, such as the aggregate stability and East of Scotland experimental farms could be added to the analysis (Appendix 1). The Countryside Survey data is only available under licence but if the sample location was known precisely, it could also be used with IACS data to investigate the effect of grassland rotations on changes in SOC. A more thorough analyses of each dataset would be required to assess its usefulness in distinguishing SOC concentrations by land use.
Carbon concentration is a less useful measure in upland soils where the surface layer is often organic. As seen in Figure 2, the SOC concentration of many of these layers are > 50% which is roughly 86 % SOM. The more useful measure is SOC stocks as this takes into account the thickness of the horizon and the density of the soil. Losses or gains in SOC stocks in these soils is often through the accumulation or soil of the thickness of these surface organic layers.
There are a number of additional regional or local datasets that are specific to one land use that could be investigated to provide additional information on the SOC concentrations of Scottish soils. While some of these form part of the Scottish Soils Database (for example, the Farm Grid and Soil map unit transect studies) along with the National Soil Inventories and Representative Soil Profile dataset and are readily accessible, others, for example, the data held by SRUC/SAC in the Scottish Soil Fertility database could be investigated if issues around confidentiality were overcome.
6.2 SOC stocks in relation to land cover
As seen in Appendix 1, there are few datasets with the necessary measurements to calculate stocks for soils in the open uplands (Table 3). The National Soil Inventory of Scotland (2007-9), the Countryside survey and the Alpine mosaics datasets can be used to calculate stocks. While the Alpine Mosaics dataset is limited to montane environments, the National Soil Inventory of Scotland (2007-9) and the Countryside survey encompass a wide range of upland and lowland habitats.
| Land cover | Carbon t ha-1 | Number of sites |
|---|---|---|
| All | 270.3 ± 15.2 | 179 |
| Arable | 111.5 ± 15.6 | 16 |
| Improved grassland | 138.1 ± 21.4 | 33 |
| Semi-natural grassland | 185.2 ± 27.1 | 26 |
| Woodland | 267.5 ± 40.5 | 26 |
| Moorland | 290.8 ± 26.3 | 46 |
| Bog | 528.3 ± 23.0 | 32 |
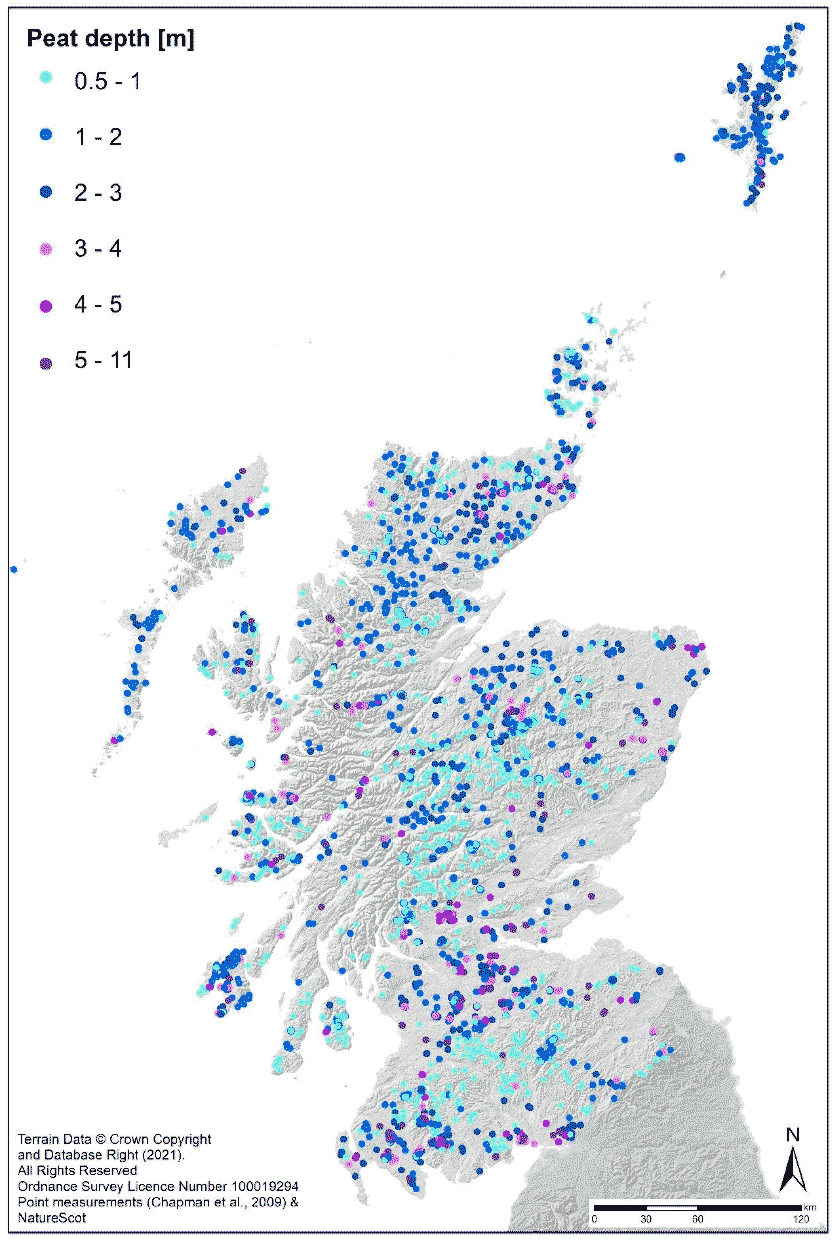
It is worth noting that the Bog category in Table 3 does not take into account the SOC stored in peat below 100 cm. The peat depth data from NatureScot has locations where depths greater than 10 m have been recorded (Figure 8). Work is currently underway to revisit the Chapman et al. (2009) estimates of SOC stocks in peat below 100cm.
The Countryside Survey data shows SOC stocks in a range of broad upland habitats, but it only to 15 cm depth. Typically, organic surface layers in upland peaty soils are greater than 15 cm thick therefore the Countryside Survey underestimates the total stock of SOC in Scottish upland soils.