Sandeel fishing consultation: strategic environmental assessment - draft environmental report
The draft environmental report produced from the strategic environmental assessment on proposals to close fishing for sandeel in all Scottish waters.
4. Environmental Baseline
4.1 Introduction
4.1.1 This section of the Environmental Report describes the character of the environment which may be affected by the proposed extension of the existing closure in SA4 to all Scottish waters. The focus of this baseline information is therefore on Biodiversity, Flora and Fauna; and Water quality, resources, and ecological status (the ecological status of sandeel and other commercially fished species that interact with sandeel), reflecting the scope of the assessment as described in Section 3.3.
4.2 Biodiversity, flora and fauna
4.2.1 Sandeel represent the most abundant species group in the North Sea and play a key role in North Atlantic marine food webs.[41] Species that interact with sandeel include several species of seabird,[42] grey and harbour seals,[43] cetaceans such as minke whale[44] and harbour porpoise,[45] and several species of commercially important fish (see Section 4.3).
Seabirds
4.2.2 Scotland holds internationally important numbers of breeding seabirds, with 24 species regularly breeding in Scotland.[46] A large proportion of these species include sandeel in their diet during the breeding season.
4.2.3 Several seabird species include sandeel as a major component of their diet and so are a focus of the baseline and SEA:
- Black-legged kittiwake Rissa tridactyla
- Atlantic puffin Fratercula arctica
- Razorbill Alca torda
- European shag Gulosus aristotelis
- Black guillemot Cepphus grille
- Common guillemot Uria aalge
- Arctic tern Sterna paradisaea
- Sandwich tern Thalasseus sandvicensis
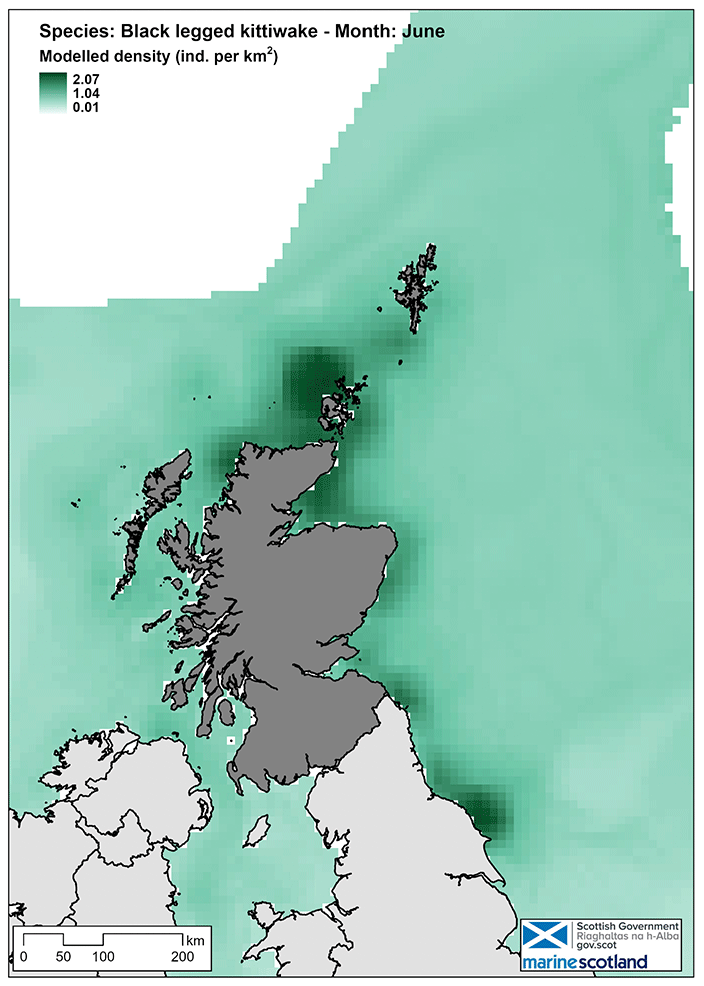
4.2.4 Black-legged kittiwake are broadly distributed in Scottish waters with breeding colonies distributed across the whole Scottish coastline (Figure 6). Most recent surveys have estimated that there are 367,000 breeding pairs in the UK and during the non-breeding season 1,319,000-1,742,000 birds are estimated to be present in UK waters, although there is a high degree of uncertainty around this estimate.[47] The UK Kittiwake breeding population constitutes 12.3-14.8% of their North Atlantic biogeographic population. Seventy-seven percent of the UK breeding population reside in Scotland. Their conservation status in UK waters is unfavourable. They are an OSPAR red-listed species.
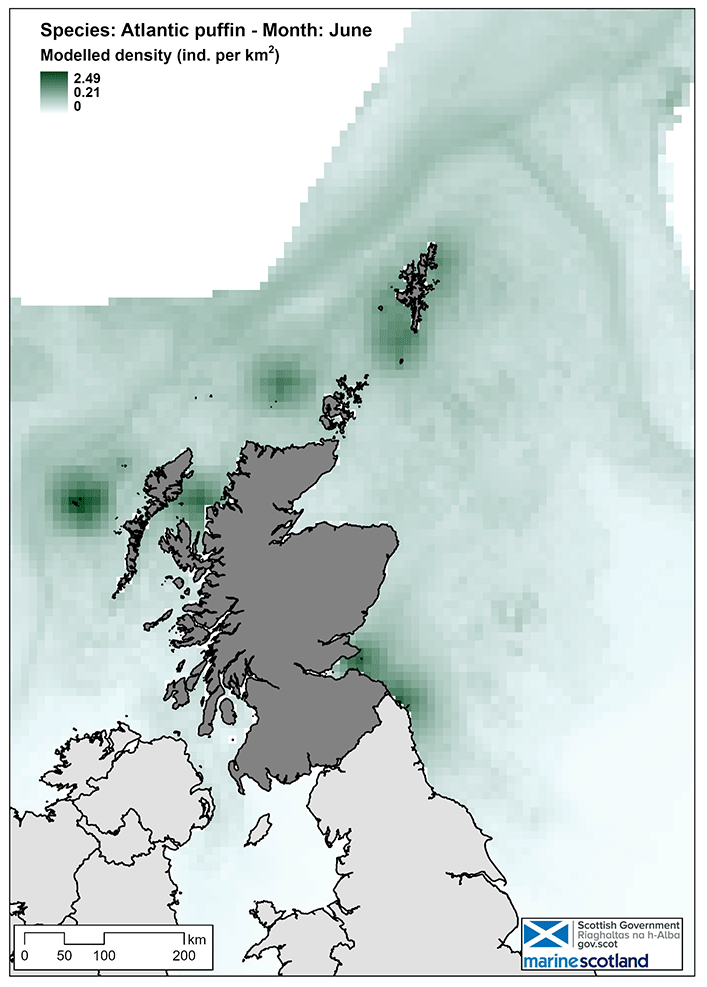
4.2.5 Atlantic puffin are broadly distributed in Scottish waters, with breeding colonies concentrated on Northwest Scotland, the Western Isles, the Northern coast, Orkney and Shetland, and Southeast Scotland (Figure 7). Most recent surveys have estimated that there are 580,000 breeding pairs in the UK with 537,000 individuals estimated to occur in UK waters during the non-breeding season.[47] The breeding population of Atlantic puffin in the UK make up 9-11% of their Atlantic biogeographic population. Eighty-five percent of the UK breeding population reside in Scotland. Their conservation status in UK waters is unfavourable.
4.2.6 Razorbill are broadly distributed in Scottish waters with breeding colonies distributed across the whole Scottish coastline. Most recent surveys have estimated that there are 110,000 breeding pairs in the UK, 560,000 individuals estimated to be present during the non-breeding season.[47] The UK breeding population of razorbill constitutes 21% of their Northwest Europe biogeographic population. Eighty-five percent of the UK breeding population reside in Scotland. Their conservation status in UK waters is unfavourable.
4.2.7 Black guillemot are distributed very close inshore around the coast of West, North and North East Scotland. The number of breeding pairs in the UK is estimated to be 26,000 at the most recent count.[47] There are estimated to be 120,000 individuals present in UK waters during the non-breeding season. Black guillemot in UK waters make up 18-36% of their northern North Atlantic biogeographic population. Eighty-eight percent of the UK breeding population reside in Scotland. Their conservation status in UK waters is unfavourable.
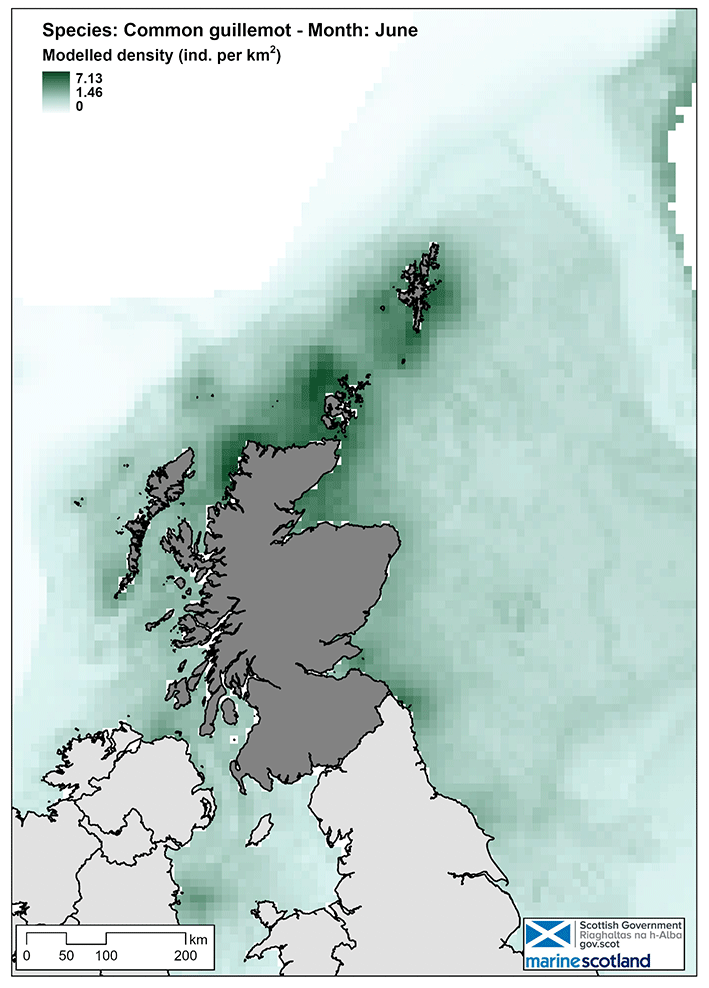
4.2.8 Common guillemot are broadly distributed throughout Scottish waters with breeding colonies distributed around the whole Scottish coastline (Figure 8). Most recent surveys have estimated that there are 890,000 breeding pairs in the UK, with 2,577,000 individuals present in UK waters during the non-breeding season, although there is a high degree of uncertainty around this estimate.[48] Common guillemot in UK waters make up 31-32% of their North Atlantic biogeographic population. Eighty-eight percent of the UK breeding population reside in Scotland. Their conservation status in UK waters is unfavourable.
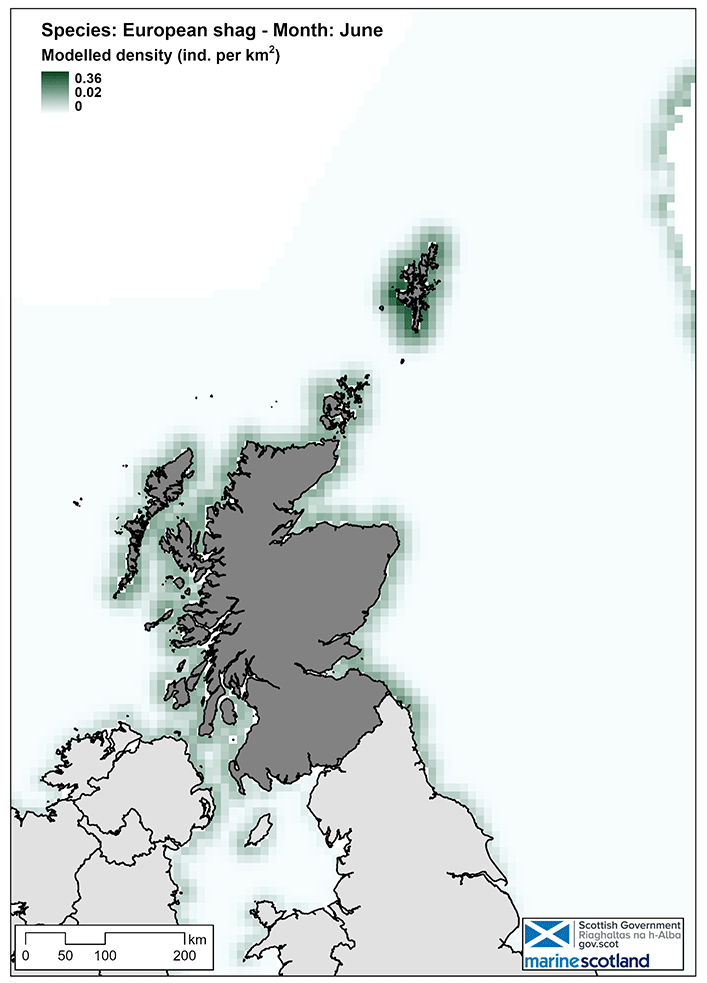
4.2.9 European shag are broadly distributed around the Scottish coast with breeding colonies distributed across the whole Scottish coastline (Figure 9). Most recent surveys have estimated that there are 28,000 breeding pairs in the UK and 96,000 individuals present during the non-breeding birds.[48] Shag in UK waters make up 40-44% of their coastal northern Europe biogeographic population. Seventy-eight percent of the UK breeding population reside in Scotland. Their conservation status in UK waters is unfavourable.
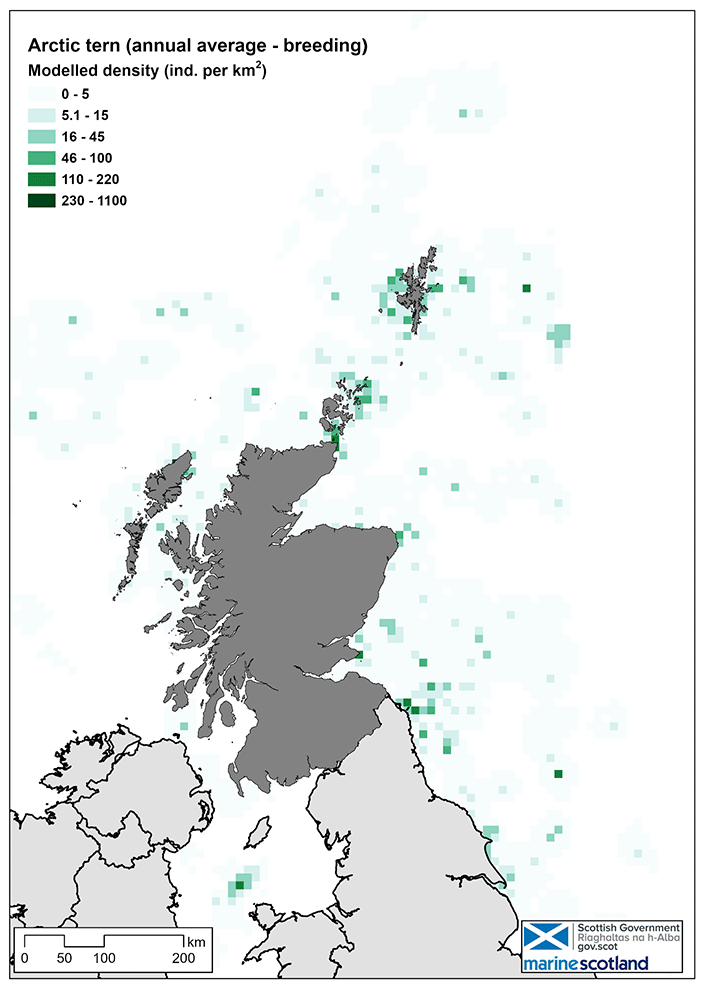
4.2.10 Arctic tern are distributed around the Scottish coast with high concentrations of breeding colonies in Shetland, Orkney and the Western Isles and lower abundances found around the rest of the Scottish coast (Figure 10). Most recent surveys have estimated that there are 52,600 breeding pairs in the UK, all of which migrate to the South Atlantic or Antarctica for the Austral summer.[48] Arctic tern in UK waters make up 2.9-3.5% of their European and North Atlantic biogeographic population. Ninety percent of the UK breeding population reside in Scotland. Their conservation status in UK waters is unfavourable.
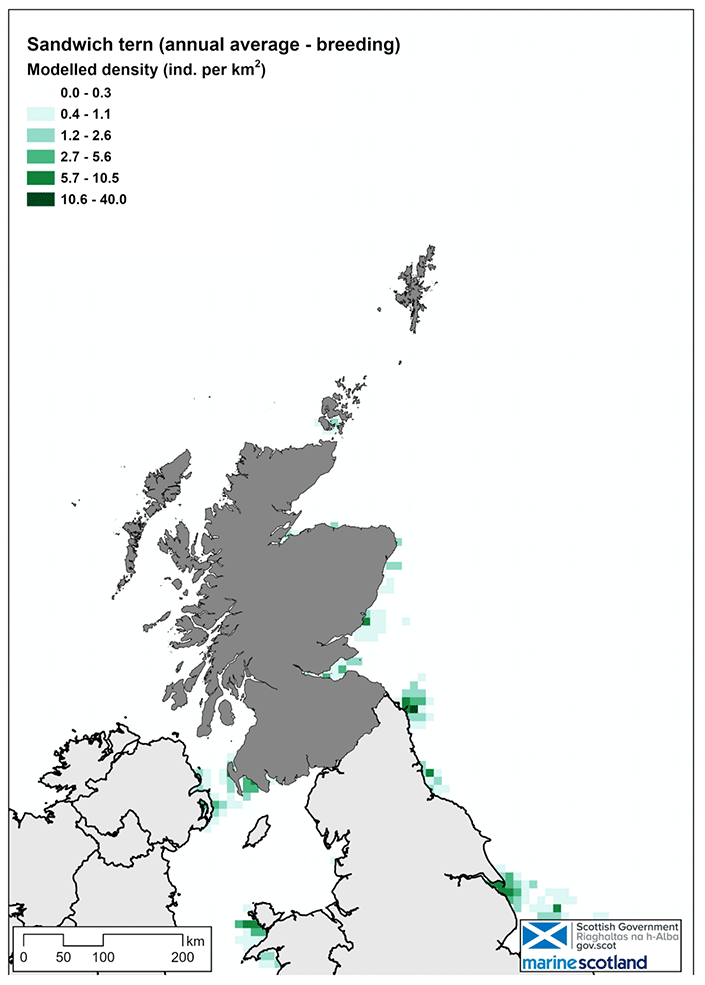
4.2.11 Sandwich tern are present around the coast of Scotland, (Figure 11). Most recent surveys have estimated that there are 10,540 breeding pairs in the UK, all of which migrate out of Scottish waters during the non-breeding season, predominantly to West Africa.[48] Sandwich tern in UK waters make up 14-16% of their Western Europe and West Africa biogeographic population. Ten percent of the UK breeding population reside in Scotland. Their conservation status in UK waters is unfavourable.
Marine mammals (cetaceans and seals)
4.2.12 Marine mammals are widely distributed around the Scottish coastline. Species distributions are a function of prey availability and habitat distribution. Eleven species of cetacean are regularly sighted around Scottish seas. These comprise species with important resident populations, such as bottlenose dolphin, alongside more migratory species passing through Scottish seas, such as sperm whale. Key marine mammal species in Scottish seas include:
- Grey seal Halichoerus grypus;
- Harbour seal Phoca vitulina;
- Harbour porpoise Phocoena phocoena;
- Bottlenose dolphin Tursiops truncatus;
- White beaked dolphin Lagenorhynchus albirostris;
- Fin whale Balaenoptera physalus;
- Minke whale Balaenoptera acutorostrata;
- Short-beaked common dolphin Delphinus delphis;
- Atlantic white-sided dolphin Lagenorhynchus acutus;
- Risso's dolphin Grampus griseus;
- Long-finned pilot whale Globicephala melas;
- Killer whale Orcinus orca;
- Sperm whale Physeter macrocephalus; and
- Eurasian otter Lutra lutra.
4.2.13 Of these, several species include sandeel as a major component of their diet and so are a focus of the baseline and SEA:
- Grey seal;
- Harbour seal;
- Harbour porpoise;
- White beaked dolphin; and
- Minke whale
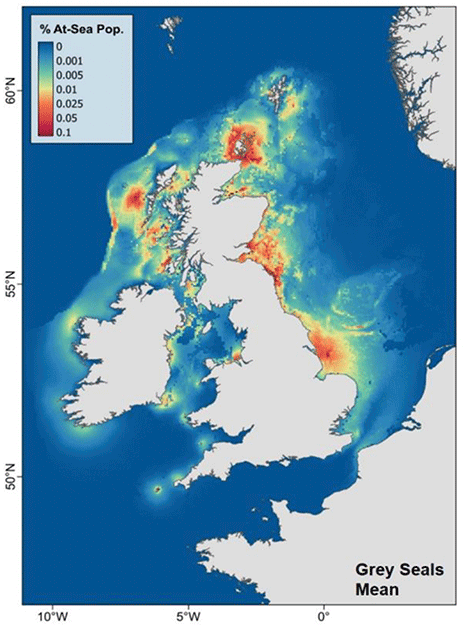
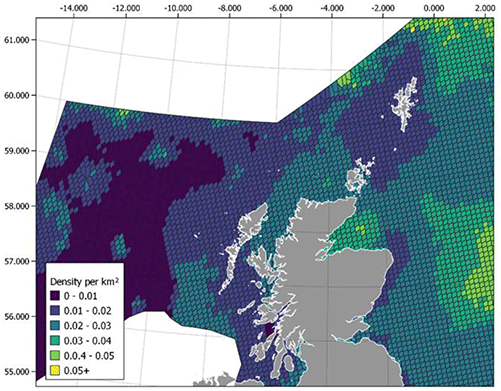
4.2.14 Grey seals occur around the entire Scottish coastline and are known to undertake long foraging trips to areas further offshore (Figure 13). In Scottish waters, grey seal at sea distribution is predominantly driven by the proximity to suitable haulout sites, with density scaling inversely with increasing distance from haulouts.[49][50] However, grey seals often undertake foraging trips of hundreds of kilometres.[51] Further to haulout affinity, grey seal distribution has been statistically correlated with several other environmental covariates, however these vary regionally both in importance and in direction. For example, grey seal density in all regions apart from the Western Isles has been shown to be driven, to varying degrees, by sediment type, with most regions showing higher affinities for coarser sand and rocky sediments than finer sands and silt-based substrates. This also mimics reported habitat preferences of sandeel in these regions.[52] Contrastingly around the Western Isles, grey seals appear to be driven by a-biotic oceanographic processes such as sea-surface temperature, stratification and proximity to the shelf edge (Carter et al 2020). Additionally, the at-sea distribution of grey seals suggests particularly high use of offshore sandbanks in some areas.[53][54]
4.2.15 The foraging ranges of grey seals vary greatly depending on the time of year. Individuals may remain close to haulouts during the breeding season (October-December), and as they are capital breeders (animals that use energy stores built up before reproduction to breed), the females do not forage during the lactation period.
4.2.16 Areas of high at-sea usage predicted by Carter et al. (2020)[53] for grey seals include Orkney, areas of the east coast (particularly those around the Firth of Forth and Firth of Tay), and those along the shelf edge to the west of the Western Isles. The outer sandbanks in the Firth of Tay and the Moray Firth also appear to be favoured foraging grounds. Based on the probability of sandeel occurrence predicted by Langton et al. (2021),[55] there will be significant spatial overlap in the waters around Orkney, the east coast, the Inner Moray Firth and the Inner Hebrides (particularly the waters north west of Islay).
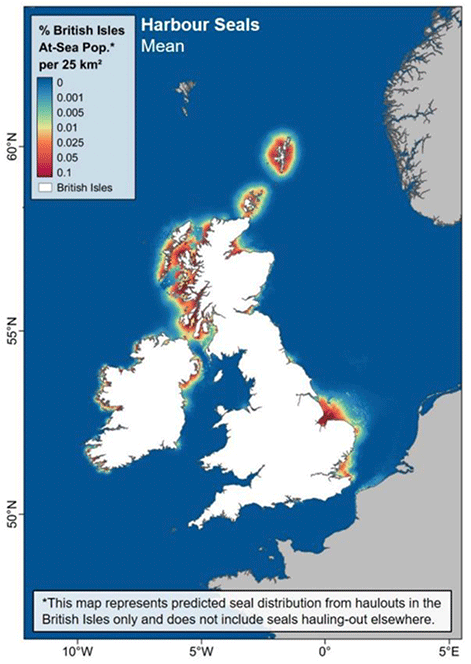
4.2.17 Harbour seals usually remain closer to the coastline than grey seals,[56] typically undertaking foraging trips of up to 50km from their haulout sites[57][58] (Figure 14). However, foraging range can vary regionally and individuals from some populations are known to make longer trips offshore.[59][60] Harbour seals are occasional income breeders (i.e., females will sometimes continue to forage during lactation), undertaking sporadic foraging trips throughout the lactation period. This means that throughout their breeding season (June-July) harbour seals will still be predating sandeel.
4.2.18 The areas of overlap between sandeel and harbour seal populations in Scottish waters are primarily off the west coast. Harbour seal populations on the east and north coasts of Scotland have experienced severe declines in the last few decades. The highest predicted at-sea densities (and therefore, number of foraging individuals) of harbour seals occur throughout the Inner Hebrides, Orkney, Shetland and the Inner Moray Firth.[61] The areas of high probability of sandeel occurrence that are therefore most relevant to harbour seal are the waters of the Sea of the Hebrides, the Western Isles and Orkney.[62]
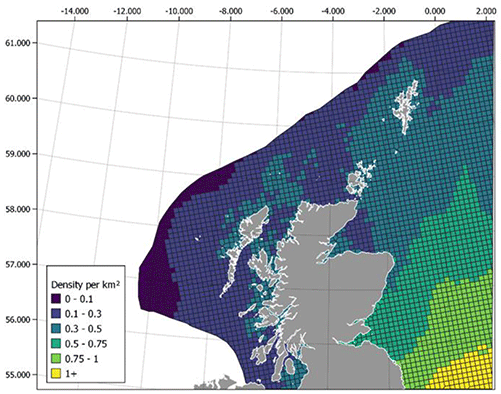
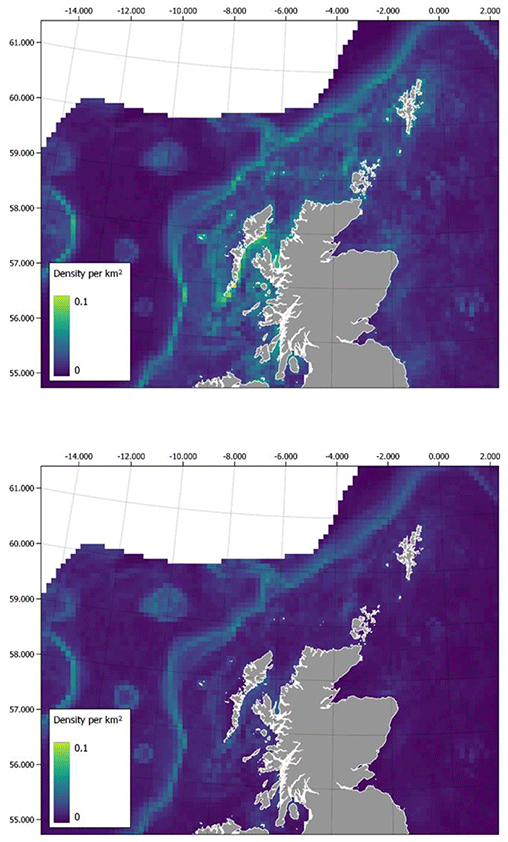
4.2.19 Harbour porpoises are resident and abundant year-round in all regions of Scottish waters[63] (Figure 15). Predictive habitat modelling based on data collected on the west coast shows a distinctly inshore distribution, with a preference for areas within 15km of the shore and depths between 50-150m.[64][65] Harbour porpoise distribution is also thought to vary with season in some areas across the UK, with animals predicted to move into the innermost North Sea during winter months from offshore areas[66] (Figures 16 and 17).
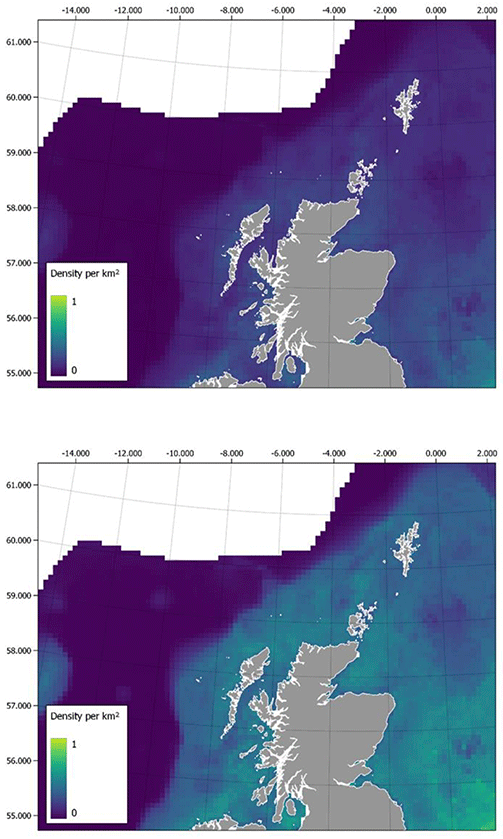
4.2.20 The highest observed densities of harbour porpoise in Scotland are generally in the North Sea,[67] where porpoises seem to prefer similar depth ranges as on the west, as well as sandy habitats that are typically favoured by sandeels, such as the gravelly sand seabed area of Smith Bank in the middle of the Moray Firth.[68][69] It should be noted that the Inner Hebrides and Minches SAC on the west coast is designated for harbour porpoise, which coincides with areas identified as high probability of sandeel occurrence.[70] In terms of spatial overlap, the areas of high probability of sandeel occurrence that coincide with areas of high area usage by porpoise are the east coast, particularly the offshore regions adjacent to the Firths of Forth and Tay such as Scalp Bank, the waters to the north east of Islay. However, sandeel spatial overlap with porpoises should be expected in any areas of shallow, coastal water and for most areas of the North Sea wherever sandeel are present. Additionally, for most coastal areas in Scotland, harbour porpoise abundance may increase during the summer months which is coincident with the seasonal increase in sandeel in the water column suggesting a possible link with seasonal movement of porpoises and availability of sandeel.
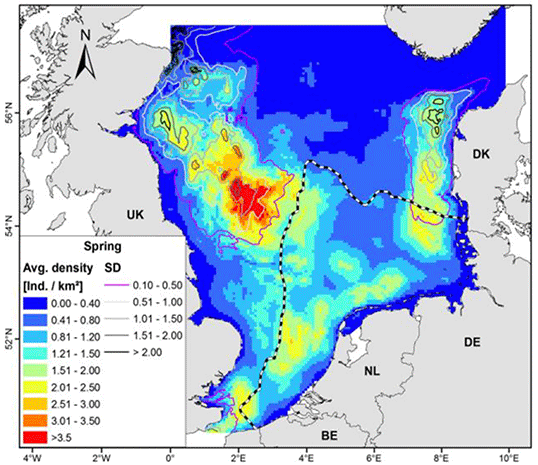
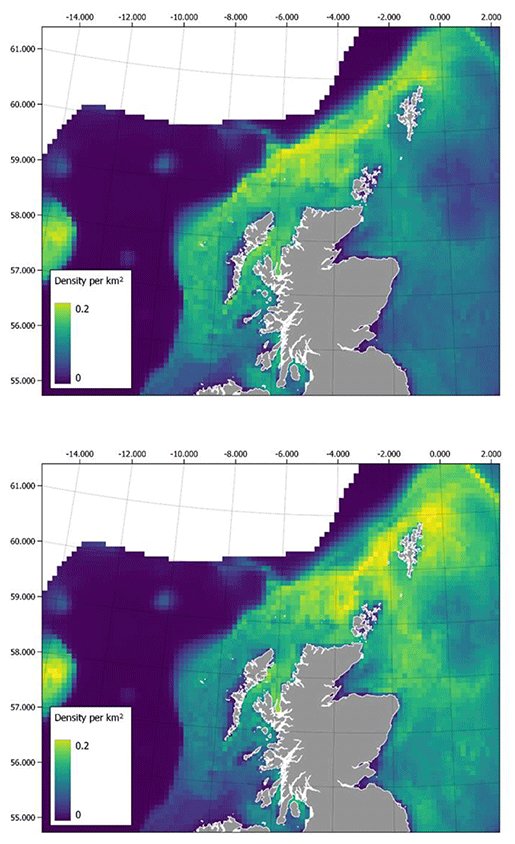
4.2.21 Minke whale distribution in Scottish waters is not well understood. Different studies, using different survey methods, suggest different high usage areas. In some areas there appears to be year-round occurrence, whereas for most areas minke whales are present only in the summer months[71] (Figures 18 and 19).[72] Minke whale occurrence is associated with sea surface temperatures and chlorophyll concentrations (Figure 20). As such, temporal and spatial variations in minke whale distribution are to be expected both within and between years.
4.2.22 In summer, high use minke whale areas appear to be the Moray Firth, the waters north of Shetland and the entire west coast of Scotland. This is spatially coincident with identified sandeel hotspots in Scottish waters[73] and may reflect movement of minke whales targeting sandeel as they become more abundant in the water column during the summer months. This relationship would be particularly important for filter and lunge feeders such as minke whales given their foraging behaviour predominantly and generally targets small actively swimming (nektonic) species. As density of a pelagic prey species increases it would follow that density of filter and lunge feeding species would also increase. The Minches, the Sea of the Hebrides and off the west coast of the Western Isles are also known to experience seasonally varying hotspots of minke whales (Figure 18). While the identified hotspots are not coincident with relatively high sandeel abundances on the west coast[73] this may indicate variation in diet between spatially discrete populations of Minke whales; a pattern seen in other, more studied marine mammals, as described above.

4.2.23 White-beaked dolphins are present in Scottish waters year-round, with a wide distribution that favours both offshore and nearshore areas depending on the region (Figure 21[74] and sections of coast adjacent to deeper water.[75] The abundance of this species in nearshore waters appears to vary seasonally,[75] with numbers increasing in the summer months as more individuals move into the area from offshore.[76]
4.2.24 White-beaked dolphins appear to be present in reasonably high numbers in all regions of Scotland except the south west and south east of Scotland[77] (Figure 21 and 22). Distribution of white-beaked dolphin appears to change seasonally, with an apparent shift eastwards between winter and summer months, with densities in the North Sea peaking in June and July (Figure 22) The main areas of white-beaked dolphin overlap with high probability of sandeel occurrence is the offshore waters of the east coast, concurrent with increased sandeel availability in the water column during summer months where seasonal white-beaked dolphin density is also highest.
Trends and pressures
Seabirds
4.2.25 At their most recent assessment the Scottish breeding abundances of black-legged kittiwake, Atlantic puffin, European shag, common guillemot and tern species were in decline. The Scottish breeding abundances of Northern gannet and razorbill were increasing. The Scottish breeding abundance of black guillemot was stable. The 2021/2022 outbreak of Highly Pathogenic Avian Influenza (HPAI) affected wild bird populations, including seabird populations.[78] It is important to note that seabird populations have not been reassessed since the 2021/22 HPAI outbreak and may have changed in light of the impact of the outbreak.
4.2.26 The threats to seabirds in Scotland, the pressures that drive that pressure, and the human activities that result in that pressure are provided in Table 5. As well as these direct anthropogenically influenced pressures, seabirds are threatened by indirect pressures resulting from climate change, including changes to habitat availability, prey availability and physiological stress.[79] Seabirds are also threatened by disease outbreaks including HPAI.[80]
Table 5: Impacts and threats to seabirds from widespread pressures.
*Pressures and activities are taken from the Marine Pressures-Activities Database (PAD) v1.3.[81]
Impact/Threat: Bycatch mortality
Pressure*: Removal of non-target species
Activity*:
- Demersal trawling, Pelagic trawls and purse, Hooks and lines, Static nets, Aquaculture
Impact/Threat: Wind turbine collision
Pressure*: Death or injury by collision – above water
Activity*:
- Energy generation – Offshore wind: Operation and maintenance
Impact/Threat: Displacement by wind turbines
Pressure*: Physical loss
Activity*:
Impact/Threat: Wind turbines as a barrier to species movement
Pressure*: Barrier to species movement
Activity*:
Impact/Threat: Mortality by collision with underwater turbines etc.
Pressure*: Death or injury by collision – below water
Activity*:
- Energy generation – Tidal stream: Operation and maintenance
- Wave energy generation
Impact/Threat: Habitat loss from coastal infrastructure
Pressure*: Physical loss (to land or freshwater habitat) / Reduction in prey
Activity*:
- Coastal Infrastructure – Reclaim and land take (e.g. the footprint of coastal defences)
Impact/Threat: Marine litter
Pressure*: Marine litter
Activity*:
- Multiple and non-specific
Impact/Threat: Habitat loss & mortality from invasive predatory mammals
Pressure*: Introduction or spread of non-indigenous species & translocations (competition)
Activity*:
- Multiple and non-specific
Impact/Threat: Reduction in prey by fishing
Pressure*: Reduction in prey
Activity*:
- Set (fixed) net fishing, Pelagic fishing (or fishing activities that do not interact with sea-bed)
- Demersal/benthic fishing
Impact/Threat: Disturbance from recreation, tourism and transport
Pressure*: Visual Disturbance[82]
Activity*:
- Recreation and leisure:
- Powerboating or sailing with an engine
- Non-motorised land craft (e.g. sand yacht, kite buggy)
- Non-motorised water craft (e.g. kayaks, windsurfing, dinghies)
- Unmanned Aerial Vehicle (UAV e.g. drones)
- Dog walking
- Wildlife tour operators
- Transport: Vessel movements
Impact/Threat: Intentional taking of adults/eggs
Pressure*: Removal of target species (lethal)
Activity*:
- Egg harvesting – human consumption
- Non-specific – control
Impact/Threat: Mortality or sub-lethal impacts of synthetic compounds (e.g. pesticides, antifoulants)
Pressure*: Synthetic compound contamination (including pesticides, antifoulants, pharmaceuticals)
Activity*:
- Multiple and non-specific
Impact/Threat: Mortality from oil contamination
Pressure*: Hydrocarbon and PAH contamination
Activity*:
- Energy generation – Oil spills including oil spill response
Impact/Threat: Mortality or sub-lethal impacts of non-synthetic compounds (e.g. heavy metals)
Pressure*: Non-synthetic compound contamination (inc. heavy metals, produced water)
Activity*:
- Multiple and non-specific
Grey and harbour seals
4.2.27 Grey seal populations trends vary by region. Overall, UK pup production increased by <1.5% per annum between 2016 and 2019. Growth was mainly limited to the North Sea colonies along the east coast of Scotland and England. Pup production in the Inner and Outer Hebrides and Orkney on the other hand showed a slight decline from 2016.[83]
4.2.28 Harbour seal populations are showing regional trends with populations declining in some regions and increasing in others. Populations in the West Scotland and Southwest Scotland Seal Management Units (SMUs) have increased continuously since the 1990s. The Western Isles population declined in the late 1990s but has been increasing since approximately 2005. Shetland and the Moray Firth SMUs are apparently stable after a large, rapid decline in the early 2000s, but Moray Firth counts may now be increasing. North Coast and Orkney SMU is declining, and in the East Coast SMU the population in the Tay and Eden Special Area of Conservation (SAC) has declined rapidly since 2002 and is apparently continuing. Less frequent counts in the Firth of Forth indicate that the whole South East Scotland SMU population may be declining.[84]
4.2.29 The causal mechanisms of harbour seal declines have not been identified, but several factors have been rejected as primary causes of the decline, although these may remain as potential secondary factors. Critical factors have been identified for further research including reduction in prey availability, competition with grey seals for prey resources, predation by grey seals and by killer whales, and exposure to toxins from harmful algal blooms.[84] Declining sandeel stocks have been linked to declines in harbour seal populations.[85]
Cetaceans
4.2.30 The long-term population trends of key cetacean species are summarised in Table 6 and are either classed as 'unknown' or 'uncertain'. Although there are two robust estimates of abundance for harbour porpoise, minke whale, and white-beaked dolphin covering the UK EEZ over a period of 11 years, two data points do not enable confidence in population trends therefore the UK population trend is unknown. Estimates of abundance of harbour porpoise and minke whale in the North Sea suggest that their numbers are stable.[86]
4.2.31 Pressures that can affect cetaceans as identified in the UK dolphin and porpoise conservation strategy technical report[87] are summarised in table 7. The most recent estimate of abundance of cetaceans in each of their management units is also shown.[88]
| Species | Population Trend | Management Unit | Abundance of animals in the UK portion of Management Unit | 95% Confidence interval for UK portion of Management Unit | Source |
|---|---|---|---|---|---|
| Harbour porpoise | Uncertain | North Sea | 159,632 | 127,442 – 199,954 | Hammond et al. 2021;[89] Rogan et al. 2018[90] |
| West Scotland | 24,305 | 17,121 – 34,505 | Hammond et al. 2021;[89] Rogan et al. 2018[90] | ||
| Celtic and Irish Seas | 16,777 | 11,216 – 25,096 | Hammond et al. 2021;[89] Rogan et al. 2018[90] | ||
| Minke whale | Unknown | Celtic and Greater North Seas | 10,288 | 6,210 – 17,042 | Hammond et al. 2021;[89] Rogan et al. 2018[90] |
| White-beaked dolphin | Unknown in the North Sea | Celtic and Greater North Seas | 34,025 | 20,026 – 57,807 | Hammond et al. 2021;[89] Rogan et al. 2018[90] |
Table 7: Pressures that can affect cetacean populations.
Description
Bycatch/entanglement
- Entanglement in fishing gear, including pots and creels; drift nets; trawling and purse seine; and set (fixed) nets.
Acoustic disturbance
- Including cumulative impacts of acoustic disturbance; seismic/geophysical surveys; underwater explosions; pile driving; operational offshore windfarms; operational oil and gas platforms; acoustic deterrent devices; fish finders and depth sounders; pingers; mining and dredging activities; vessel noise; military activity and sonar.
Physical disturbance
- Including scientific studies (e.g. tagging, photo ID, biopsy); recreation and wildlife tourism.
Change to habitat
- Including barriers to movement; change/removal of supporting habitat; reduction in availability of prey; localised temperature change
Physical injuries/mortalities
- Including vessel strikes; collision with renewable energy devices; high energy acoustic events (e.g. removal of unexploded ordnance)
Marine pollution
- Including oil pollution; chemical pollution (e.g. PCBs, Butyl tins, PAHs, Radionuclides, heavy metals); plastic pollution (ingestion); entanglements in marine litter and ghost nets; eutrophication, sewage pathogens
4.3 Water quality, resources, and ecological status
Sandeel
4.3.1 Sandeel are distributed broadly in Scottish waters where they are highly reliant upon the availability of suitable sandy substrates.[91][92][93][94] A study by the Scottish Government's Marine Directorate on sandeel distribution in sediment grab samples collected in the Firth of Forth found that sandeel preferred medium to coarse sand, presumably as this offers greater permeability and thus higher oxygen concentrations, and avoided fine sediment,[95] confirming previous results of an experimental test of sediment preference conducted by the Marine Directorate.[96] Sandeel were also found to prefer water depths of around 50 m.[96]
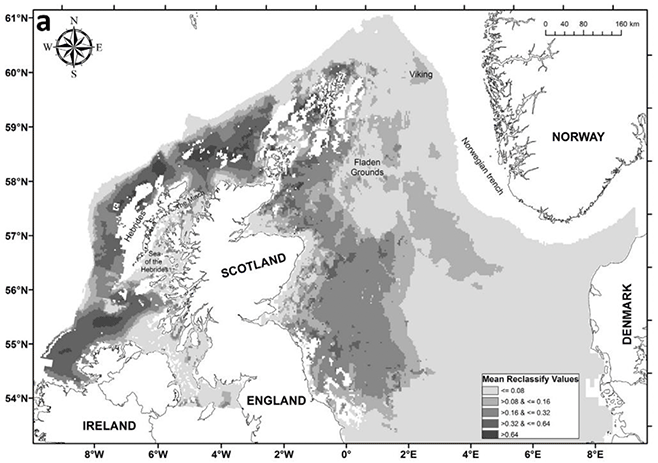
4.3.2 These sediment preferences, along with other environmental variables, have been used by the Marine Directorate to map sandeel habitat suitability and predict sandeel distributions around Scotland, eastern English waters and the Celtic Seas.[97] The resultant Species Distribution Models (SDM) highlighted an avoidance of fine sediment, a preference of depths around 40 m and a high patchiness of suitable habitat.[94] The key output of the model was a prediction of sandeel distribution within and beyond the limits of Scottish waters (Figure 23). The model predicts the highest probability of sandeel occurrence on Dogger Bank (North Sea, sandeel management area 1, eastern English waters) and also identifies sandeel grounds in the Firth of Forth (consistent with historic sandeel fishing grounds),[98] the Moray Firth, the east coast of Orkney, east of Dublin, north east coast of Donegal, north and west of Islay, and to the north and west of Lewis. Model predictions were validated against the east coast sandeel dredge survey and both the North Sea and West of Scotland International Bottom Trawl Surveys.[99]
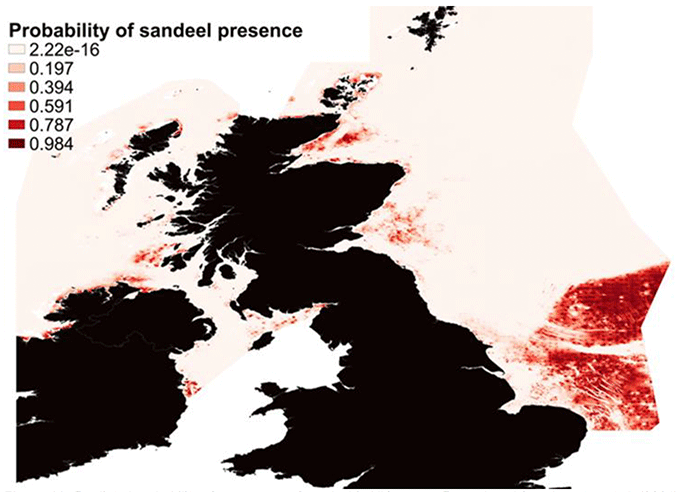
4.3.3 The lack of a sandeel assessment on the west coast of Scotland (there are no recent data on sandeel status in this area) and the designation of several Marine Protected Areas (MPAs) in these areas protecting sandeel directly or indirectly (e.g., sandeel reliant predators), resulted in the Marine Directorate conducting a sandeel survey to the west coast of Scotland in 2019. The observed occurrence of sandeel in grab and dredge samples at various sites on the west coast of Scotland was in good agreement with the Langton et al. (2021) predictions.[100]
4.3.4 Sandeel movement at the adult stage is limited and connectivity between sandeel grounds results from larval dispersal, mostly driven by oceanographic processes.
Predatory fish
4.3.5 There are approximately 100 species of fish that live in Scottish waters with varying characteristics that fill a variety of ecological niches.[101] Sandeel forms a significant component of the diet of the following commercially important species:
- Atlantic cod Gadus morhua;
- Haddock Melanogrammus aeglefinus;
- Whiting Merlangius merlangus; and
- Saithe Pollachius virens.
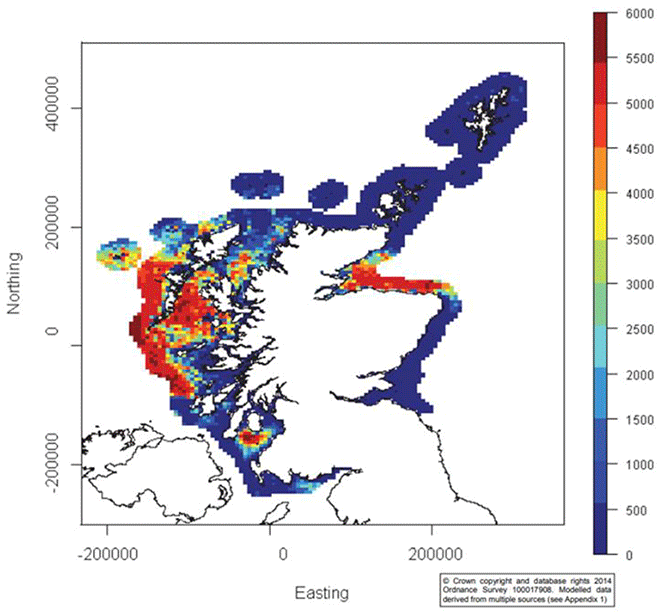
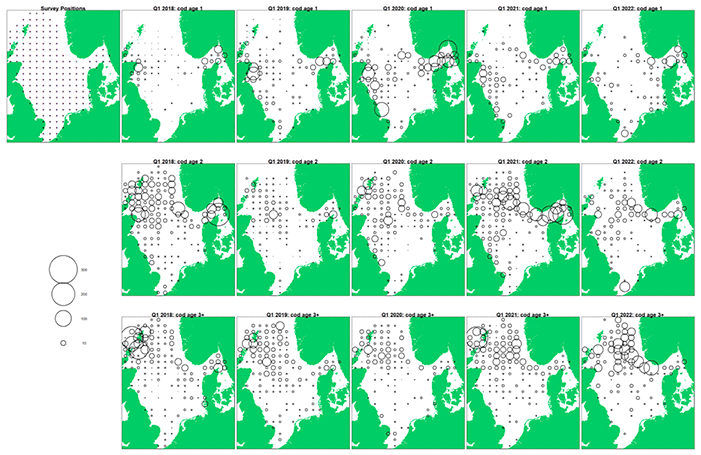
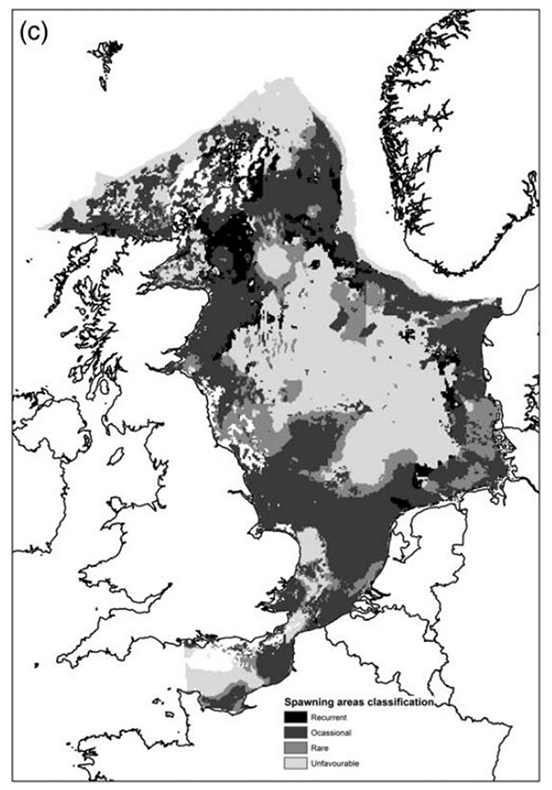
4.3.6 Atlantic cod is a species of demersal fish that is distributed broadly across North Atlantic waters.[102] In Scottish waters significant aggregations are found off the Moray Firth, the Northern Isles as well as areas off Rattray head and Buchan Deep.[103] In the North Sea, Atlantic cod abundance is estimated by the International Bottom Trawl Survey (IBTS) taking place in quarter 1 and quarter 3. The biomass of cod measured in Catch Per Unit Effort (CPUE) in quarter 1 is presented in Figure 24.[103] An estimation of the distribution of cod spawning grounds highlights the presence of a number of recurrent and occasional cod spawning grounds in Scottish waters[104] (Figure 25).
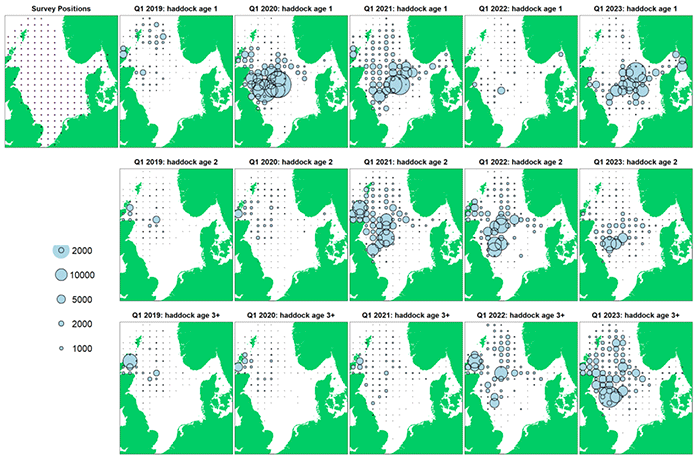
4.3.7 Haddock is a species of demersal fish that is distributed broadly across North Atlantic waters. In Scottish waters, significant aggregations are found off the Moray Firth and generally along the East coast of Scotland and to the West of the Hebrides particularly for age 3 and older[105] (Figure 26). An estimation of the distribution of haddock spawning grounds highlights the presence of a number of recurrent and occasional haddock spawning grounds in Scottish waters[105] (Figure 27).
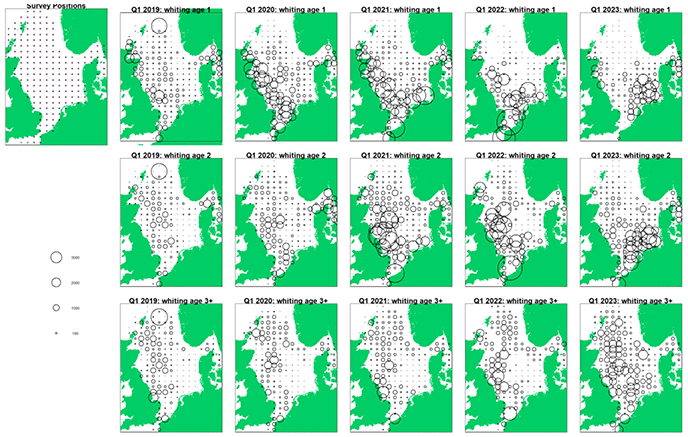
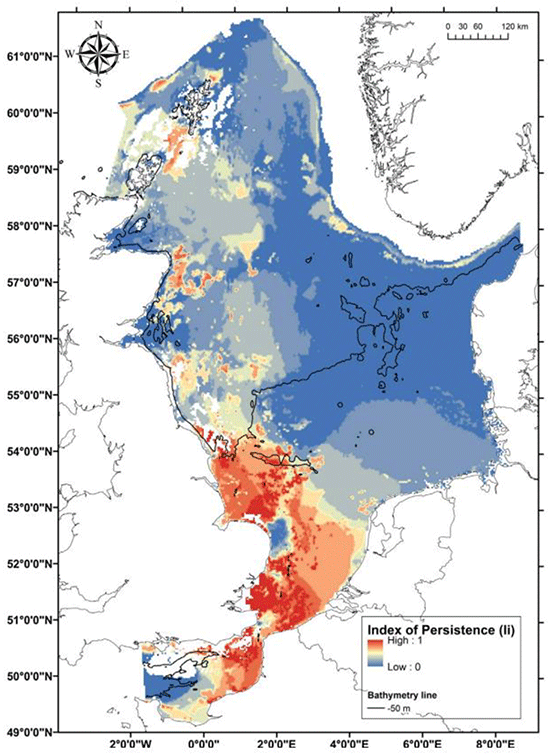
4.3.8 Whiting is a species of demersal fish that is predominantly found in the North Sea. In Scottish waters, significant aggregations are found off the Moray Firth and generally along the East coast of Scotland[106] (Figure 28). An estimation of the distribution of whiting spawning grounds highlights the presence of a number of persistent and occasional whiting spawning grounds in Scottish waters, particularly around the Northern Isles and off the East coast of Scotland[107] (Figure 29).
4.3.9 Saithe is a species of demersal fish that is distributed broadly across North Atlantic waters. Juveniles are found in inshore nursery grounds along the coast of Norway, Scotland and Shetland Islands, while adults are highly migratory.[108]
Trends and pressures
Sandeel
4.3.10 Recruitment in 2014, 2016, 2017, 2019, 2021 and 2022 was above the geometric mean for the period 2012-2021, while the remaining years after 2010 were below (Figure 31). Fishing mortality (F) has been low since 2005, apart from 2018 and 2021 (Figure 31). The low level of F, together with high recruitment in 2014 and 2019, has resulted in Spawning Stock Biomass (SSB) above the precautionary spawning biomass level (Bpa) between 2016 and 2019 and in 2021. Spawning Stock Biomass (SSB) was between the Limit reference point for spawning stock biomass (Blim) and the precautionary spawning biomass level (Bpa) in 2020 and 2022[109] (see Figure 2).
4.3.11 Causes of variation in sandeel abundance are numerous and are driven by fishing mortality and (principally) natural mortality, the latter being influenced by factors such as environmental change (temperature effects, regime shifts) and top-down processes (trophic regulation by marine predators). Aside from fishing pressure, a major pressure facing sandeel is climate change which has direct effects on sandeel physiology as well as indirect effects on the availability of their prey.
4.3.12 Climate change and changes in sea temperature, particularly, have the potential to affect sandeel abundance and their availability to marine predators through a variety of mechanisms. Two key characteristics of sandeel biology make them particularly sensitive to a temperature increase during winter: (i) the long overwintering period during which sandeel remain inactive and buried in the sand and (ii) the requirement to build up energy reserves at times when food is abundant due to investment in reproduction at a time of low prey availability (sandeel are capital breeders). As sandeel rest (do not feed) throughout winter, the increased metabolic rate and maintenance costs associated with climate change may result in an increase in overwinter mortality (i.e. if the maintenance costs cannot be met by the finite energy stores acquired during the growing season) and a delay in maturation.[110] (i.e. energetic commitment to maturation is constrained by increasing maintenance costs). These temperature related delays in ovarian development and spawning dates,[111][112] and changes to egg development[113] may in turn result in a mismatch between sandeel hatching and the availability of their copepod prey.[114]
4.3.13 Climate change is also predicted to affect the marine environment through an increase in ocean acidification resulting from increased CO2 levels as well as a decrease in dissolved oxygen.[115] While no empirical evidence of the effects of ocean acidification on sandeel is available, effects have been documented in other fish, with potential impacts on metabolic rate[116] and respiratory performance[117] which may ultimately impact survival and abundance. Ocean acidification may also impact sandeel through bottom-up processes as effects have been documented on both phytoplankton and zooplankton communities.[118][119] Oxygen levels are predicted to decrease further with climate change[120] and may impose further restrictions on fish distributions. Sandeel spend a considerable proportion of their life cycle buried in the sediment, in anoxic or near anoxic conditions. Experimental work revealed that decreasing oxygen affected the depth at which sandeel buried in the substrate and that they emerged at very low dissolved oxygen levels.[121] A decrease in oxygen levels may therefore indirectly impact sandeel survival and abundance through an increase in sandeel exposure to predators, in addition to potential direct effects on fish physiology. While most studies of the impacts of climate change on sandeel have focussed on temperature, other effects such as ocean acidification and low dissolved oxygen levels are likely to play an important role and their cumulative effects may result significant impacts on sandeel abundance and availability to marine predators.
Predatory fish
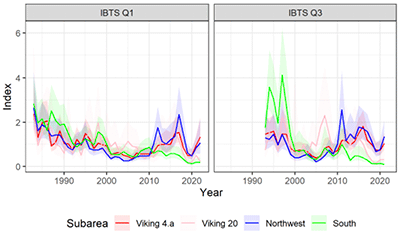
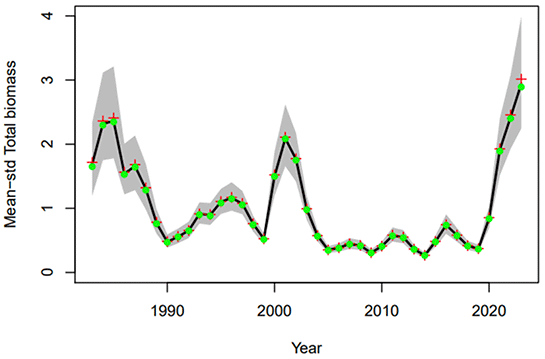
4.3.14 Atlantic cod biomass exhibited a decline between 1980 and 2005 followed by a slight increase in biomass since 2005[122] (Figure 30). Biomass of haddock in Scottish waters showed an initial decrease in the mid-80's followed by relatively low biomass levels except for a peak between 2000 and 2003. Biomass has shown recent increases since 2020 (Figure 31). Biomass of whiting has been relatively stable since the mid-80's[123] (Figure 32).
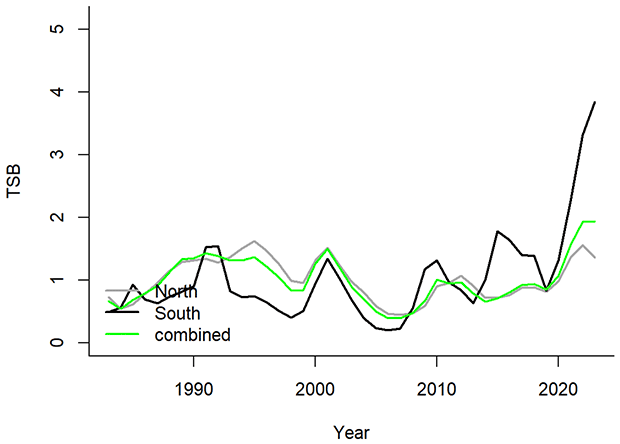
4.3.15 The main pressures facing predatory fish include environmental change and fishing pressure. Cod, haddock and saithe are considered boreal species (cold-favouring) and are likely to be negatively impacted by warming waters.[124][125] Atlantic cod populations are more abundant in the northern portion of the North Sea compared to the southern portion where temperatures are warmer (Figure 32). A combination of fishing pressure and climate change has affected growth and resulted in a decrease in the length and age at maturation for gadid stocks.[125][126][127] This in turn affects their recruitment, as well as the timing of spawning.[128][129][130] Whiting on the other hand are considered a Lusitanian (warm-favouring) species and so may be less affected by climate change.[131] Stock dynamics of whiting are driven by recruitment and a high level of natural mortality.[132] Haddock abundance is driven by a high level of recruitment variability meaning that environmental conditions, including climate, are a key driver of population changes in this species.[133][134] Fishing mortality of cod, whiting and haddock has been declining in recent years due to restricted fishing effort in the whitefish fishery caused by the low cod TAC in this fishery.[132]
Contact
Email: sandeelconsultation@gov.scot