Rural Scotland Business Panel Survey February 2023
This report presents findings from the fourth Rural Scotland Business Panel Survey carried out in October and November 2022.
5. Cost crisis
Key findings
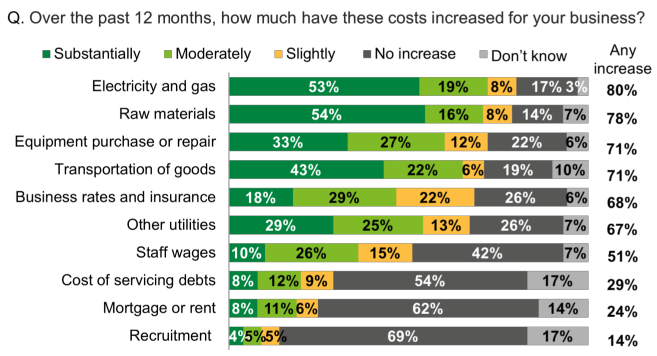
Almost all businesses (99%) had experienced cost increases in the past 12 months, with 82% experiencing substantial cost increases.
The biggest areas of cost increase were: electricity and gas (80% saw an increase, 53% a substantial increase), raw materials (78% and 54%), transportation of goods (71% and 43%), and equipment purchase or repair (71% and 33%). This was followed by business rates or insurance (68% increased and 18% substantial) and other utilities (67% and 29%).
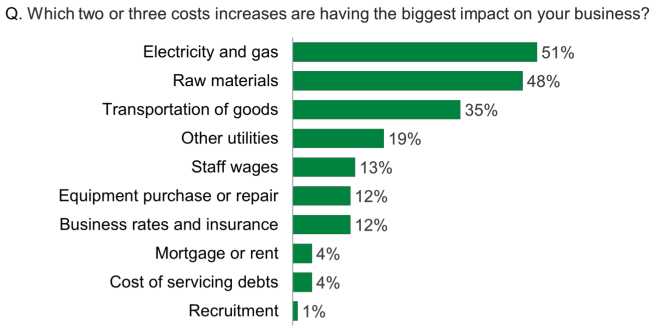
The costs having the biggest impact were those that had increased the most: electricity and gas (51%), raw materials (48%) and transportation of goods (35%).
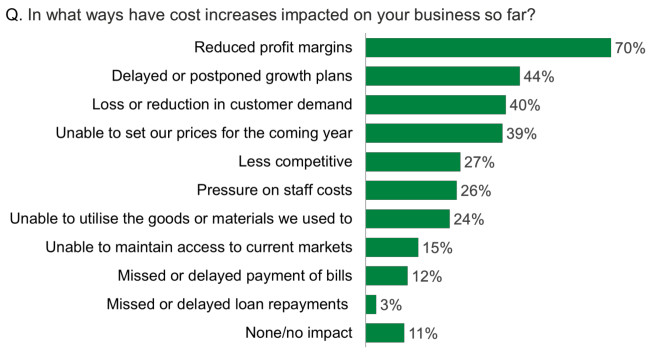
The main impact of cost increases was reduced profit margins (70%). This was followed by delayed or postponed growth plans (44%), loss or reduction in customer demand (40%) and being unable to set prices for the coming year (39%).
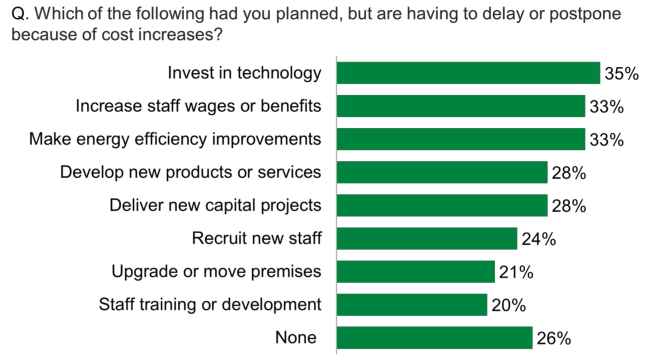
Three quarters (74%) of businesses had delayed or postponed plans because of cost increases. A range of plans were impacted including: investing in technology (35%), increasing staff wages or benefits (33%), energy efficiency improvements (33%), new products or services (28%) and new capital projects (28%).
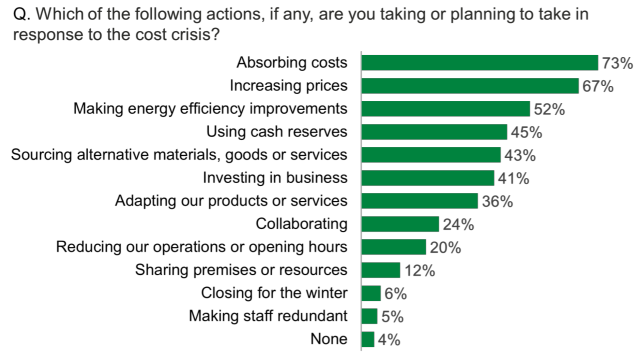
In response to the cost crisis, around three quarters (73%) of businesses were absorbing costs and two thirds were increasing prices (67%). Just over half were making energy efficiency improvements (52%). Other common actions included using cash reserves (45%), sourcing alternative materials, goods and services (43%), investing in the business (41%), and adapting products or services (36%).
Cost increases
Almost all businesses (99%) had experienced cost increases in the past 12 months, with 82% experiencing substantial cost increases. The biggest areas of cost increase were: electricity and gas (80% saw an increase, 53% a substantial increase), raw materials (78% and 54%), transportation of goods (71% and 43%), and equipment purchase or repair (71% and 33%). This was followed by business rates or insurance (68% increased and 18% substantial) and other utilities (67% and 29%) (Figure 5.1).
Variation in cost increases
Businesses in the Highlands and Islands were more likely than average to have experienced substantial increases in the cost of: electricity and gas (55%), other utilities (32%), transportation of goods (45%) and equipment purchase or repair (36%). Businesses in the South of Scotland were more likely to have experienced substantial increases in the cost of raw materials (60%).
Tourism and food and drink businesses were more likely than average to have seen substantial increases in the following costs:
- Tourism – electricity and gas (64%), other utilities (43%), equipment purchase or repair (43%), business rates and insurance (26%), staff wages (19%) and recruitment (8%).
- Food and drink – raw materials (81%), equipment purchase or repair (54%), transportation of goods (53%), other utilities (39%) and cost of servicing debt (13%).
Other businesses that were more likely say costs had increased substantially included:
- Remote rural businesses[11] – equipment purchase or repair (37%) and other utilities (34%).
- Accessible rural businesses – raw materials (60%), transportation of goods (47%) and equipment purchase or repair.
- Importers – raw materials (58%), transportation of goods (45%) and equipment purchase or repair (35%).
Experience of cost increases was also particularly prevalent among those that had struggled in the last six months and those that felt unable to plan more than a month ahead (see Appendix A).
Cost increases with biggest impacts
The costs having the biggest impact on businesses were those that had increased the most: electricity and gas (51%), raw materials (48%) and transportation of goods (35%). This was followed by other utilities (19%), wages (13%), equipment (12%) and business rates and insurance (12%). Costs having the least impact were those related to mortgage or rent (4%), servicing debts (4%) or recruitment (1%). (Figure 5.2).
Variation in perception of biggest impacts
Certain sectors were more likely than average to say these costs increases were having a big impact:
- Tourism - electricity and gas (68%), other utilities (26%), wages (21%) and mortgage or rent (7%).
- Food and drink – raw materials (68%) and equipment purchase or repair (20%).
- Financial and business services – electricity and gas (63%).
- Creative industries – business rates and insurance (18%).
Impacts of particular costs increases were also being more keenly felt by the following:
- Remote rural businesses – raw materials (52%).
- Women-led businesses – electricity and gas (60%) and mortgage or rent (10%).
- Importers – raw materials (51%) and transportation of goods (37%).
Impacts of cost increases
The main impact of cost increases was reduced profit margins (70%). This was followed by delayed or postponed growth plans (44%), loss or reduction in customer demand (40%), being unable to set prices for the coming year (39%), being less competitive (27%), pressure on staff costs (26%) and being unable to utilise the goods or materials they used to (24%) (Figure 5.3).
Variation in experience of impacts
Once again, experience of cost increases varied by sector. Tourism, food and drink and creative industries businesses were more likely than average to have experienced the following impacts:
- Tourism – delayed or postponed growth plans (53%), loss or reduction in customer demand (50%), being unable to set prices for the coming year (49%), pressure on staff costs (37%) and being less competitive (35%).
- Food and drink – delayed or postponed growth plans (51%) and being unable to utilise the goods or materials they used to (31%).
- Creative industries – loss or reduction in customer demand (49%).
Large businesses (25+ staff) and those that were women-led were also more likely to mention these impacts:
- Large businesses (25+ staff) – pressure on staff costs (60%), delayed or postponed growth plans (54%) and being less competitive (34%).
- Women-led – reduced profit margins (76%), delayed or postponed growth plans (51%), loss or reduction in customer demand (49%) and being unable to maintain access to current markets (20%).
Businesses that had not performed well, those unable to plan far ahead and importers were more likely to be experiencing most of these impacts (see Appendix).
Businesses experiencing no impacts (11%) were more likely to be: financial and business services (20%), those that had were able to plan more than 12 months ahead (20%) and those that had performed well (17%).
Plans disrupted by cost increases
Three quarters (74%) of businesses had delayed or postponed plans because of cost increases. A range of plans were impacted including: investing in technology (35%), increasing staff wages or benefits (33%), energy efficiency improvements (33%), new products or services (28%), new capital projects (28%), recruiting new staff (24%) upgrading or moving premises (21%) and staff training and development (20%) (Figure 5.4).
Variation in experience of disruption to plans
Echoing the earlier findings in relation to cost increases, disruption to plans were more prevalent in the tourism, food and drink and creative industries. They were more likely than average to have experienced disruption to the following plans:
- Tourism – energy efficiency improvements (49%), development of new products or services (42%), new capital projects (37%) and upgrading or moving premises (28%).
- Food and drink – new capital projects (47%) and energy efficiency improvements (38%).
- Creative industries – investment in technology (45%) and development of new products or services (38%).
The following businesses were also more likely to have experienced disruption to their plans:
- Businesses in the Highlands and Islands – energy efficiency improvements (36%) and new capital projects (35%).
- Large businesses (25+ staff) – increase in staff wages or benefits (42%), new capital projects (40%) and recruitment of staff (32%).
- Women-led – new products or services (37%), recruitment of staff (30%) and staff training and development (25%).
Businesses that had not performed well, those unable to plan far ahead and importers were more likely to have delayed or postponed most of these (see Appendix).
Businesses experiencing no disruptions to plans (26%) were more likely to be: financial and business services (38%), those that had performed well (37%) and those able to plan more than 12 months ahead (36%).
Actions in response to the cost crisis
In response to the cost crisis, around three quarters (73%) of businesses were absorbing costs and two thirds were increasing prices (67%). Just over half were making energy efficiency improvements (52%). Other common actions included using cash reserves (45%), sourcing alternative materials, goods and services (43%), investing in the business (41%), and adapting products or services (36%) (Figure 5.5).
Variation in actions taken in response to the cost crisis
Response to the cost crisis differed depending on business performance, and ability to plan ahead.
Those that had performed well were more likely than average to have increased their prices (73%) and invested in the business (45%). Those that had struggled, on the other hand, were more likely to have used their cash reserves (65%) and taken actions that suggest scaling back, including reducing operations or opening hours (33%), sharing premises or resources (15%), making staff redundant (11%) and closing for the winter (9%). They were also more likely to be adapting their products or services (43%) and collaborating (29%).
There was a similar pattern in relation to businesses’ ability to make plans, with those unable to plan no more than monthly more likely to be absorbing costs (76%), using cash reserves (51%), reducing operations or opening hours (28%) and making staff redundant (8%). Those that were able to plan beyond the next 12 months were more likely to be investing (48%).
Certain sectors also had different responses, with tourism businesses in particular being more likely to take a wide range of actions:
- Tourism – increasing prices (84%), absorbing costs (79%), making energy efficiency improvements (62%), sourcing alternative materials, goods or services (51%), adapting products or services (46%), reducing operations or opening hours (43%), collaborating (31%) and closing for winter (22%).
- Food and drink – absorbing costs (78%), making energy efficiency improvements (61%), investing (49%), collaborating (28%) and sharing premises (18%).
- Creative industries – using cash reserves (54%).
Again, there were notable differences among larger businesses and those that were women-led:
- Large businesses (25+ staff) – increasing prices (85%), making energy efficiency improvements (69%), investing (62%), sourcing alternative goods materials or services (61%) and adapting products or services (47%).
- Women-led – using cash reserves (53%), adapting products or services (47%), reducing operations or opening hours (32%) and making staff redundant (9%).
Importing businesses were more likely to be taking most of these actions (see Appendix).
Contact
Email: socialresearch@gov.scot