Scottish Welfare Fund review: final report - data analysis appendix
An appendix to the main report of the review of the Scottish Welfare Fund, containing technical detail of the secondary analysis.
6. Assessment and review
Key points
- Providing a definitive view on the consistency of SWF decisions across Scotland is extremely difficult, since differences between areas do not, on their own, mean that guidance is being applied inconsistently.
- There is some evidence that, at a Scotland-wide level, decision-making practice appears to have improved since the inception of the scheme, with fewer applications recorded as rejected for being 'incomplete', and fewer Crisis Grant decisions being changed at Tier 2 review.
- However, there was some evidence of differences between areas in assessment and/or recording practices which seem unlikely to reflect different priority levels or local needs. This includes variations in the level of applications rejected as 'incomplete'.
- Around 5% of Community Care Grant applications and 2% of Crisis Grant applications have resulted in requests for Tier 1 review. While the proportion of decisions resulting in Tier 1 review varies between local authorities, there is no consistent pattern to this, and the reasons recorded for review make interpreting these differences difficult.
- However, for Crisis Grants, local authorities that were more likely to change their decisions at Tier 1 had fewer decisions changed at Tier 2. This may indicate that where the LA has a robust, self-critical approach to Tier 1 review this results in fewer decisions being overturned by the SPSO.
How fair and consistent is SWF decision-making across Scotland?
Key questions the analysis of management data was intended to help answer include:
- What are the main reasons for applications being rejected? How do these vary by local authority and how have these changed over time?
- What patterns and trends are evident in relation to Tier 1 and Tier 2 reviews and their outcomes? And what might these patterns/trends tell us about the effectiveness of both initial decision-making and the review process?
We can compare how the SWF is administered across LAs based on a number of relevant variables (e.g. reasons for rejecting applications, reviews carried out, level of awards). This will give us an insight into how statutory guidance is applied and interpreted, and where there are may be inconsistencies. However, it is important to note that variation between local authorities does not automatically indicate inconsistency but may be a sign of different local circumstances.
Reasons for rejection of applications
From the outset of the scheme, the application not meeting the conditions of the award has been the most common reason for rejection in the case of Community Care Grant applications, accounting for 53% of rejected applications in 2013/14 and increasing to account for 62% of rejected applications in 2019/20. The application being incomplete has reduced as a proportion of reasons from 21% in 2013/14 to 8% in 2019/20. 'Other' reasons have decreased from 21% to 10% of reasons. Priority rating has remained consistent at 9% of reasons in 2013/14 and 2019/20.
| Reasons CCG applications were rejected | 2013/14 | 2019/20 |
|---|---|---|
| Application incomplete/evidence not provided. | 21% | 8% |
| Not resident in the Local Authority | 0% | 1% |
| Not within 8-week period of leaving care. | 1% | 0% |
| Not in receipt of a qualifying benefit (prior to 1 April 2016) | 4% | 0% |
| Subject to a DWP Sanction or Disallowance | 0% | 0% |
| More appropriate DWP provision available | 2% | 0% |
| Excluded as a result of previous application history | 2% | 2% |
| Reasons for application do not meet the conditions for an award | 53% | 62% |
| Priority rating insufficiently high | 9% | 9% |
| Savings sufficient to meet costs/other sources of support available | 2% | 3% |
| Application is for excluded items | 1% | 3% |
| Evidence of previous fraud | 1% | 0% |
| Not on a low income (from 1 April 2016) | 0% | 2% |
| Other | 21% | 10% |
| Total (ALL) | 118%* | 100% |
Source: Scottish Welfare Fund Statistics 2020/21, Table 30 (*=multiple response in 2013/14)
| Reasons Crisis Grant applications were rejected | 2013/14 | 2019/20 |
|---|---|---|
| Application incomplete/evidence not provided. | 27% | 14% |
| Not resident in the Local Authority | 0% | 1% |
| Not in receipt of a qualifying benefit (Prior to 1 April 2016) | 7% | 0% |
| Subject to a DWP Sanction or Disallowance | 5% | 0% |
| More appropriate DWP provision available | 8% | 1% |
| Excluded as a result of previous application history | 5% | 31% |
| Reasons for application do not meet the conditions for an award | 15% | 23% |
| Priority rating insufficiently high | 19% | 12% |
| Savings sufficient to meet costs/other sources of support available | 4% | 2% |
| Application is for excluded items | 1% | 2% |
| Evidence of previous fraud | 0% | 0% |
| Not on a low income (from 1 April 2016) | 0% | 1% |
| Other | 27% | 13% |
| Total (ALL) | 120% | 100% |
Source: Scottish Welfare Fund Statistics 2020/21, Table 32
At the outset of the SWF, the application being incomplete (27%) and other reasons (27%) were the most common reasons for rejection of Crisis Grant applications. However, in 2019/20 the most common reasons were being excluded as a result of previous application history (31%) and the reason for application not meeting the conditions for an award (23%). Incomplete applications accounted for 14% of rejected applications in 2019/20 while other reasons accounted for 13%. The priority rating of the application not being sufficiently high accounted for 12% of rejected applications in 2019/20 compared with 19% in 2013/14.
The reduction in incomplete applications and the reduced use of the 'other' code indicates an improvement in practice and recording over time, with less missing or incomplete information evident in applications or how fully these are recorded. In the later period, Crisis Grants were more commonly refused due to having had too many previous applications (i.e. previous application history, which is consistent with the high level of repeat applications and awards) or ineligibility (i.e. not meeting the conditions for an award).
In terms of differences by local authority, the Community Care Grant application being incomplete was far more commonly recorded in 2019/20 in Argyll and Bute (37%), Clackmannanshire (32%), the Shetland Islands (33%) and South Ayrshire (34%) compared with 8% overall in the table above. A number of local authorities – Falkirk, Highland and Perth and Kinross – reported all rejections as due to the conditions of the award not being met. This was also 80% of reasons in Glasgow and 75% in Angus.
Incomplete applications for Crisis Grants were more commonly the reason for rejection in Argyll and Bute (in 51% of cases), Stirling (44%), Eilean Siar (43%), Shetland (41%), South Lanarkshire (40%), East Ayrshire (36%), South Ayrshire (35%) and Inverclyde (30%) compared with 14% overall.
A number of local authorities were more likely to reject Crisis Grants due to previous application history – 52% of cases in Fife, 48% in East Dunbartonshire and Midlothian, 42% in Dundee and Dumfries and Galloway compared with 23% overall.
Not meeting the condition of the Crisis Grant award was more commonly the case in Clackmannanshire (63%) North Lanarkshire (51%) East Ayrshire and Orkney (50%) and North Ayrshire (45%) compared with 23% overall. 'Other' reasons were very high in East Renfrewshire (72%) and Edinburgh (45%) but just 13% overall.
These patterns indicate some variation in reporting but it is not clear whether this is due to how eligibility is being applied or how monitoring data is being recorded.
Reviews and review decisions
Across the life of the Scottish Welfare Fund, just under 5% of Community Care Grant applications have been subject to a First Tier Review. A significantly higher than average proportion (at least one standard deviation above the mean) of Community Care Grant applications went to First Tier review in Glasgow, East Dunbartonshire, Dumfries & Galloway, Clackmannanshire and Dundee.
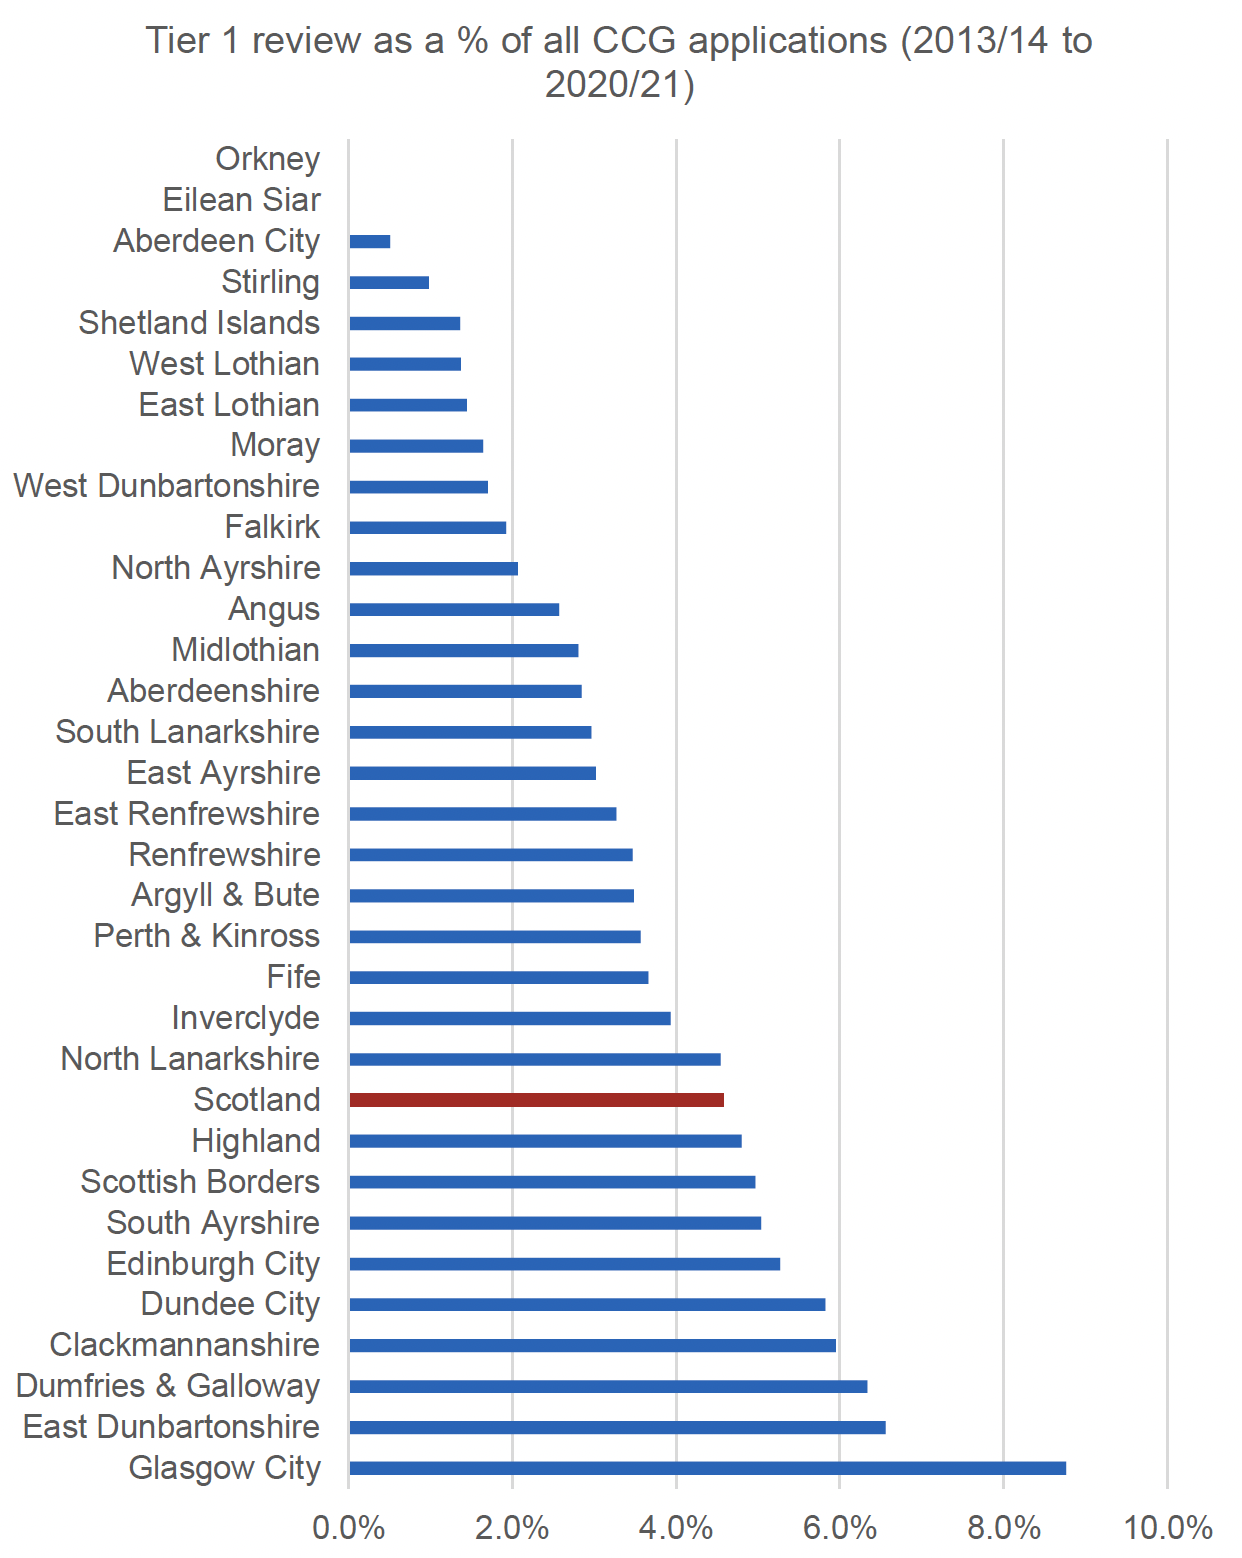
Source: Scottish Welfare Fund Statistics 2020/21, Table 56a and Table 2
Some of these areas were among those with a higher than expected level of Community Care Grant applications (Glasgow, Clackmannanshire and Dundee) while East Dunbartonshire and Dumfries and Galloway were less so. It is also notable that West Dunbartonshire and Aberdeen had higher than expected application rates recently but a lower than average proportion of applications going to Tier 1 review. The Orkney Islands and Eilean Siar had too few cases to show data for.
Across all the Tier 1 reviews in Scotland between 2013/14 and 2020/21, just under half of decisions (46%) in relation Community Care Grants were revised as a result of the review process.
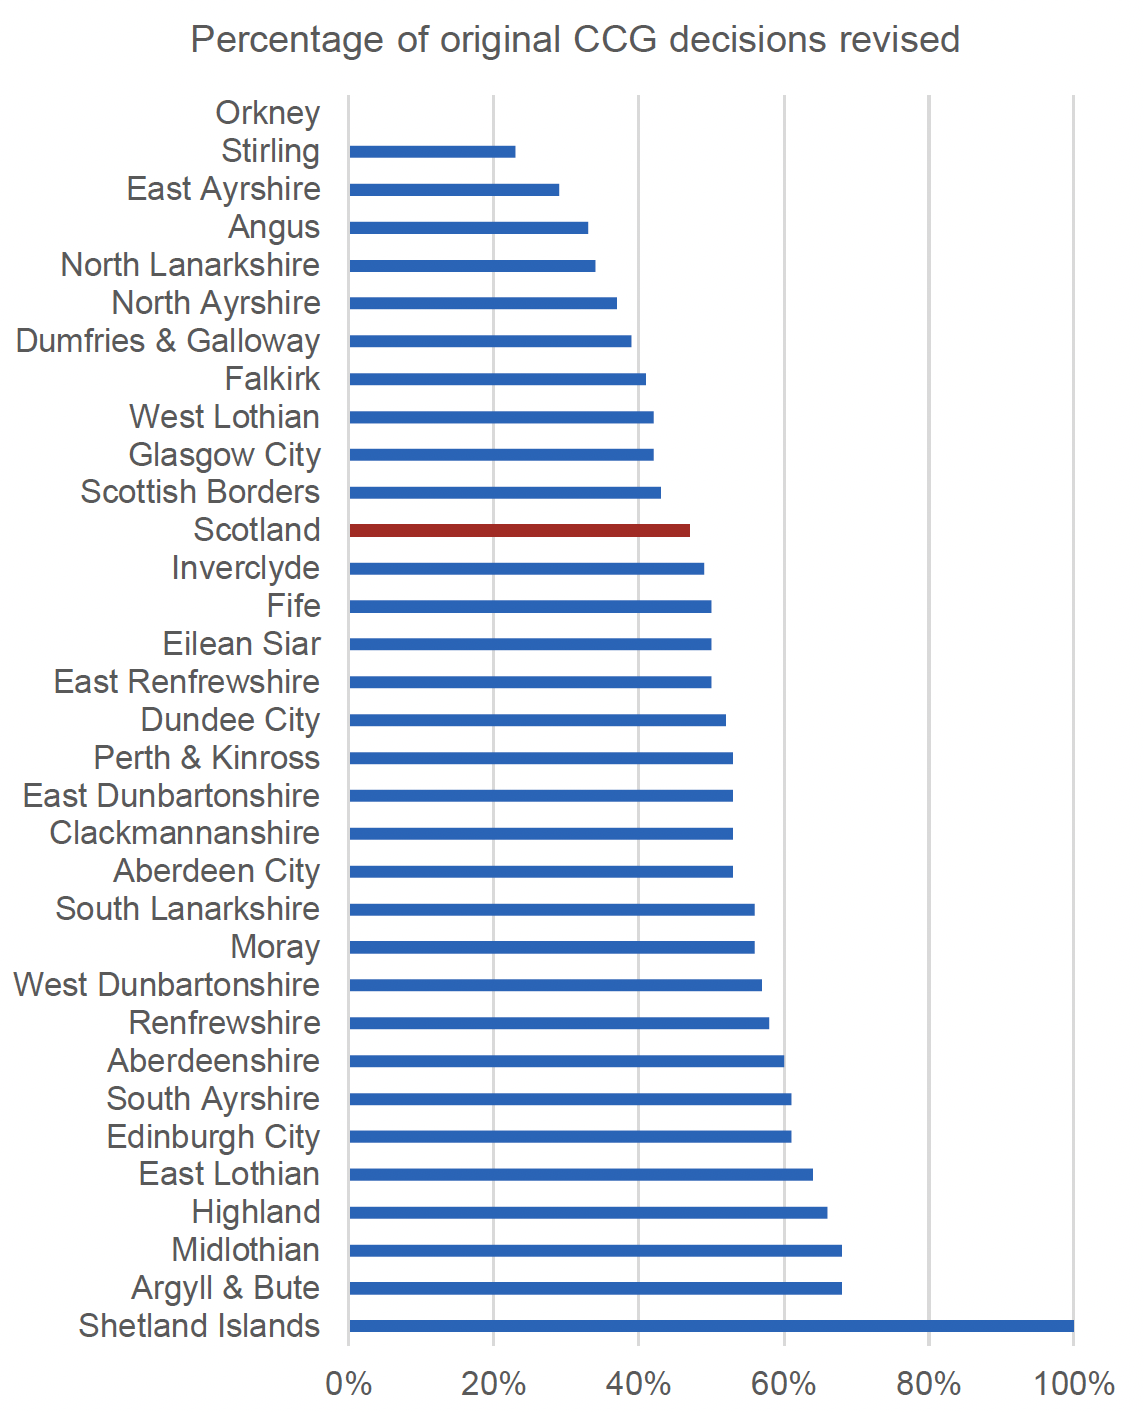
Source: Scottish Welfare Fund Statistics 2020/21, Table 56a
This was significantly higher than average in the Shetland Islands (100%), Argyll and Bute (68%) and Midlothian (68%) (all 1 standard deviation above the mean). However, there were only 10 cases in the Shetland Islands that went to a review. The local authorities with significantly lower than average proportions of decisions revised were Angus (33%), East Ayrshire (29%) and Stirling (23%).
Across the life of the Scottish Welfare Fund, 2% of Crisis Grant applications resulted in a Tier 1 review, with reviews significantly more common in Clackmannanshire, Glasgow, Edinburgh, South Ayrshire and Aberdeenshire and much less common in the Island local authorities.
Crisis Grant reviews appear to be more common in those local authorities with higher than expected levels of applications (Clackmannanshire, Glasgow and Edinburgh). This was not the case for South Ayrshire and Aberdeenshire though. Indeed, Aberdeenshire had a significant underspend pre-Covid (spending just 71% of the 2019/20 budget).
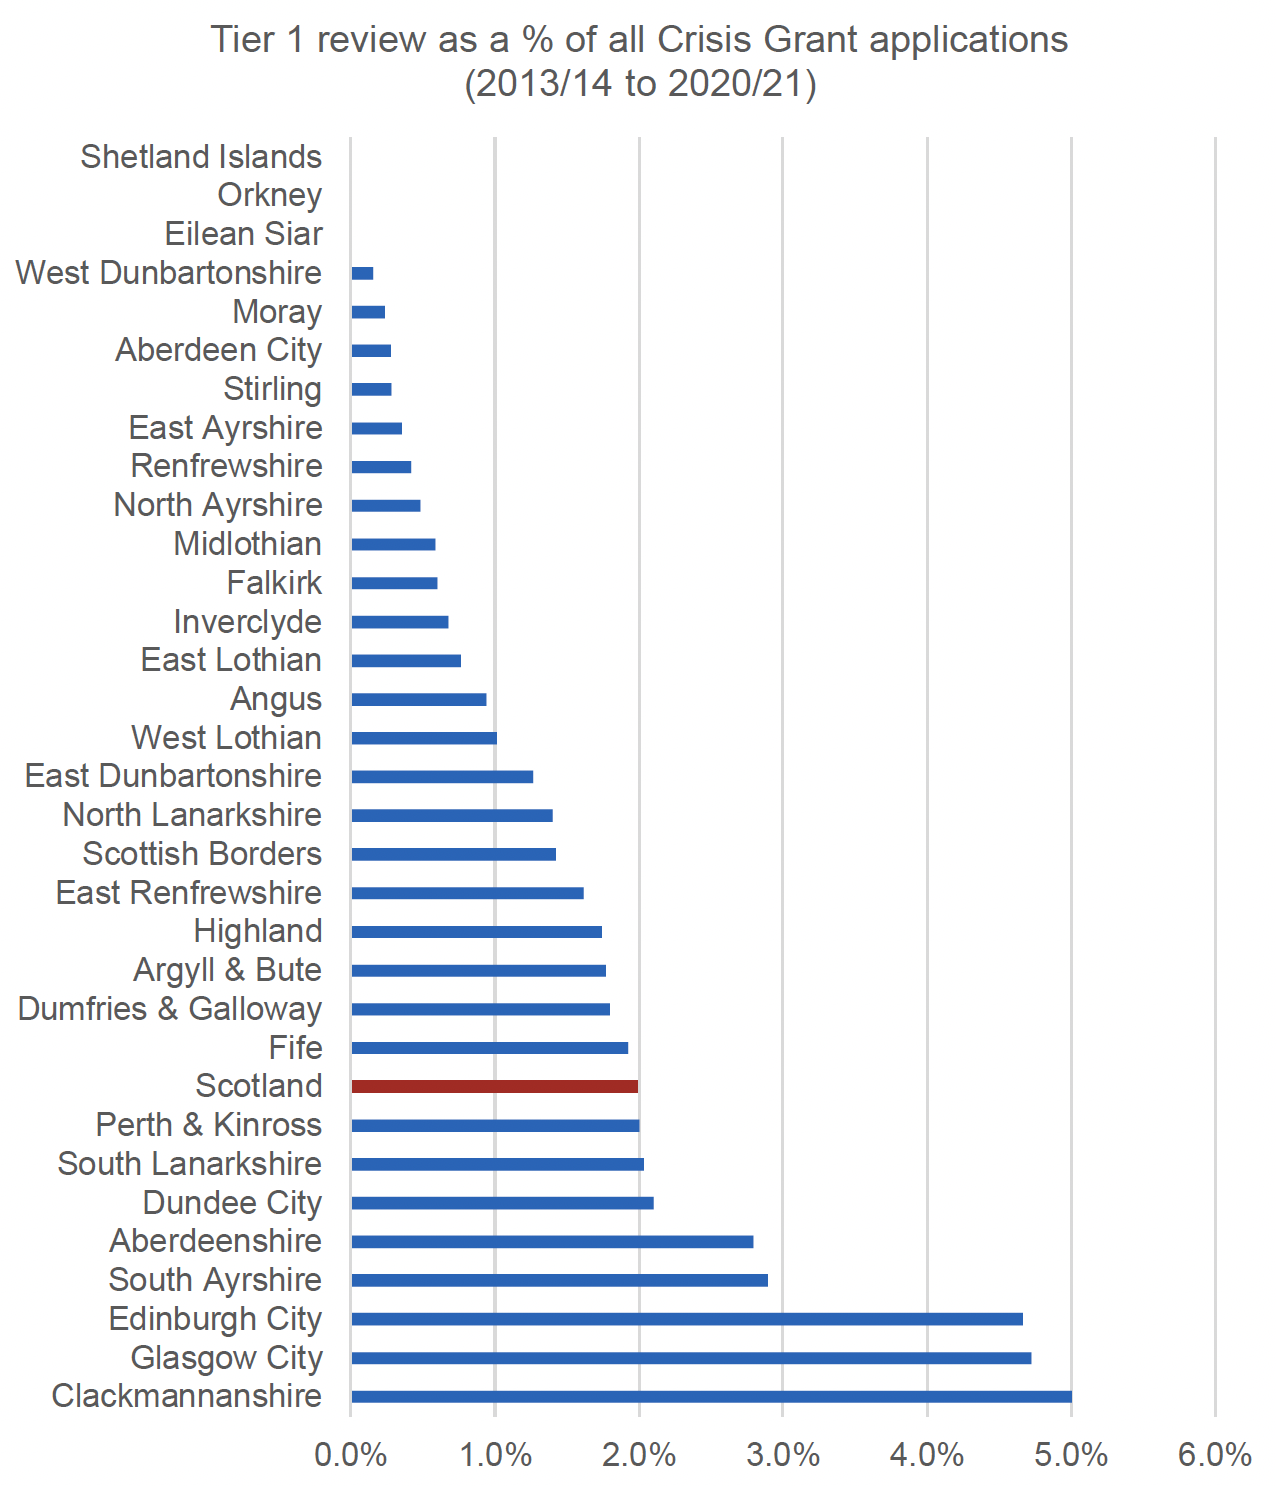
Source: Scottish Welfare Fund Statistics 2020/21, Table 55b and Table 4
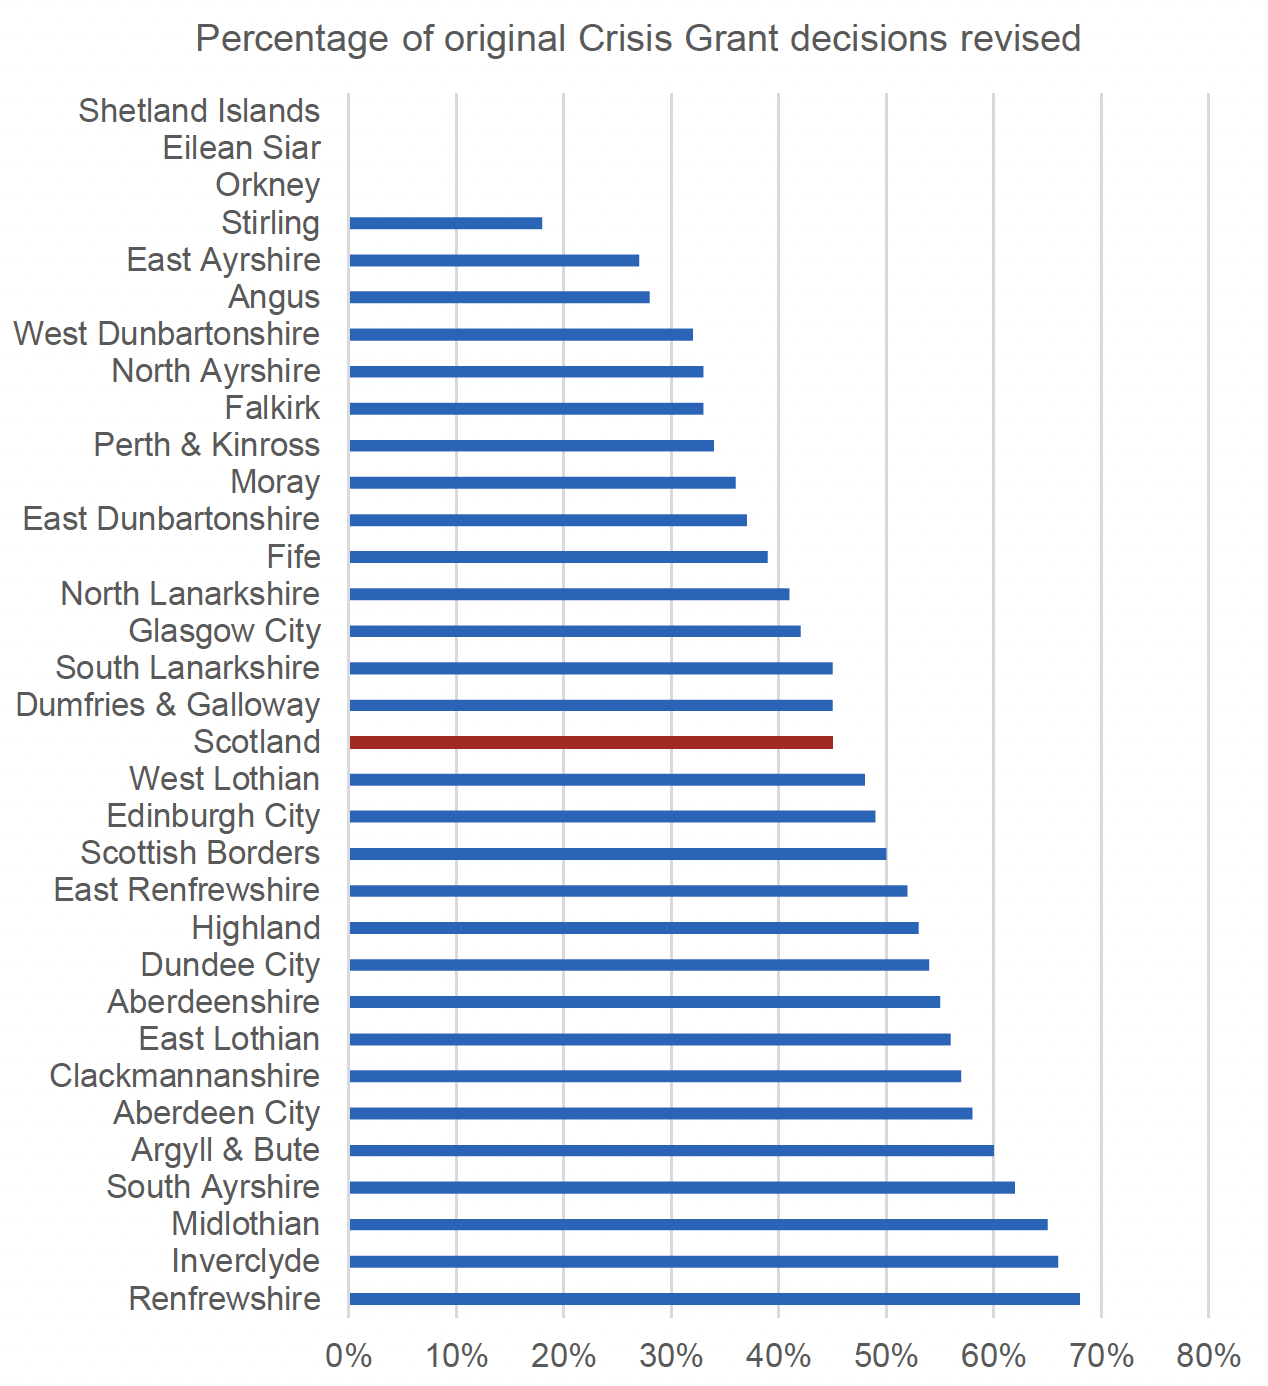
Source: Scottish Welfare Fund Statistics 2020/21, Table 56b
Across Scotland in the period between 2013/14 and 2020/21, 45% of Crisis Grant Tier 1 reviews led to a change in the original decision. The areas with a significantly higher proportion of decisions revised were Renfrewshire, Inverclyde, Midlothian, South Ayrshire and Argyll and Bute, with over 60% of Tier 1 decisions revised. Only Renfrewshire was a higher pressure area (with more applications per UC claimant/child in low income household) and most of the other local authorities tended to have a lower than average proportion of cases going to review.
Renfrewshire and Midlothian both have a higher than average proportion of Crisis Grant applications as a proportion of all applications (over 80%) while Inverclyde and Argyll and Bute had a lower than average proportion (less than 70%). Applicants in Renfrewshire and Inverclyde had a higher than average success rate in Crisis Grant applications initially, while Midlothian, South Ayrshire and Argyll and Bute had more average success rates. Midlothian had a higher than average level of repeat applications and repeat awards for Crisis Grants.
The Island local authorities show no decisions revised (as there were too few reviews to tabulate) and Angus, East Ayrshire and Stirling changed the fewest decisions (Angus 28%; East Ayrshire 27%, Stirling 18%). These areas also had a low proportion of cases going to review and average success rates initially.
Taken together, this data provides some evidence that Tier 1 reviews are more common in higher-pressure areas with higher than expected numbers of applications. In the case of Crisis Grants, Tier 1 reviews involved fewer revised decisions where a low proportion of cases went to review and where initial decision-making tended to also be generally more favourable for applicants.
Reasons for Tier 1 reviews
The reasons recorded for the Community Care Grant and Crisis Grant Tier 1 reviews were most commonly recorded as 'other' reasons.
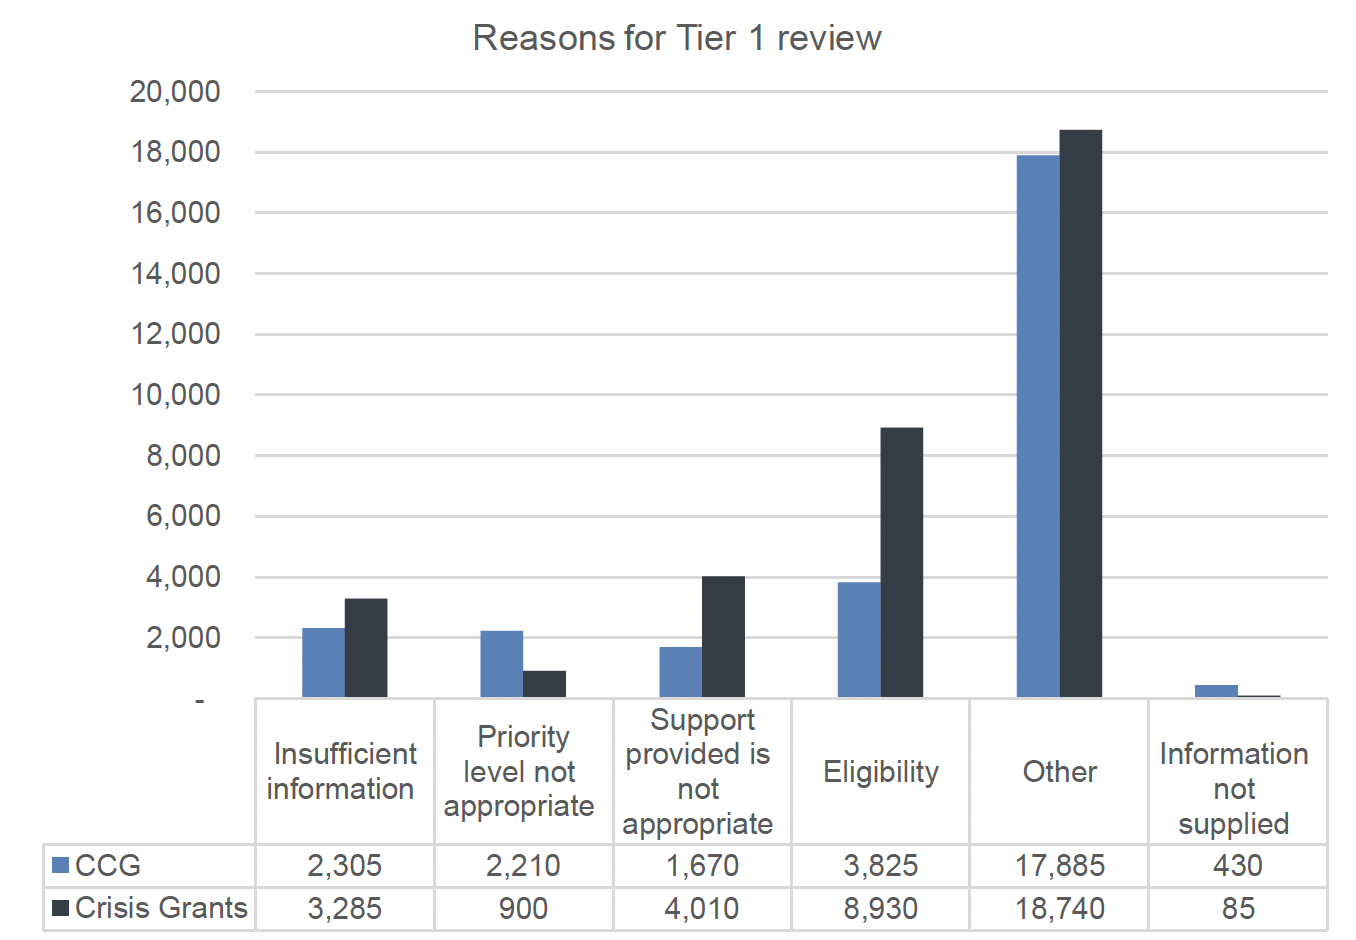
Source: Scottish Welfare Fund Statistics 2021/22, Tables 55a & 55c
Eligibility was the main coded reason, particularly for Crisis Grants. The priority level not being appropriate was more commonly the reasons for CCG reviews while the support provided not being appropriate is more commonly the reason for Crisis Grant reviews.
Unfortunately, area comparison is not possible as a large number of local authorities have used only the 'other' code for all their Tier 1 Community Care Grant reviews - Aberdeen, East Lothian, Falkirk, Glasgow, Highland, Perth and Kinross, Renfrewshire and Stirling. This suggests the need for improvements in the recording of the Tier 1 reasons in many local authorities.
Tier 2 reviews
In the latest year pre-Covid (2019/20) the SPSO received 1,038 Tier 2 review applications – a 29% increase on the 805 in the previous year[22]. This related to 339 Community Care Grants and 699 Crisis Grants. During the year, the SPSO determined a total of 1,035 review applications – a 29% increase on the 800 in the previous year (336 Community Care Grants and 699 Crisis Grants).
In total, 1,859 people contacted the SPSO Scottish Welfare Fund team, an increase of 19% from the previous year. A total of 821 people were signposted to other forms of assistance, with 634 of those signposted to their local council.
A total of 841 review requests were progressed to a decision being made, with an uphold rate (where the LA decision was changed) of 53% for Community Care Grant applications, which was up slightly from 51% in the previous year. The uphold rate for Crisis Grant applications was 27%, down from 32% in the previous year. In 2020/21 data showed the same uphold rate for Community Care Grants (53%) and a further reduced uphold rate (25%) for Crisis Grants.
So, if Tier 2 decisions provide an indicator of how well initial decisions are made, then Community Care grant decisions were worse in 2019/20 than previously and stabilised in 2020/21 while Crisis Grant decisions have become better.
The 841 reviews that were progressed are the equivalent of just under 9% of all the cases that went to the Tier 1 review (9,820) or 15% of those cases (5,550) where the original decision had not been revised at the Tier 1 review. Of all applications in 2019/20 (300,170), Tier 1 reviews were undertaken in 3% of cases while Tier 2 reviews were undertaken in just 0.3% of cases.
The overall trend in decisions (pre-Covid and during Covid) is shown in the figure below. This shows the uphold rate of Tier 2 decisions carrying on this trend, with Community Care Grant decisions changed in 53% of cases in 2020/21 and 52% of cases in 2021/22 while Crisis Grant decisions changed in 25% of cases in 2020/21 and 18% of cases in 2021/22.
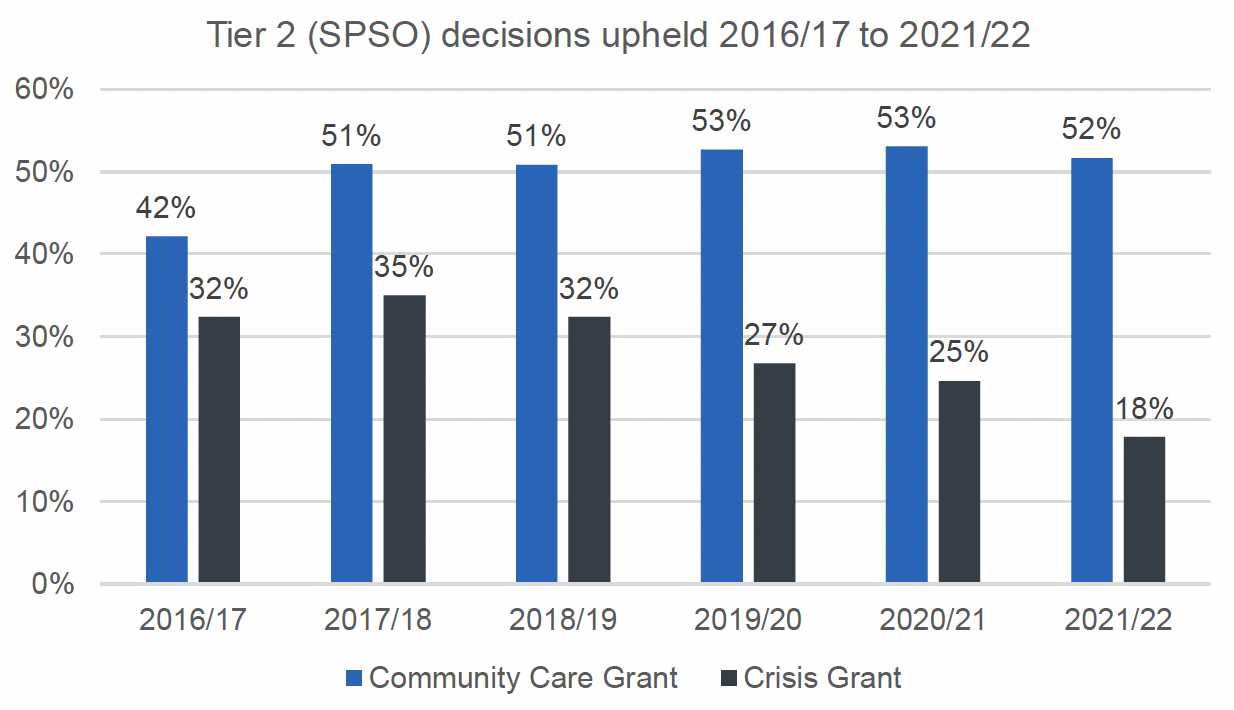
Source: SPSO
This indicates that only a small minority of applicants seek out a review, with even fewer reviews in some local authorities. Overall, Tier 2 decisions suggest that Crisis Grant decisions may have improved more recently while Community Care Grant decisions have stabilised.
The local authority level analysis is limited due to the small number of cases in some smaller local authorities. This means the data need to be interpreted with caution, with small number highlighted below (e.g. 100% can be 2 cases). The figure below combines the data for all reviews between 2016/17 and 2021/22 – 1,367 Community Care Grant Tier 2 reviews and 2,620 Crisis Grant Tier 2 reviews.
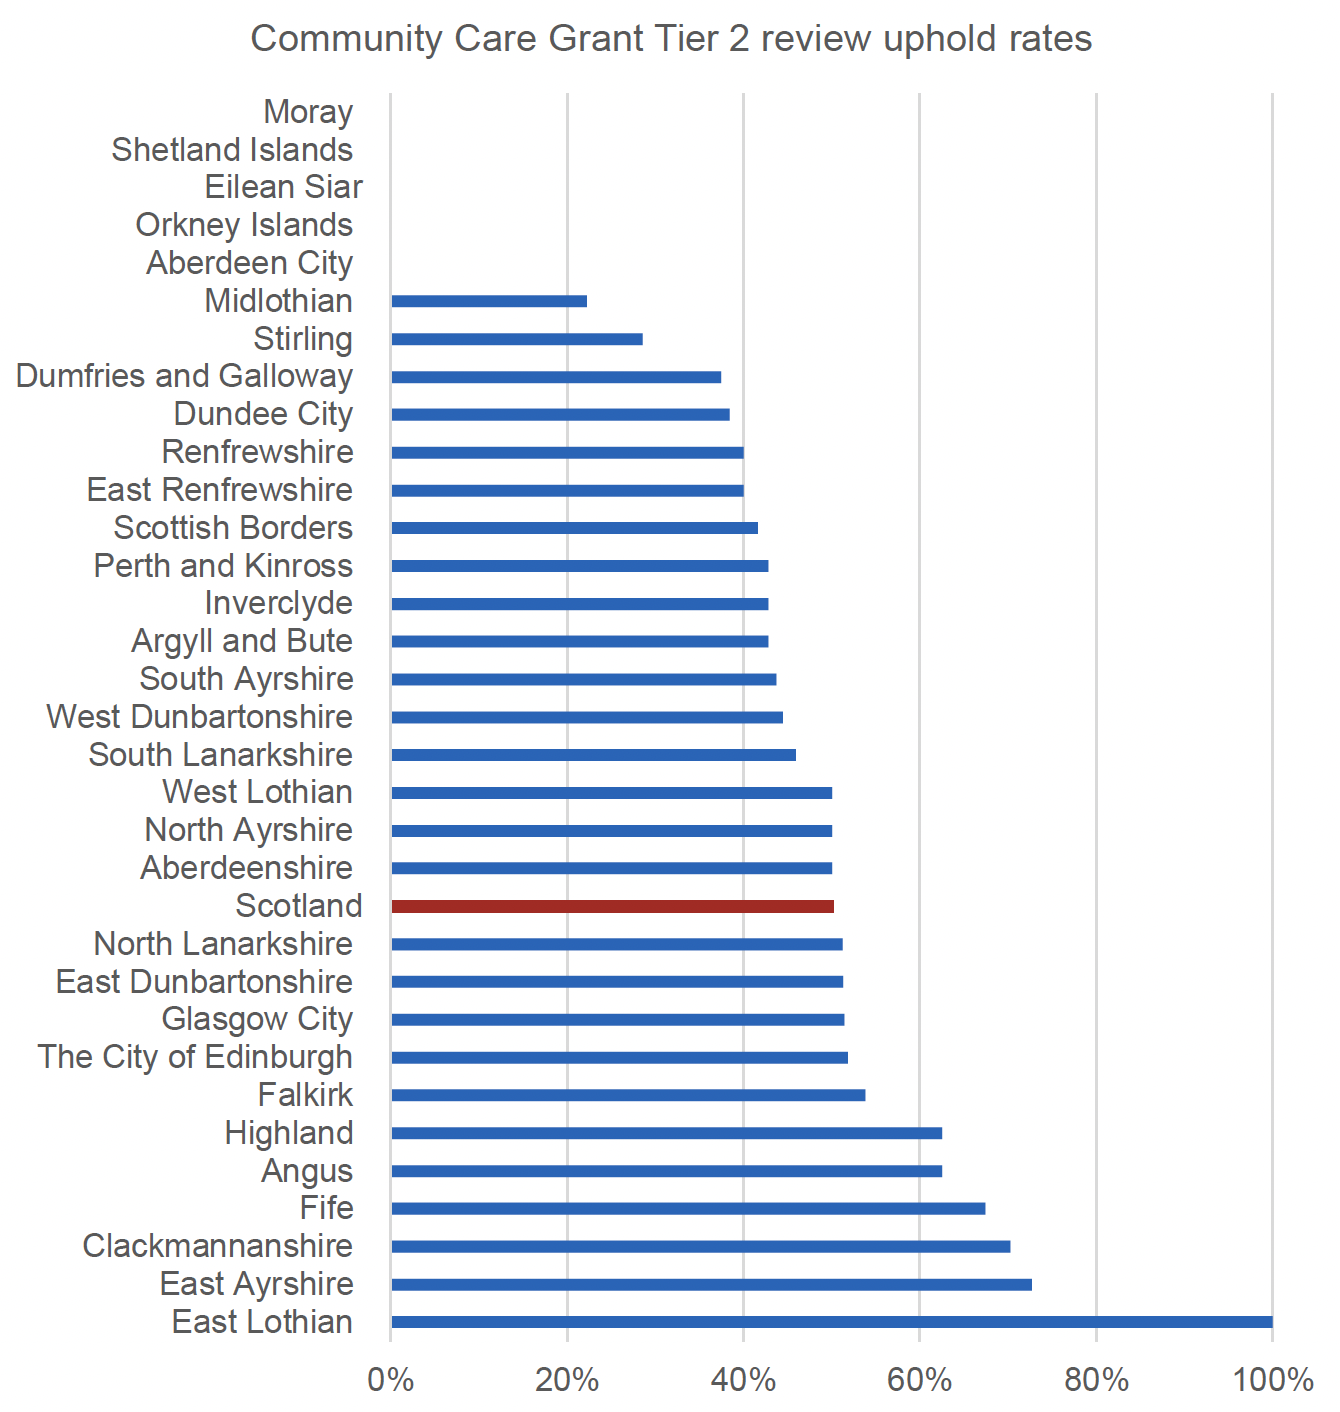
Source: SPSO
Uphold rates were higher than average, as so more decisions changed, for Community Care Grant Tier 2 reviews in East Lothian (though this represented 100% of just 2 cases), East Ayrshire (73% of 44 cases) and Clackmannanshire (70% of 37 cases). Leaving aside East Lothian due to only having two cases, East Ayrshire had an average proportion of cases going to Tier 1 review but were significantly less likely to change the decision at that review. Clackmannanshire had a higher than average proportion of cases going to Tier 1 review and a comparatively low success rate for Community Care Grant decisions, with a higher than average number of repeat applications and awards.
Uphold rates were lowest for Community Care Grant Tier 2 reviews in Midlothian (22% of 18 cases), Aberdeen (0% of 2 cases) and the Orkney Islands (0% of 1 case). There were no Tier 2 review cases in Eilean Siar, the Shetland Islands and Moray. Midlothian had a high level of repeat CCG applications and a high number of applications to help people stay in the community and average success rates but also changed a high proportion of their decisions at the review Tier 1 stage. Aberdeen and Orkney had too few cases to comment on.
For Crisis Grant Tier 2 reviews, uphold rates were higher and more decisions changed in East Renfrewshire (100% of 2 cases) the Scottish Borders (100% of 1 case). No decisions were changed in Midlothian (15 cases) Stirling (12 cases) and Moray (2 cases). There were no Tier 2 review cases in Eilean Siar, the Orkney Islands and Shetland Islands.
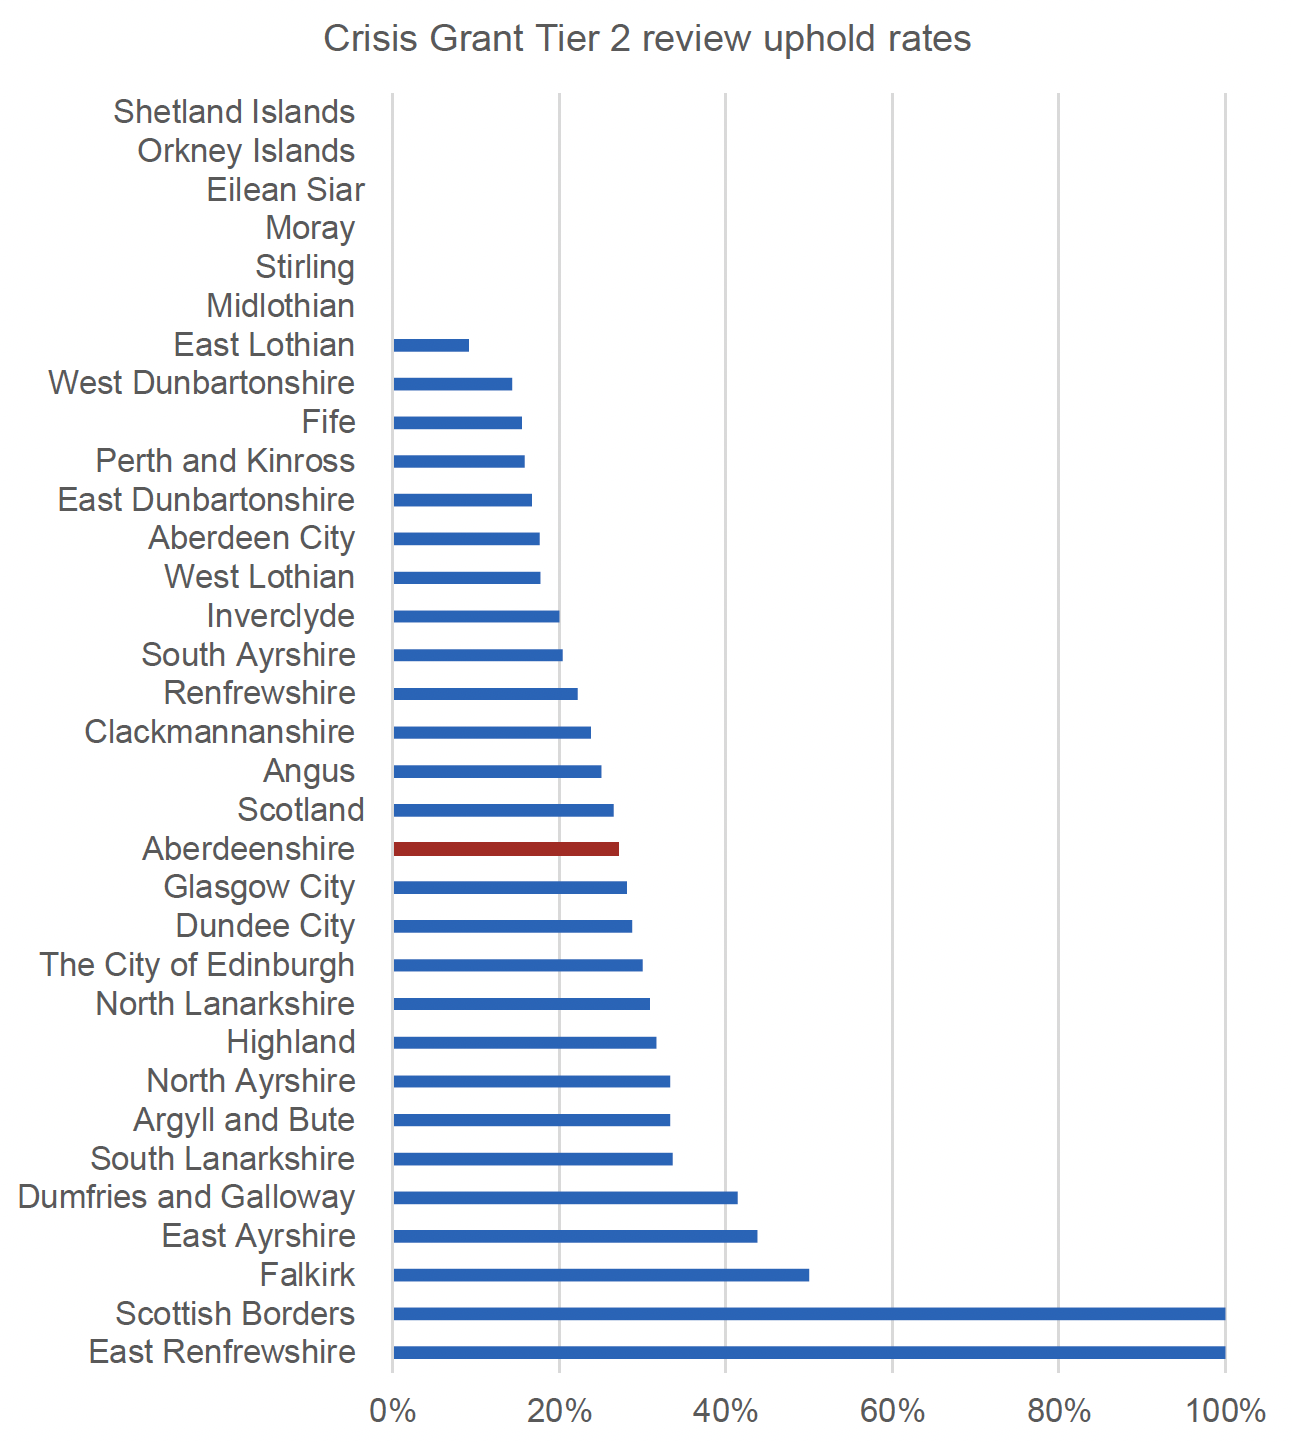
Source: SPSO
Midlothian had a high proportion of repeat Crisis Grant applications and awards but also changed a higher than average proportion of decisions at Tier 1 stage while Stirling had a low proportion of Tier 1 reviews.
Although increased application pressure appears to have a role in Tier 2 review outcomes, local authorities more likely to change their own decisions at the Tier 1 review appeared to have fewer decisions changed, for Crisis Grants, at Tier 2 review.
Contact
Email: Socialresearch@gov.scot