Scottish Welfare Fund review: final report - data analysis appendix
An appendix to the main report of the review of the Scottish Welfare Fund, containing technical detail of the secondary analysis.
5. Experiences and outcomes
Key points
- Crisis Grant applications have always been more likely than Community Care Grant applications to result in an award. However, award success rates for both grant types fell in the years prior to the pandemic (and remained lower in 2021/22).
- Falling success rates are likely to reflect multiple factors, including budget pressures, and the changing profile of applicants, with applicants with specific vulnerabilities (who are more likely to be successful) accounting for a smaller proportion of applications in recent years.
- Pre-pandemic, there were significant differences in SWF application success rates between local authorities, even after controlling for other factors that might impact success. In other words, all other things being equal (household type, reason for applying, disability etc.), the local authority people apply for a grant in has a significant impact on their likelihood of success.
- The relationship between success rates and budget is complicated – there are local authorities with historic overspends with both high and low success rates, and areas with underspends with both high and low success rates. While budget is clearly one important factor, there are likely to be other elements, beyond budgets, impacting on differences in success rates between areas.
- Analysis of other factors that impact on chances of a successful grant generally suggest that level of vulnerability is key, and that grants do appear to be targeted towards those with more recorded vulnerabilities.
- The average award level for Community Care Grants has reduced over time, while the average Crisis Grant has increased.
- Pre-pandemic, there were large variations between local authorities in the size of the average Community Care Grant award. These appear to reflect, at least in part, differences between areas in the reasons for applying for grants. However, budget also appears likely to be a factor, with historically under-spending areas making larger average awards.
- Crisis Grant award levels varied less between local authorities and there was no strong relationship with budget overspends.
- Only a minority of applicants to either grant were reported as having been referred to another service provider for help – around a third in each case.
What experiences and outcomes do applicants have, and what drives more positive experiences?
Key themes explored in this chapter are:
- Award success rates for Community Care Grants and Crisis Grants over time and by local authority, considering the relationship between outcomes and overall expenditure
- The profile of award recipients and different experiences of applicants of different types
- Analysis of the key drivers of successful outcomes, based on regression analysis, which allows us to consider which factors drive outcomes more than others.
- The changing profile of successful and unsuccessful applicants over time, including vulnerable applicants.
- Award levels for Community Care Grants and Crisis Grants over time, by local authority and among different groups.
- Referral pathways for successful and unsuccessful applicants, changes over time and differences between local authorities, including analysis of vulnerability.
- Who accesses support in applying (and where) and how this impacts on outcomes.
- Another potential enabler examined is the method of application, how this has changed over time and how this varies by local authority.
- Repeat applications and repeat awards over time, by local authority and by applicant type.
Outcomes
Award success rates for both Community Care Grants and Crisis Grant had been reducing over recent years, pre-pandemic. In 2014/15, 66% of Community Care Grant applications resulted in an award compared with just 54% in 2019/20. During the pandemic, this figure increased slightly to 57% in 2020/21, before falling back to 55% in 2021/22.
Crisis Grants have always been more likely to result in an award, compared with Community Care Grants, but this has reduced from 72% of Crisis Grant applications resulting in an award in 2013/14 to 63% receiving an award in 2019/20 before the Covid pandemic. In 2020/21, successful applications increased to 69% of all Crisis Grant applications but this fell back to 66% in 2021/22.
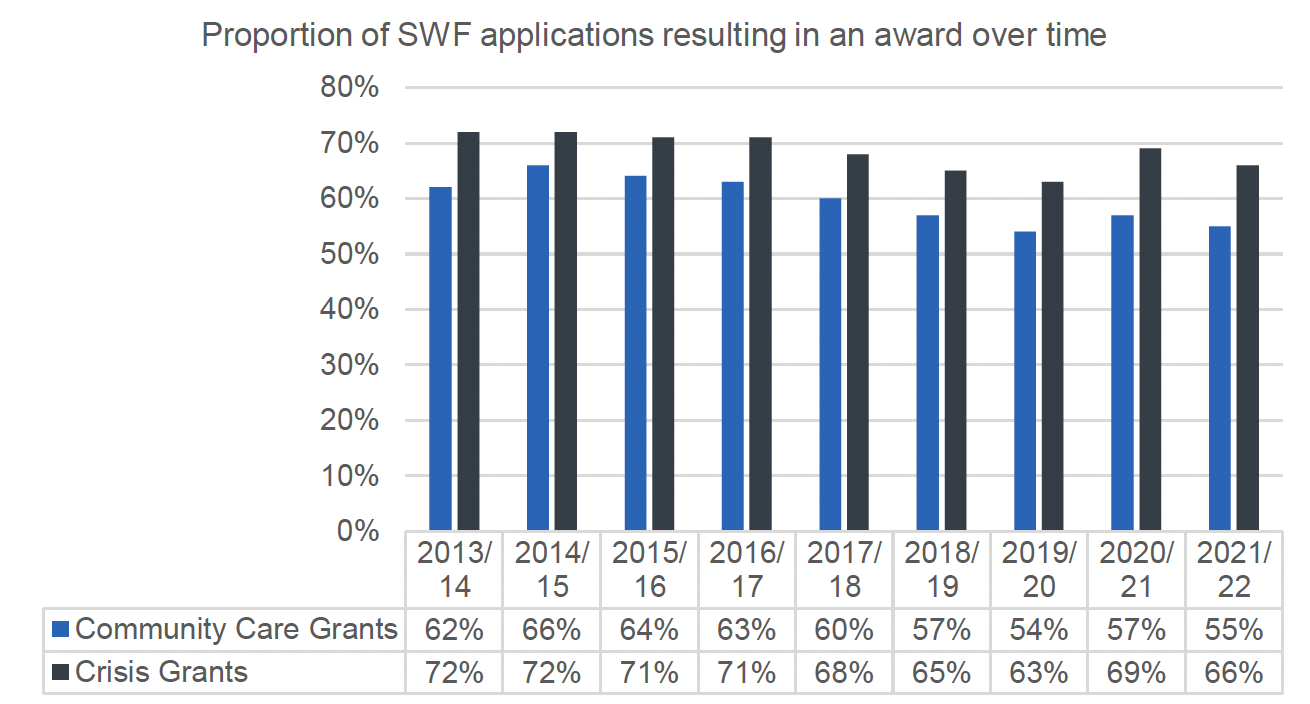
Source: SWF Annual Report 2021/22, Table 23 & Table 28
There was significant variation between areas in success rates (pre-pandemic), from 34% of Community Care Grant applications in Fife resulting in an award compared with 85% in the Orkney Islands, and 54% of applications resulting in an award across Scotland.
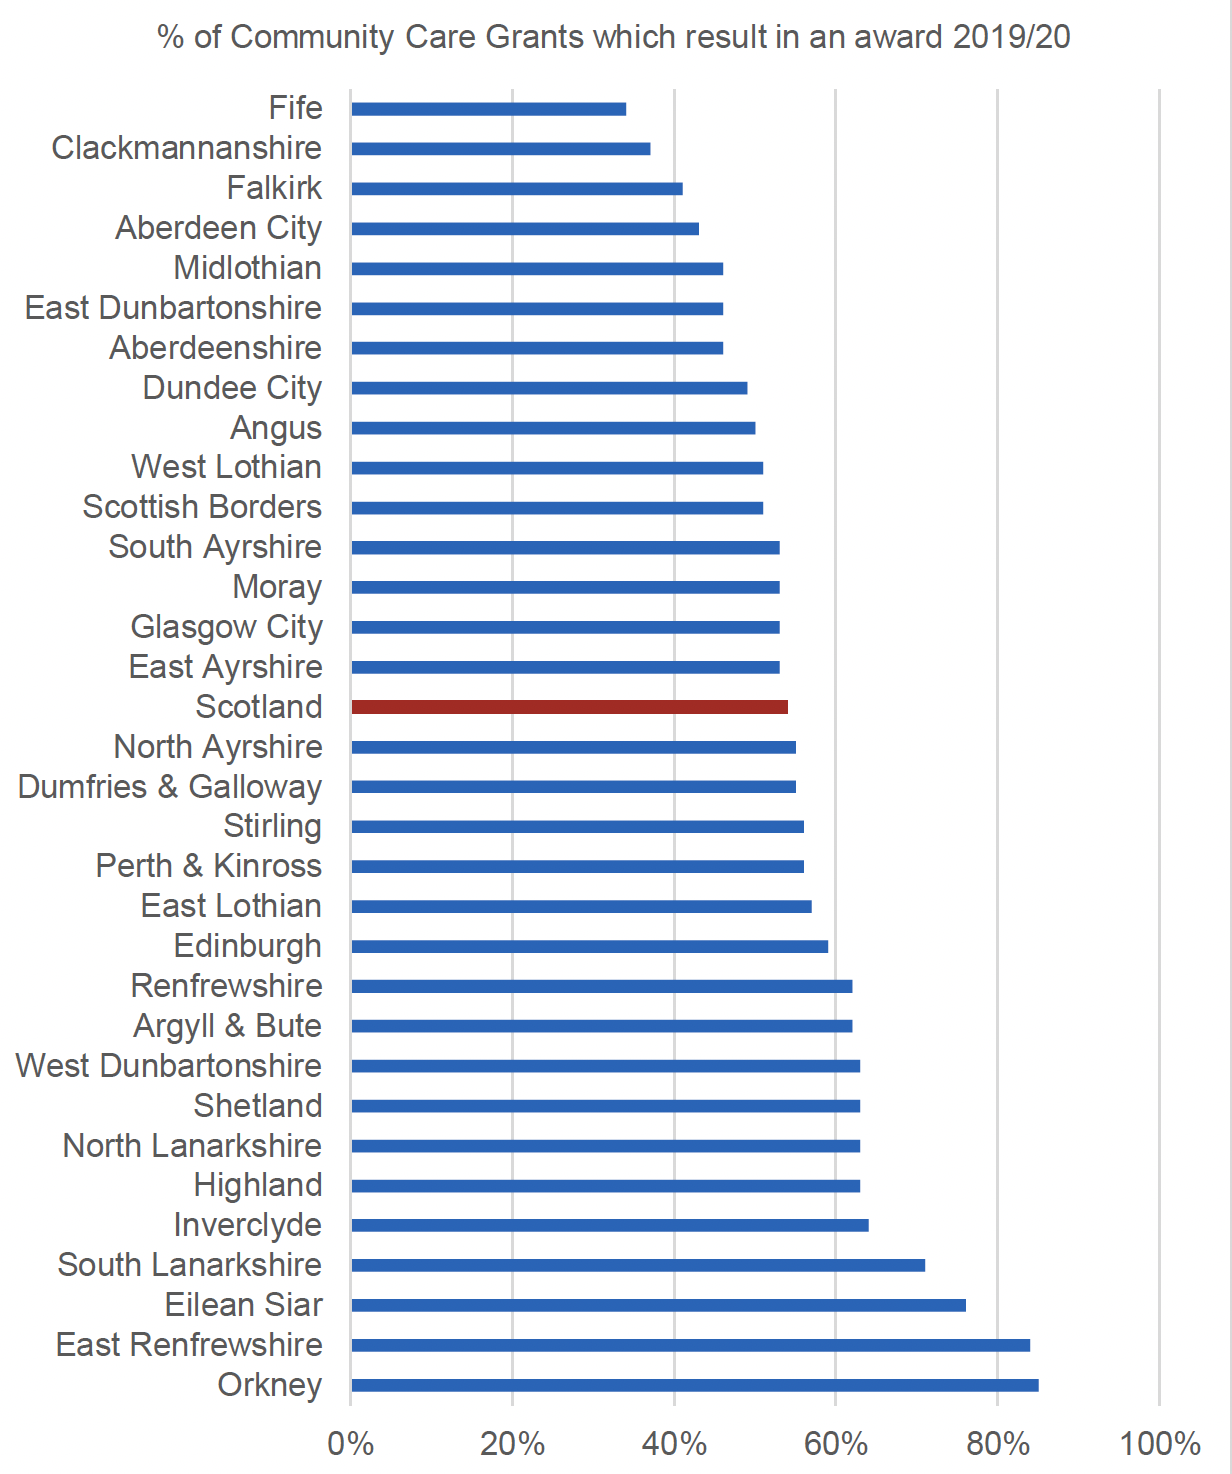
Source: SWF Annual Report 2019/20, Table 23
Significantly higher than average success rates (pre-pandemic) were also found in East Renfrewshire, Eilean Siar and South Lanarkshire while significantly lower than average success rates were also found in Aberdeen, Falkirk and Clackmannanshire.
Aberdeen and Clackmannanshire had lower than average success rates in Community Care Grants alongside higher than expected application rates. This was not the case for Fife and Falkirk, which had average application rates for Community Care Grants. However, Fife was well over budget in March 2020 (128%) as was Clackmannanshire (114%) but Falkirk was very under budget (66%) and Aberdeen spent its budget (100%).
Orkney, East Renfrewshire and Eilean Siar had higher than average success rates for Community Care Grant applications alongside lower than expected application rates for Community Care Grants. South Lanarkshire had Community Care Grant application rates close to the average but higher than average success rates. South Lanarkshire had been over budget in March 2020 (123%) while the others were not (East Renfrewshire 97%, Orkney 86%, Eilean Siar 34%).
In summary, in some areas, the overall volume of applications and budget spending did appear to be related to the likelihood (or not) of a successful Community Care Grant award, with a lower application rate and tendency to underspend associated with higher success rates. However, this was not always the case, so it is difficult to infer a consistent relationship.
For Crisis Grants, 63% of applications across Scotland resulted in an award in 2019/20, ranging from just 46% in North Ayrshire to 97% in Eilean Siar. Significantly higher than average success rates were also found in West Dunbartonshire, Renfrewshire and Inverclyde, with lower than average success rates found in Falkirk, South Lanarkshire and East Lothian.
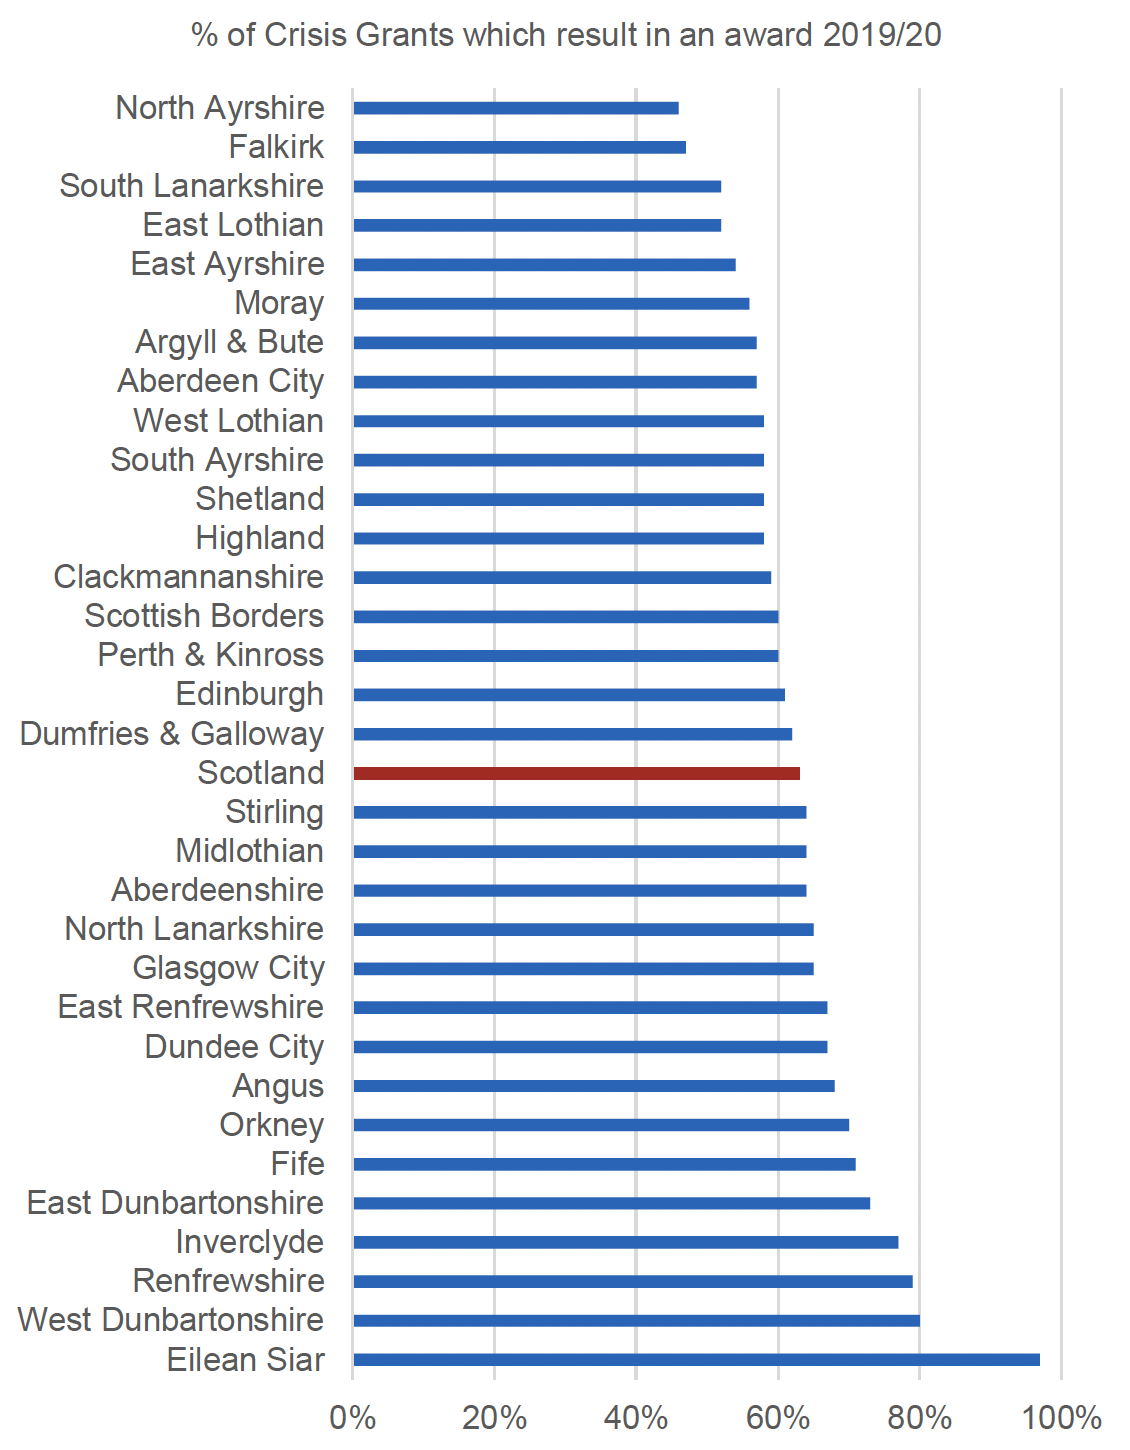
Source: SWF Annual Report 2019/20, Table 28
For Crisis Grant applications, there was less of an obvious correlation between the total rate of applications and success rates. Eilean Siar had a high application success rate and lower than expected Crisis Grant applications. However, West Dunbartonshire and Renfrewshire had a higher than average success rate as well as having a higher than expected rate of applications. Inverclyde had higher than average success rates and broadly average application rates.
Among the local authorities with lower than average success rates, Falkirk and East Lothian had average levels of applications and South Lanarkshire had a lower than average rate of applications compared with the number of UC claimants.
In terms of the relationship with budget over- or underspends, there was little evidence of rationing of provision in higher demand areas. Most areas with higher than average success rates were overspending slightly (104%-108%) except Eilean Siar, which significantly underspent.
Successful applications and funding patterns
Comparing 'raw' success rates and levels of spending may potentially be misleading, as there may be other variations in the profile of applications between areas that would be expected to impact on success rates – such as the level of repeat applications received. Given this, we have also compared relative success rates once other factors have been taken into account (via regression analysis) and patterns of expenditure.
Looking at the regression analysis results (see detailed analysis later in this chapter) and patterns of expenditure, there were some local authorities where there was a lower chance of receiving an award (after controlling for other factors), but where the local authority had generally underspent their budget. This was the case in Falkirk and Midlothian, with significantly poorer success among Community Care Grant applicants alongside a long-term history of underspending the SWF budget. However, as noted earlier, many of those local authorities that were underspending previously have indicated a change in experiences in recent times. Staffing issues and overall capacity may also affect decision-making, if it limits the collection of supportive evidence. For this reason, significant and detailed analysis and audit would need to precede any changes to the funding regime.
Applicants also had a significantly lower success rate in applying for Crisis Grants in Argyll and Bute and Falkirk but with long-term budget underspends. In these areas, it is arguable that increasing funding would be unlikely to result in better outcomes for applicants. However, again, more detailed up-to-date analysis would be needed, considering the extent to which decisions are constrained by staffing or other capacity issues, in which case additional funding may benefit decision-making by providing more staff time to more fully capture evidence.
Regression analysis indicates that the local authorities with a higher proportion of successful outcomes for applicants (after other differences were also taken into account) more commonly had overspent their budgets – West Dunbartonshire, Dundee, Edinburgh, North Ayrshire and South Ayrshire, Renfrewshire and Fife for example. Funding increases to these areas would be expected to be likely to result in better outcomes for applicants. However, this assumes that money has been spent effectively and well, and this would need to be examined in more detail, based on up-to-date data. Detailed budget appraisal is likely to need more information than routinely collected, however.
There are also some instances of overspent budgets where applicants had lower than average success rates for both Community Care Grants and Crisis Grants as well as long-term underspending alongside significantly higher success rates among Crisis Grant applicants. Again, it is less clear how additional funding may impact these scenarios. More detailed analysis of these outliers needs consideration before these relationships are used to determine funding. For example, high levels of successful applications alongside underspending may indicate a low level of awareness of the SWF or stigma/aversion to applying, particularly in more rural areas, so those who do apply see less rationing/a more generous system. Reducing funding in that scenario would be very unhelpful in addressing needs.
In summary, although we may assume that additional funding is likely to have positive impacts in high demand areas where there are also high levels of successful applications (often with overspending), it is likely that there is far more going on under the surface of 'success' or the lack of it. For this reason, any consideration of the funding regime would need detailed analysis of up-to-date information on outcomes and practice.
The detailed analysis of recipients profiles and the regression analysis below allows us to better understand where awards have been given and the extent to which more vulnerable applicants are prioritised, where rationing is required.
Profile of recipients
The evidence review suggests that some of the shift between Community Care Grants and Crisis Grants and the changing reasons for applications (discussed above) may be related to a potential changes in applicant characteristics.
In March 2020, the household profile of all unique households having received funds from the Scottish Welfare Fund between 1 April 2013 and 31 March 2020 (pre-pandemic) was as follows:
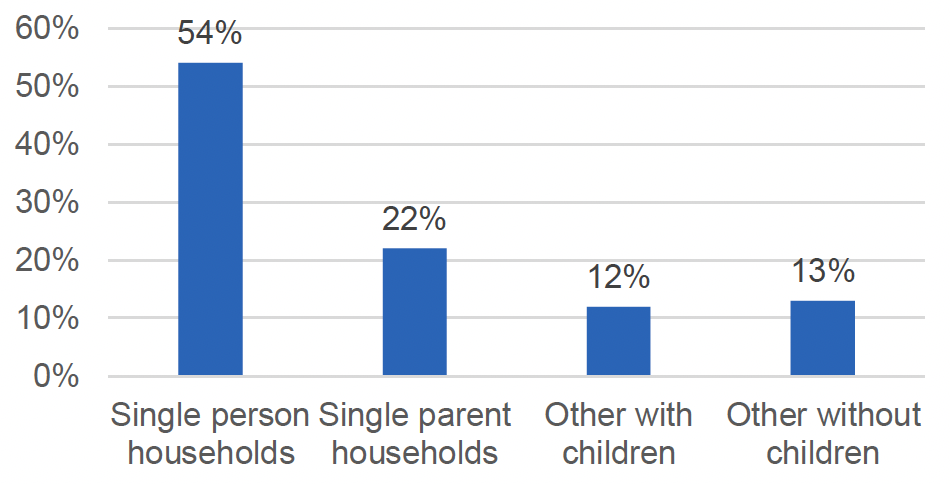
Source: Scottish Welfare Fund Statistics Chart 15: Household types of unique households receiving funds from the Scottish Welfare Fund, 1 April 2013 to 31 March 2020
| Household Type – 2013/14 | Receiving CCG(s) | Receiving Crisis Grant(s) |
All Households Receiving Assistance |
|---|---|---|---|
| Data value missing | 0% | 0% | 0% |
| Single Person | 51% | 57% | 55% |
| Single Parent | 28% | 19% | 22% |
| Couple | 4% | 4% | 4% |
| Couple with Children | 7% | 7% | 7% |
| Other | 7% | 9% | 9% |
| Other with Children | 3% | 3% | 3% |
| All Households | 100% | 100% | 100% |
| Any with children | 38% | 29% | 32% |
| Household Type 2013/14-2019/20 | Receiving CCG(s) | Receiving Crisis Grant(s) |
All Households Receiving Assistance |
| Data value missing | 0% | 0% | 0% |
| Single Person | 54% | 55% | 54% |
| Single Parent | 27% | 21% | 22% |
| Couple | 4% | 5% | 6% |
| Couple with Children | 7% | 9% | 9% |
| Other | 5% | 7% | 7% |
| Other with Children | 2% | 3% | 3% |
| All Households | 100% | 100% | 100% |
| Any with children | 37% | 33% | 34% |
Source: Scottish Welfare Fund Statistics 2013/2014 and 2019/20
Looking back to the data for 2013/14[20] the household profile was very similar, with 55% of households receiving awards being single people and 22% single parents, 13% other households without children and 10% other households with children.
Single parents more commonly received Community Care Grants – being 28% of recipients of Community Care Grants in 2013/2014 and 27% of recipients of Community Care Grants between 1 April 2013 and 31 March 2020.
In 2013/14, 32% of recipients of awards were households with children while across the whole period from the start of the scheme up to March 2020, 34% were households with children. This suggests a slight shift towards families over the life of the scheme. This is driven by Crisis Grants rather than Community Care Grants, though, with families with children being 29% of Crisis Grant recipients in 2013/14 but 33% of recipients over the whole period to 31 March 2020. In 2013/14 households with children accounted for 38% of Community Care Grant recipients compared with 37% over the whole period. So, although 'families in exceptional need' may be more commonly the reason for applying for Community Care Grants in recent years, this is not associated with more families receiving awards than previously, compared with other types of household.
Understanding successful applications
Regression analysis aims to summarise the relationship between a 'dependent' variable and one or more 'independent' explanatory variables. Logistic regression predicts the likelihood of something happening, based on the characteristics included in the model. For this report, we used logistic regression to examine the likelihood of a) receiving a Community Care Grant award and b) receiving a Crisis Grant award. Annex 2 explains how to interpret logistic regression in more detail and provides results of the models.
Two separate logistic regression model were run to examine the receipt (or not) of (a) Community Care Grant awards and the receipt (or not) of (b) Crisis Grant awards. The models were run on the 2019/20 management data to examine the pre-pandemic experience. This is to examine more 'typical' experiences, since the pandemic affected the reason for applications, with fewer applicants who had run out of benefit/incomes and more applicants for 'other' reasons (see Figures 14 and 15).
The regression analysis was not without issues as there was a lot of missing information in the management data. Missing information means that important variables are excluded from the models – including income, ethnicity and religion as well as immigration status. These variables have a very large number of missing cases (with immigration status missing for several local authorities).
The variables included in the final models (and discussed below) are significant in helping to explain the odds of receiving an award, controlling for all other variables in the model. Other variables that were tested in the regression analysis and were not significant included some benefits, vulnerability categories and types of referral, for example. Some variables were significant in the Community Care model but not the Crisis Grants model and vice versa.
The overall extent to which the factors included in the model predict the outcome (the dependent variable) is measured using a test of the 'Pseudo R-squared'. A higher pseudo R-squared indicates the model better predicts the outcome of receiving an award. The model R-Square for the Comomunity Care Grant model (0.35) was higher than that for the Crisis Grant model (0.18), indicating that the Community Care Grant model is better at explaining what predicts whether or not someone gets an award than is the Crisis Grant model.[21]
Factors associated with successful Community Care Grant applications
Controlling for all the other variables in the model, local authority is the most influential factor, with the largest effect on the likelihood of receiving an award. Regression analysis compares all categorical variables with a reference category, usually the first or last category. Aberdeen was selected as the first category alphabetically. Those in West Dunbartonshire, South Lanarkshire, North Ayrshire, Edinburgh and Dundee were among the authorities more likey to receive an award, compared with Aberdeen. In the model, applicants in West Lothian, Midlothian and Falkirk were significantly less likely to have success compared with Aberdeen, controlling for the other variables. In the graphs above, which do not control for interactions between local authority and other factors, West Lothian and Midlothian fared better than Aberdeen, suggesting that other variables in the model drive that success.
The reason for the application is another key driver of application success. Compared with the reference group of those getting help on leaving hospital, those needing help to improve a home to maintain living conditions were less likely to receive a Community Care Grant, as were those with other reasons to need help to stay in the community or other reasons for applying. Those leaving other institutions - care homes, a hostel or shelter, sheltered housing, local authority care and foster care or prison or detention centre and those needing to move to care and support someone were not significantly different in success to those leaving hospital, so also highly likely to receive an award.
Vulnerability is important – applicants with no vulnerability issues recorded were significantly less likely to receive an award as those who had at least one vulnerability recorded. Those vulnerable due to homelessness more likely to receive an award as those who were not and those vulnerable due to domestic abuse were also more likely to get award compared with those who were not. People vulnerable due to mental health issues, chronic ill-health or with other physical health issues were more likely to receive an award compared with those not vulnerable due to these vulnerabilities. The likelihood of a successful application also increased with age.
Vulnerable young people had mixed experiences – young people unable to live with their parents as this would put them in danger or young people living with an adult with disabilities were less likely to receive a Community Care Grant compared with those who were not, while those leaving care and children living with young people were more likely to receive an award.
Help to apply was important – those who received help to apply and those who had a third party apply on their behalf were more likely to get a Community Care Grant award compared with those who applied alone.
Property tenure – social renters more commonly received awards. Those living with friends/partners, those living with family/relatives or in the private rented sector were less likely to receive awards compared with those in a social rented tenancy. Those moving into a social rented tenancy are more likely to get an award than those not moving, while those moving into the private rented sector are less likely to receive an award as those not moving.
Disability was more complex – as shown above, vulnerable applicants with chronic conditions were more likely to receive an award. However, those who said there was no-one in the household with a disability or who refused information were more likely to receive and award compared with those who reported a health issue or disability. Those in receipt of disability benefits – DLA or PIP – were significantly more likely to receive awards compared with those not receiving these benefits, while those on other benefits were significantly less likely to (when compared to others not on these individual non-disability benefits, which would include those on disability benefits). This, alongside the vulnerability data suggests that those people with the most severe disabilities and chronic illness were more likely to receive an award. Holding all other things constant, being on other benefits rather than disability benefits is associated with a negative outcome for Community Care Grant awards. This does not mean that those on Universal Credit who are in exceptional need do not receive awards, but means they are less likely to receive an award than those not on UC, which would include people on disability benefits.
Application effects – those applying online were less likely to be successful than telephone applicants, while those applying by post were more likely to be successful. Waiting longer for a decision is associated with lower likelihood of an award, as is being a repeat applicant. Those applying in November, December and January were less likely to be successful compared with those applying in other months. Applications in March were more successful compared with those made in January.
Referrals – those being referred to debt advice, money advice and the men's advice line were less likely to receive an award compared with those who were not, while those referred to other services – housing, social work, hospital, CAB, resilience support were more likely to receive an award compared with those not referred to these services. Those waiting for benefits were more likely to receive an award, compared with those not waiting. But as seen above, receiving benefits is not generally associated with success, except in the case of some disability benefits.
Overall, the findings of this analysis of the 2019-20 Community Care Grants suggests that Community Care Grants are being targeted towards vulnerable people, including homeless people, those fleeing domestic abuse, and often people with disabilities or chronic health issues. However, local authority is also significant, independent of the vulnerability characteristics of applicants.
Factors associated with successful Crisis Grant applications
Again, local authority is a key variable, in the model explaining the likelihood of receiving a Crisis Grant, with many local authorities having a far higher likelihood of success for Crisis Grant awards compared with the reference category of Aberdeen. This included applicants in Eilean Siar, West Dunbartonshire, North Lanarkshire, Dundee, Aberdeenshire, Renfrewshire, Edinburgh and Fife.
Vulnerable applicants were more likely to receive a Crisis Grant, as with Community Care Grants, including those leaving the armed forces, insecure work and domestic abuse, kinship carers and young people estranged from parents. Those vulnerable due to bereavement, mental health issues, homelessness, lone parenthood and chronic ill health also have greater likelihood of receiving an award than people not vulnerable for this reason in each case.
Vulnerable groups less likely to receive an award (controlling for the other variables in the model) included those unable to live with parents due to potential danger, young people living with a disabled adult, children with young parents, people vulnerable due to family breakdown and eviction/repossession. Those with no recorded vulnerabilities were far less likely to receive an award as those with some vulnerability.
Again, disability was more complex, with non-disabled households and those refusing information more likely to receive an award compared with disabled people. In the Crisis Grant model, those receiving DLA and PIP benefits were less likely to receive an award, along with many other people receiving benefits. This may well be because Crisis Grant awards are more commonly made by applicants who have very recently lost employment, are awaiting a decision about a benefit application or whose benefit has been lost or withdrawn for a reason beyond their control. Although by no means generous, having an ongoing income from existing benefits and not being able to evidence an income shock or other set of exceptional circumstances would often lead to a negative decision. For instance, some of those who have been awarded Universal Credit but are awaiting their first payment may be referred back to the DWP to secure a benefit advance, if there were no other exceptional circumstances. 'Running out of benefit/income' has become a more common reason for applying but this is one area where we may be seeing strict application of the rules around 'ongoing needs'. Sanctions were also associated with a reduced likelihood of an award.
Repeat applicants were less likely to receive a Crisis Grant award compared with new applicants. Online applicants were less likely than telephone applicants to receive an award while those applying face-to-face or by post were not significantly different from telephone applicants in terms of their success. Those having help to apply were not more likely to receive an award but those with a third-party applying were more likely to get an award than those applying alone. Having a longer waiting time was associated with lower likelihood of an award, while applying in March was more likely to lead to an award than applying in January.
Reasons for applying that were associated with a greater likelihood of receiving an award were – having an unexpected expense (the reference category), being stranded away from home without any means to get back, a fire or gas explosion and a delay in payment of benefits. The reasons less likely to result in an award were benefit/income being spent, lost money, stolen money, breakdown of relationship within family and having nowhere to stay, as well as flooding, or 'other' disaster and travel.
Household type, age and gender were all significant in the Crisis Grant model, with single adults more likely to receive an award compared with couples and families, females less likely to get an award compared with males and award likelihood being higher with age. Social renters had a greater likelihood of receiving a Crisis Grant than others, particularly those in institutional/homeless settings.
Referrals associated with a greater likelihood of success in receiving a Crisis Grant included those to housing, employability and men's advice while referrals associated with less likely success were to welfare rights, food banks, social work, resilience support, advocacy and hospital.
In summary, as with the model for Community Care Grants, Crisis Grant awards are strongly related to vulnerability but there is also an indication of those in receipt of benefits and others deemed ineligible being more likely to be referred elsewhere. Local authority is also significant, independent of the vulnerability characteristics of applicants.
Successful and unsuccessful applicants over time
The regression models provide some insights into the variation between local authorities even when controlling for the vulnerability of applicants. The relatively high award success rates in some local authorities is not fully explained by variations in the profile of applicants, as these characteristics are controlled for in the model. However, as highlighted above, there will be other variation that is not in the model (some of which is explored in the qualitative research undertaken for this review).
The analysis above indicates the strong role of vulnerability and the reasons for applications in understanding successful applications. We can also look at change over time in some of these key measures to help understand changes in success over time. The detailed, bespoke analysis of the monitoring data below looks at applicants over time, referrals over time and amounts of awards over time. This was undertaken on the data up to and including 2020/21 as this corresponded to the latest published annual report at that time.
As highlighted earlier, award success rates for both Community Care Grants and Crisis Grant had been reducing over recent years, pre-pandemic, alongside a change in reasons towards households in exceptional needs. However, the regression analysis suggests that the most vulnerable households, including homeless people, those with mental health issues, those fleeing domestic abuse and vulnerable lone parents were more likely to receive an award.
Single adults and single parents have been the largest groups of successful and unsuccessful Community Care Grant applicants since the SWF started (Figure 29). However, although single parents made up the same proportion of successful applicants – 52% – in 2013/14 and 2020/21, single parents were a far larger proportion of unsuccessful applicants in 2020/21 (31%, compared with 19% in 2013/14).
Single people without children now make up a smaller proportion of unsuccessful applicants than previously. In 2013/14 single people were 58% of unsuccessful applicants compared with 48% in 2020/21.
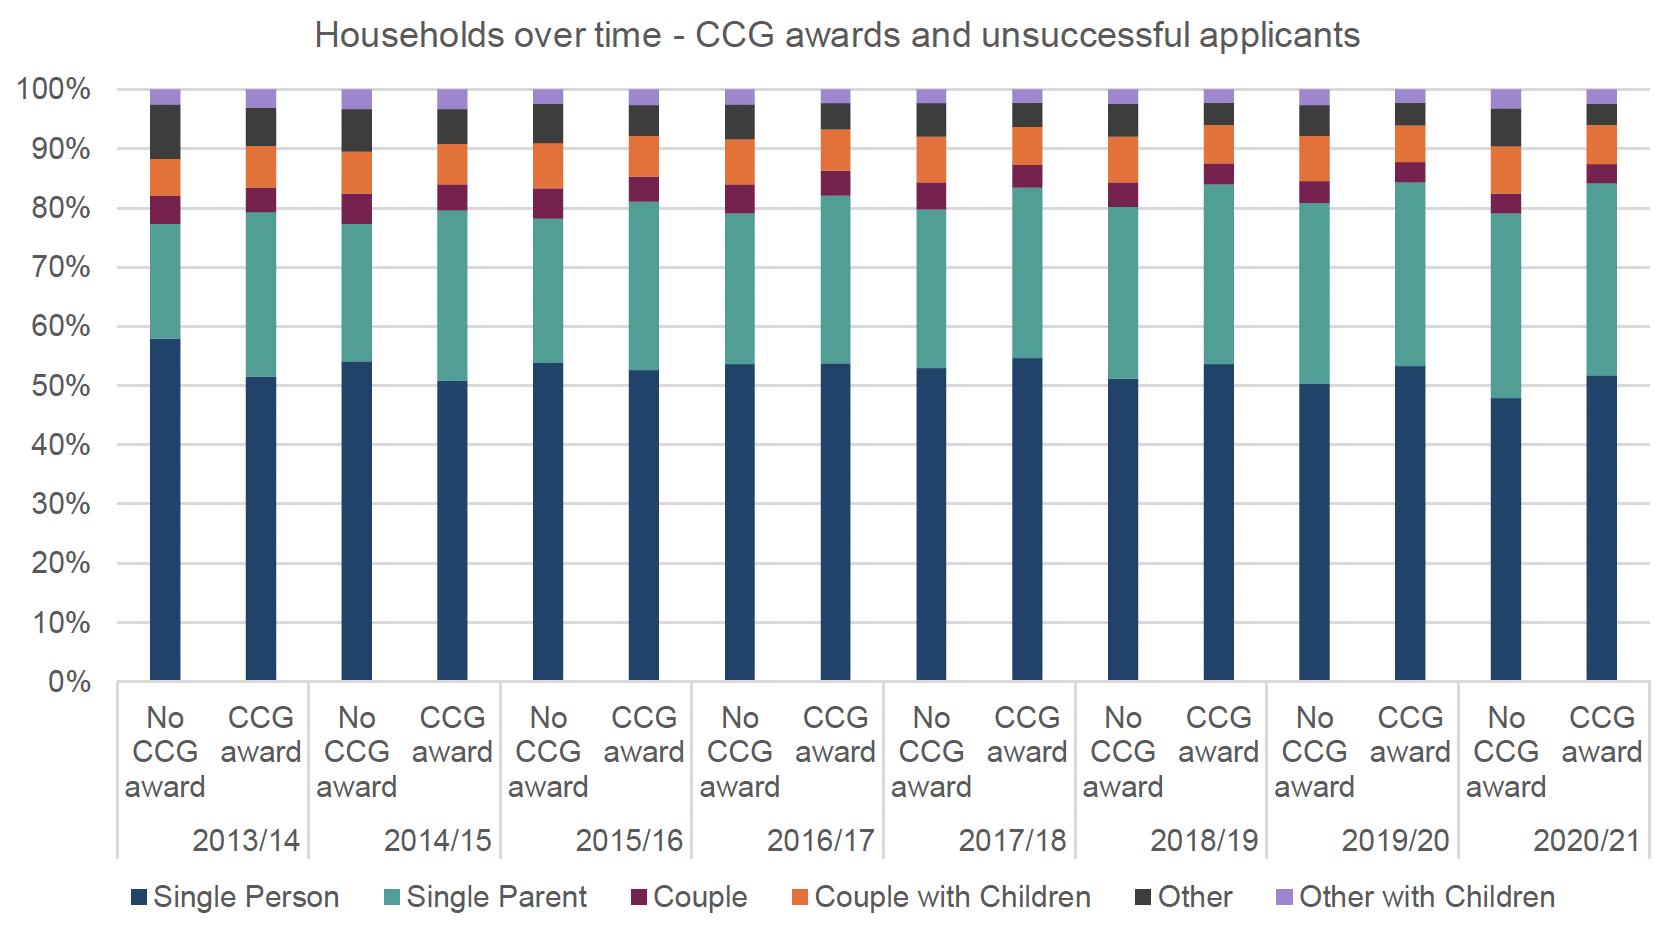
Source: SWF management database 2013/14 to 2020/21
For Crisis Grants, there has been a slight shift between single people and single parents, with single parents now making up around a quarter of those receiving Crisis Grant awards and the same proportion of unsuccessful applicants, whereas in 2013/14 single parents were 14% of unsuccessful applicants and 19% of recipients of Crisis Grants. In 2020/21, single parents made up a slightly larger proportion receiving Crisis Grants (26%) than not receiving (24%).
In 2013/14 single people received around 60% of awards and made up 60% of unsuccessful applicants, but this proportion was down to 54% of both those receiving and those not receiving an award in 2020/21 (down from 57%-58% in 2019/20).
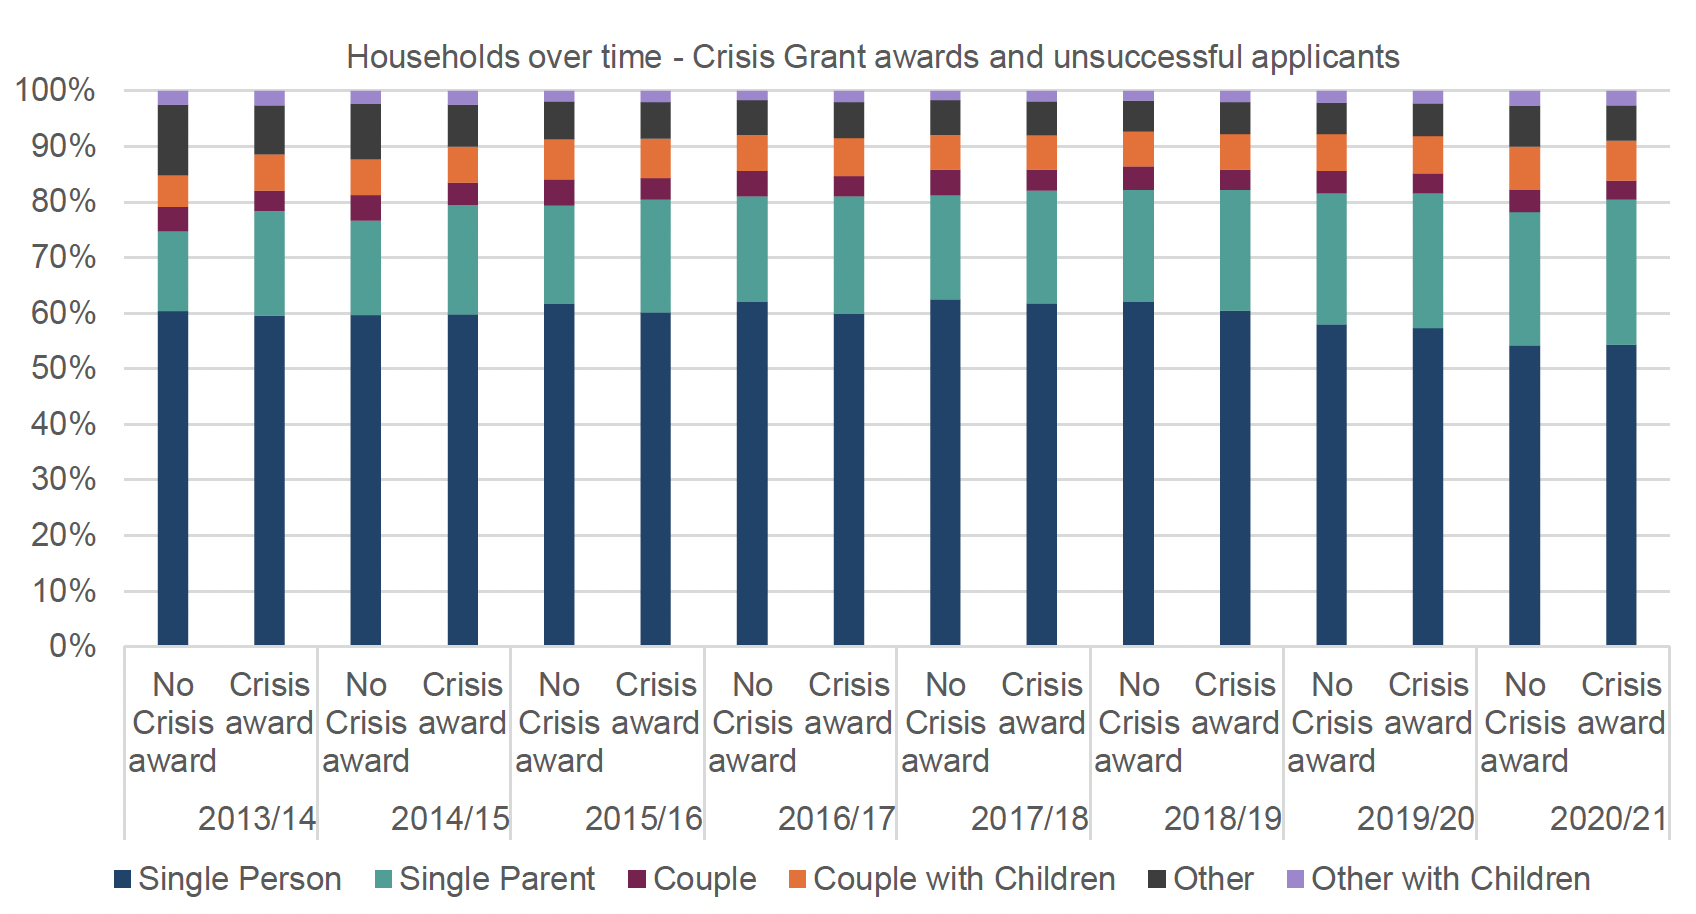
Source: SWF management database 2013/14 to 2020/21
As highlighted in the regression analysis, award recipients are more likely to have vulnerabilities compared with those not receiving an award. Around two-thirds of Community Care Grant recipients reported a vulnerability during their application in 2019/20 and 2020/21 compared with just a quarter of recipients in 2013/14. Of course, this may well have been due to less reporting/recording of vulnerability initially. By 2015/16 there was a broader range of vulnerability issues being captured in the monitoring data, with almost 4 out of 5 recipients reporting vulnerabilities. Since 2015/16 the proportion of those receiving an award and being vulnerable in some way has reduced by ten percentage points (22% had no vulnerabilities in 2015/16 and 32% in 2020/21).
Just under half of those who received a Crisis Grant in 2020/21 reported a vulnerability, compared with around 60% in 2015/16. This is similar to the ten percentage point drop in reported vulnerability in the case of Community Care Grant recipients. Around a third of those receiving no award were vulnerable in some way in 2020/21, which is also a slight reduction from previous years.
The reduced vulnerability of those receiving and not receiving awards in recent years, compared with previous years may help to explain some of the reduction in success rates over time. There are more applications now but proportionately fewer from vulnerable people.
| 2013/14 | 2014/15 | 2015/16 | 2016/17 | 2017/18 | 2018/19 | 2019/20 | 2020/21 | |||||||||
|---|---|---|---|---|---|---|---|---|---|---|---|---|---|---|---|---|
| No CCG | CCG | No CCG | CCG | No CCG | CCG | No CCG | CCG | No CCG | CCG | No CCG | CCG | No CCG | CCG | No CCG | CCG | |
| Mental health issues | 3% | 7% | 11% | 21% | 19% | 32% | 21% | 32% | 20% | 31% | 21% | 32% | 21% | 33% | 21% | 34% |
| No vulnerabilities | 88% | 76% | 79% | 51% | 58% | 22% | 55% | 24% | 60% | 32% | 58% | 29% | 58% | 29% | 60% | 32% |
| Lone parent | 4% | 7% | 7% | 16% | 14% | 24% | 14% | 23% | 14% | 22% | 16% | 23% | 16% | 23% | 17% | 24% |
| Homelessness | 2% | 6% | 3% | 12% | 6% | 20% | 6% | 22% | 9% | 25% | 9% | 25% | 7% | 23% | 7% | 22% |
| Chronic ill health | 1% | 4% | 7% | 16% | 15% | 27% | 14% | 24% | 12% | 22% | 12% | 21% | 10% | 19% | 7% | 16% |
| Physical health issues | 4% | 6% | 5% | 10% | 8% | 13% | 8% | 12% | 7% | 11% | 7% | 11% | 6% | 11% | 6% | 10% |
| Frail, old age, immobility | 1% | 1% | 2% | 6% | 4% | 11% | 5% | 10% | 4% | 9% | 4% | 8% | 4% | 9% | 4% | 8% |
| Children in a large family | 1% | 2% | 2% | 4% | 4% | 6% | 4% | 6% | 4% | 5% | 4% | 6% | 4% | 6% | 5% | 6% |
| Family breakdown | 1% | 2% | 1% | 2% | 2% | 4% | 2% | 5% | 2% | 5% | 3% | 6% | 3% | 6% | 4% | 6% |
| Learning difficulty | 1% | 1% | 2% | 4% | 4% | 6% | 4% | 6% | 3% | 5% | 4% | 5% | 4% | 6% | 4% | 5% |
Source: SWF management database 2013/14 to 2020/21
Looking in more detail at the nature of vulnerabilities recorded, the most commonly reported issues among those applying for Community Care Grants are mental health issues, reported by around a third of Community Care Grant recipients in 2019/20 (34% in 20/21) and around 21% of those not receiving an award in the two most recent years. This is similar to previous years since about 2015/16.
Being vulnerable as a lone parent was reported by 23% of successful Community Care Grant applicants in 2019/20 and 24% in 2020/21 (compared with 16%-17% of non-recipients). Homelessness affects over 1 in 5 award recipients compared with less than 1 in 10 non-recipients. Homeless households have been around 1 in 5 recipients since 2015/16.
Chronic ill health, physical ill health and frailty affect between 1 in 10 and 1 in 5 successful Community Care Grant award recipients (with less than half this proportion of non-recipients affected). In the case of chronic ill health, this has affected around a quarter of recipients in previous years (27% in 2015/16 and 24% in 2016/17). This reduction from 24% of awards to 19% of awards in 2019/20 (pre-pandemic) and 16% in 2020/21 has not been accompanied by an increase in the proportion of chronically ill non-recipients, though, suggesting that total applications among this particular physically vulnerable group have fallen in recent years as a proportion of the total.
However, the total number of Community Care Grant applications from physically ill or disabled applicants in general has been increasing in recent years but is below the peak level recorded in 2015/16. The figure below shows the number of applicants recorded as vulnerable due to physical disabilities (frailty, old age, mobility issues, physical health problems, chronic ill-health, being terminally ill, having learning difficulties or disabled people with children) as well as mental health issues or addictions. At the same time, the number of Community Care Grant applications from people with mental health issues or addictions has increased more steeply, and has overtaken the number with physical health issues or disabilities in recent years.
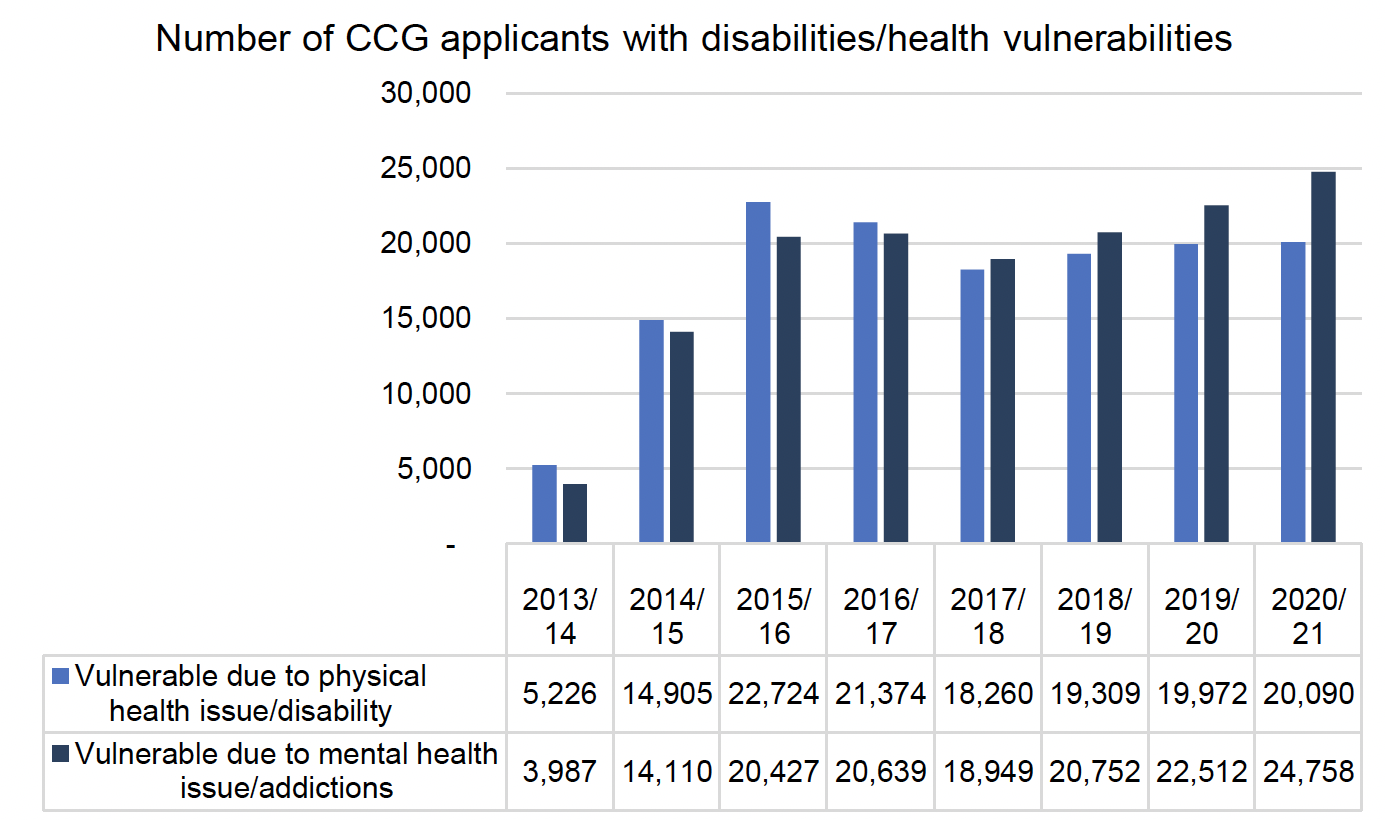
Source: SWF management database 2013/14 to 2020/21
Looking at the nature of vulnerabilities among those receiving and not receiving Crisis Grants, almost a third of those in receipt of a Crisis Grant in 2020/21 had mental health problems compared with 12% of those who applied but did not receive an award. This has remained an important aspect of vulnerability since 2014/15. Lone parents also increased from 5% of those in receipt of Crisis Grant awards in 2013/14 to 10% in 2014/15 and 16% in 2015/16. In 2020/21 18% of recipients were vulnerable due to being a lone parent.
| 2013/14 | 2014/15 | 2015/16 | 2016/17 | 2017/18 | 2018/19 | 2019/20 | 2020/21 | |||||||||
|---|---|---|---|---|---|---|---|---|---|---|---|---|---|---|---|---|
| No CG | CG | No CG | CG | No CG | CG | No CG | CG | No CG | CG | No CG | CG | No CG | CG | No CG | CG | |
| No vulnerabilities | 88% | 81% | 82% | 61% | 68% | 41% | 62% | 39% | 62% | 42% | 64% | 42% | 65% | 45% | 68% | 50% |
| Mental health issues | 3% | 8% | 5% | 21% | 9% | 30% | 10% | 32% | 10% | 31% | 11% | 31% | 12% | 30% | 12% | 27% |
| Lone parent | 0% | 5% | 0% | 10% | 0% | 16% | 0% | 16% | 0% | 15% | 0% | 16% | 0% | 17% | 0% | 18% |
| Children w disabled adult | 0% | 3% | 1% | 12% | 1% | 18% | 1% | 18% | 1% | 18% | 1% | 16% | 2% | 13% | 2% | 10% |
| Family breakdown | 0% | 2% | 1% | 5% | 1% | 9% | 1% | 9% | 1% | 9% | 2% | 9% | 2% | 8% | 3% | 6% |
| Physical health | 3% | 4% | 4% | 5% | 4% | 6% | 5% | 6% | 5% | 5% | 5% | 5% | 4% | 5% | 4% | 5% |
| Care giver | 0% | 1% | 0% | 2% | 0% | 4% | 0% | 4% | 0% | 3% | 0% | 4% | 1% | 4% | 1% | 4% |
| Kinship Carer | 0% | 1% | 0% | 3% | 0% | 4% | 0% | 4% | 0% | 3% | 0% | 3% | 0% | 3% | 0% | 3% |
| Insecure work | 0% | 2% | 0% | 5% | 0% | 7% | 0% | 7% | 1% | 6% | 1% | 5% | 0% | 4% | 1% | 3% |
| Eviction | 0% | 1% | 0% | 1% | 0% | 2% | 0% | 2% | 0% | 2% | 0% | 3% | 0% | 3% | 0% | 3% |
Source: SWF management database 2013/14 to 2020/21
Households that were vulnerable due to children living with a disabled adult made up 12% of Crisis Grant recipients in 2014/15, increasing to 18% in subsequent years, before falling back to 13% in 2019/20 and then 10% in 2020/21. The prevalence of these households among non-recipients has increased, but only slightly – from 0.4% to 2%. This may indicate that proportionately fewer families containing people with disabilities are applying for Crisis Grants.
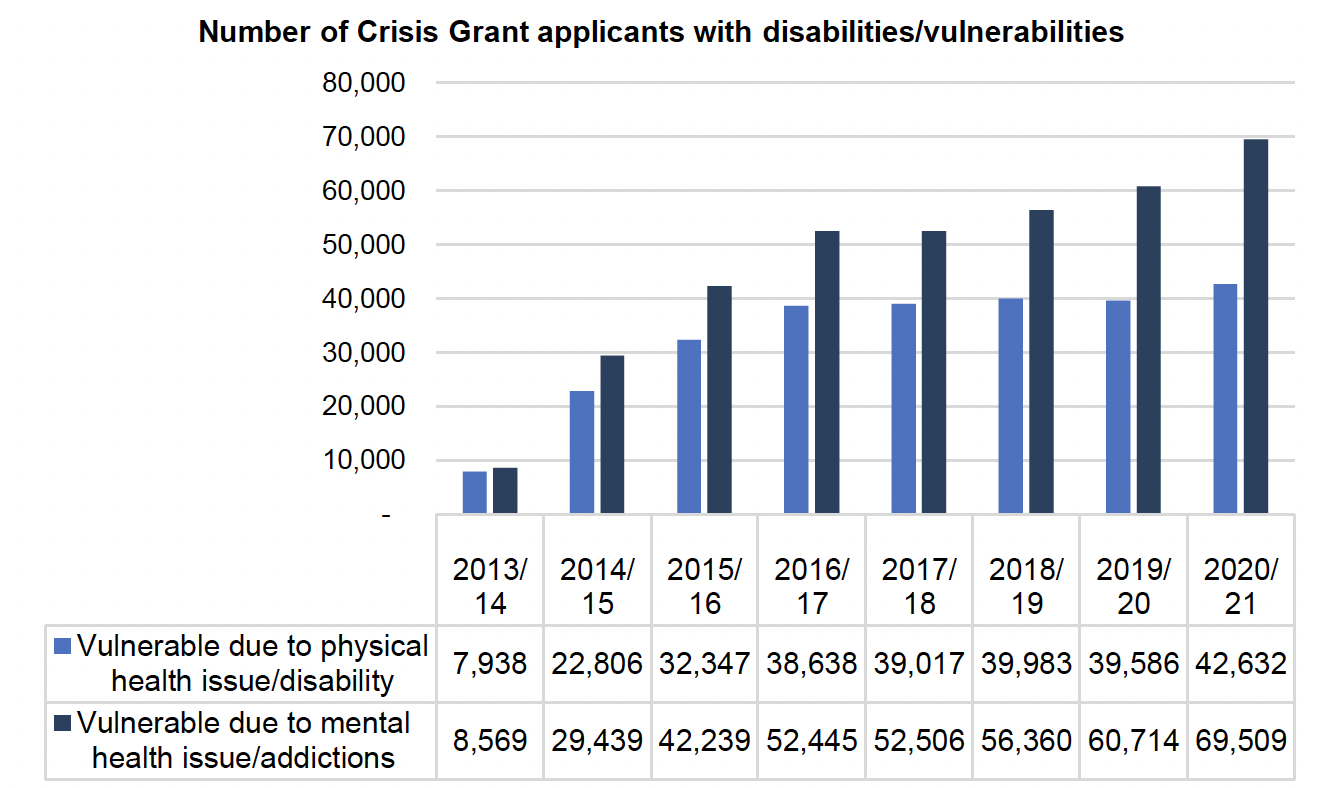
Source: SWF management database 2013/14 to 2020/21
The figure above shows that, as with Community Care Grants, the overall number of applications for Crisis Grants by those with physical health vulnerabilities is increasing slightly but at a far less significant rate compared with those with mental health issues or addictions.
For both Community Care Grants and Crisis Grants, applications from people with mental health issues have overtaken applications from people with physical health issues and disabilities and tend to consistently affect around 30% of applicants.
This, alongside the reduced prevalence in recent years of those with chronic physical health problems among Community Care Grant recipients points to a nuanced picture around health and disability. Overall applications to both funds from people with physical health issues and disabilities are increasing and these applicants are more commonly successful in receiving awards, but the applications from other groups are also increasing at such a rate that people with physical health issues are now less prevalent as a proportion of fund applicants and recipients.
Levels of award
As we saw above, vulnerable applicants are more likely to receive awards but the overall level of vulnerability of applicants has decreased and the proportion of all applicants receiving awards has fallen. We now consider the extent to which there is variation in the financial level of awards in relation to local authority, reasons for application and vulnerability – the key indicators of successful awards identified earlier – and how award levels have changed over time. As in the case of the earlier, bespoke analysis, this was completed on data comparable with the most up-to-date annual report, prior to the publication of the 2021/22 report.
Source: SWF management database 2013/14 to 2020/21
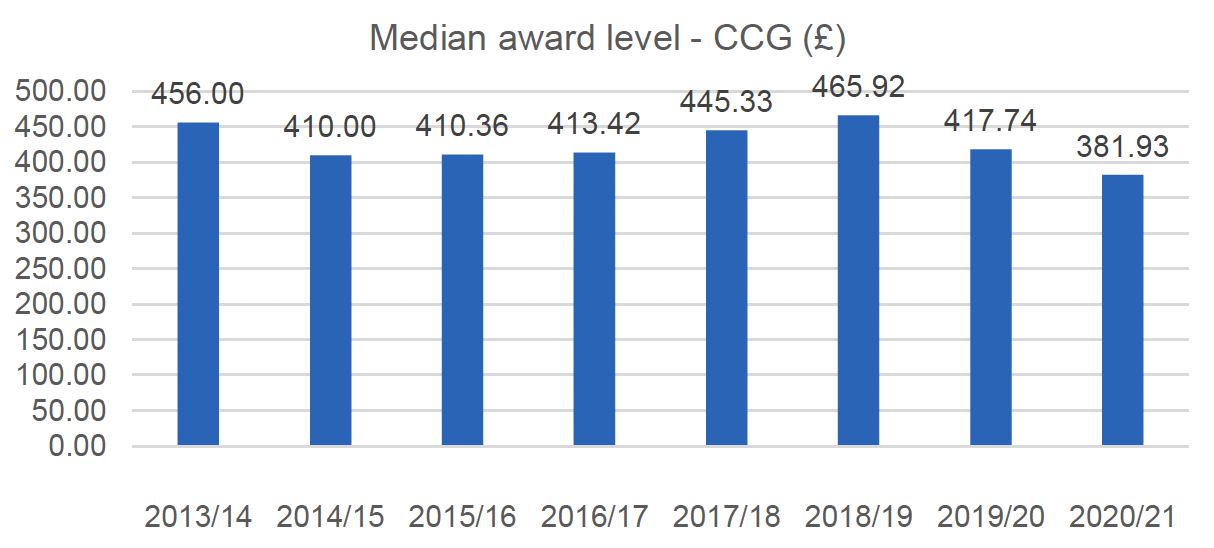
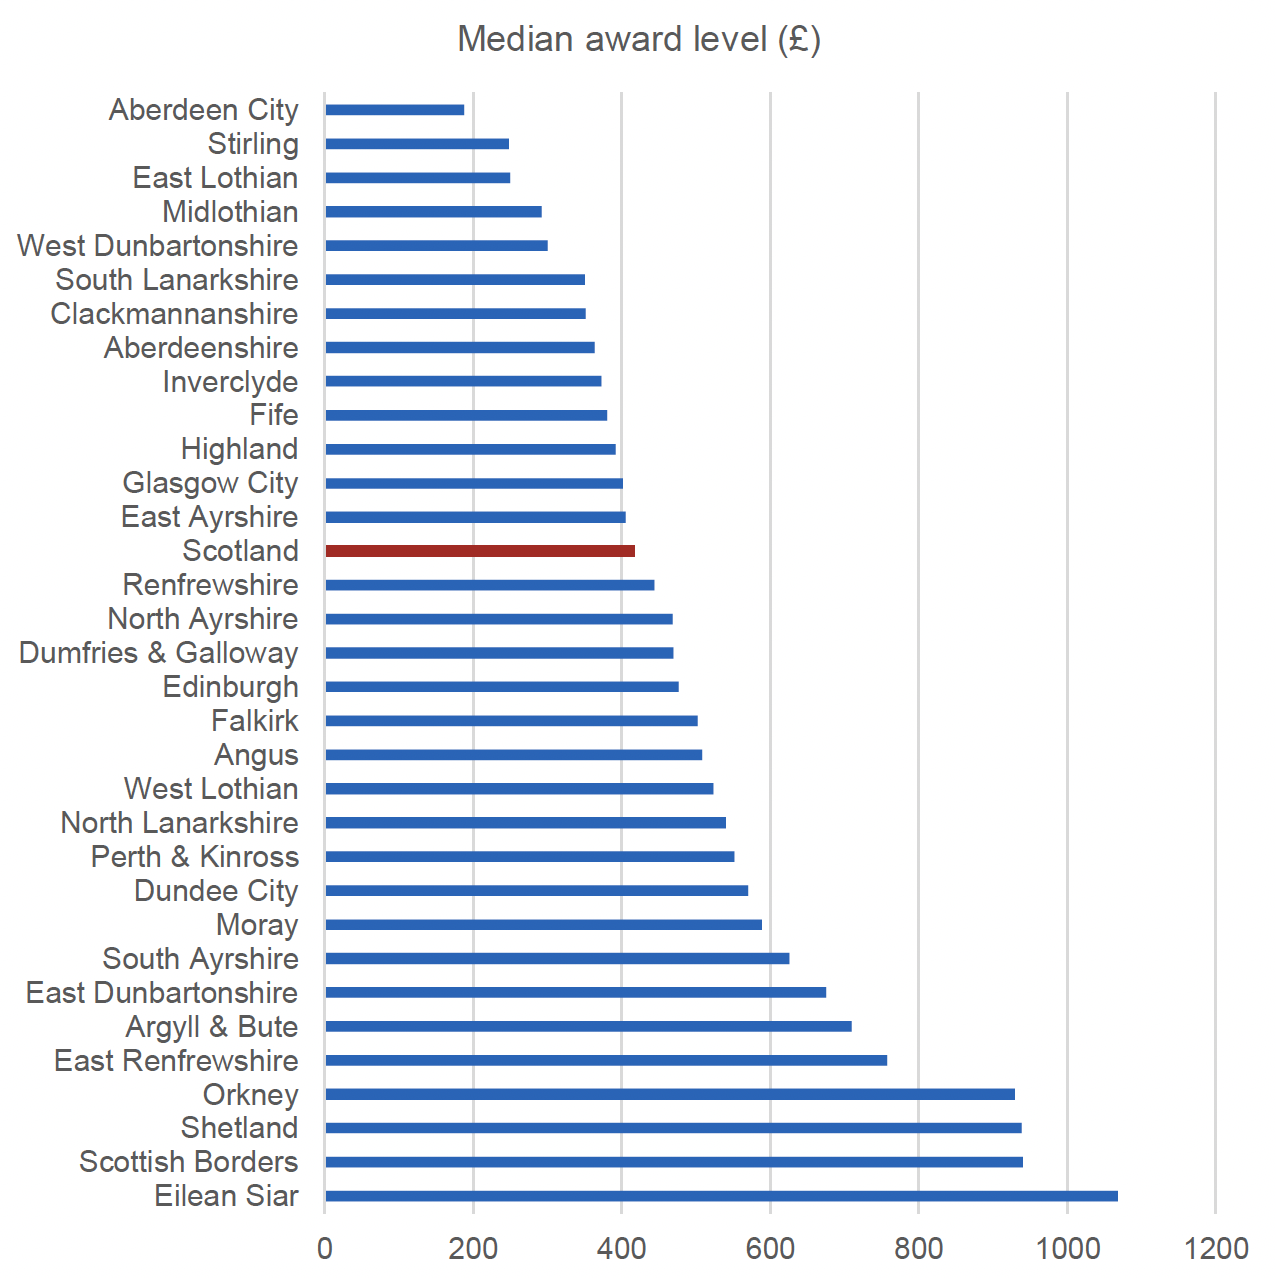
The median award level (the point at which 50% of awards are above and below) for Community Care Grant has decreased over time, with an average award in 2019/20 of £417.74 and £381.93 in 2020/21, compared with £456.00 in 2013/14. There was also a huge variation by local authority pre-pandemic from a high of £1,067.92 in Eilean Siar to a low of £188.13 in Aberdeen.
Source: SWF management database
This variation is strongly related to the reason for applying for a Community Care Grant – in Eilean Siar, 40% of awards were to help applicants with 'planned resettlement after an unsettled way of life' so include larger items of expenditure. This applied to 35% of awards in the Scottish Borders, 28% of awards in the Shetland Islands and 43% of awards in the Orkney Islands, compared with 16% of all the Community Care Grant awards in 2019/20.
At the other end of the spectrum, in Aberdeen, just 12% of awards were for people resettling after an unsettled way of life. This was not the case in Stirling, where 27% of awards were for this reason but 39% of awards were to help with expenses for improving a home to maintain living conditions (compared with 12% of all awards). More than 60% of awards in East Lothian were for families under exceptional pressure for 'other reasons' (compared with 26% of all awards). Midlothian also had a higher number of awards to help with expenses for improving a home to maintain living conditions (28%).
Those with higher average awards – the island communities, the Scottish Borders, East Renfrewshire and Argyll and Bute were also those underspending on budgets pre-pandemic, with the exception of the Shetland Islands. This suggests that those who generally underspend have more money to make more generous awards.
On balance, the variation in Community Care Grants by local authority appears to be strongly relate to the reason for the application, which also relates to the type of vulnerability, as shown below.
Source: SWF management database
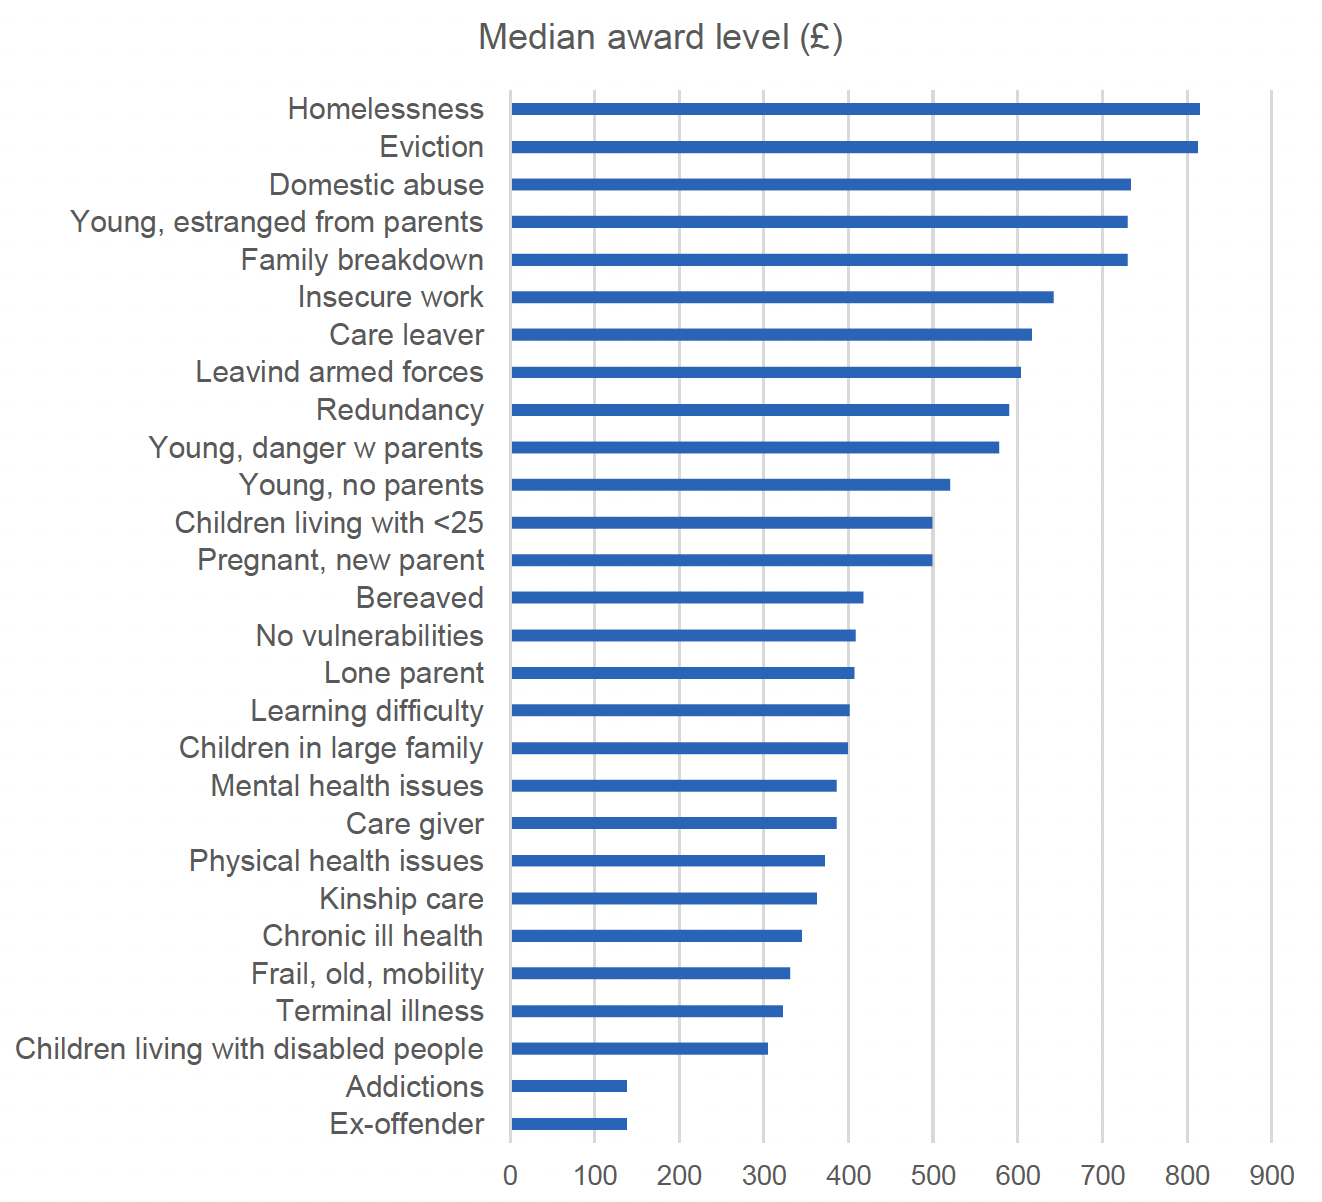
The level of the Community Care Grant award received was higher for more vulnerable households where accommodation has been lost through homelessness or eviction, or where there is domestic abuse or estrangement, a family/relationship breakdown, leaving the armed forces or care or insecure work/redundancy. Those with physical health issues or disabilities tended to receive smaller awards.
Again, this indicates that awards are larger where new households are being formed or new accommodation needed as opposed to existing households being under pressure. This also helps explain why average awards have decreased over time - as the share of applications has shifted towards families facing exceptional pressure from moving out of residential accommodation/resettlement after an unsettled way of life, average awards have reduced.
Source: SWF management database
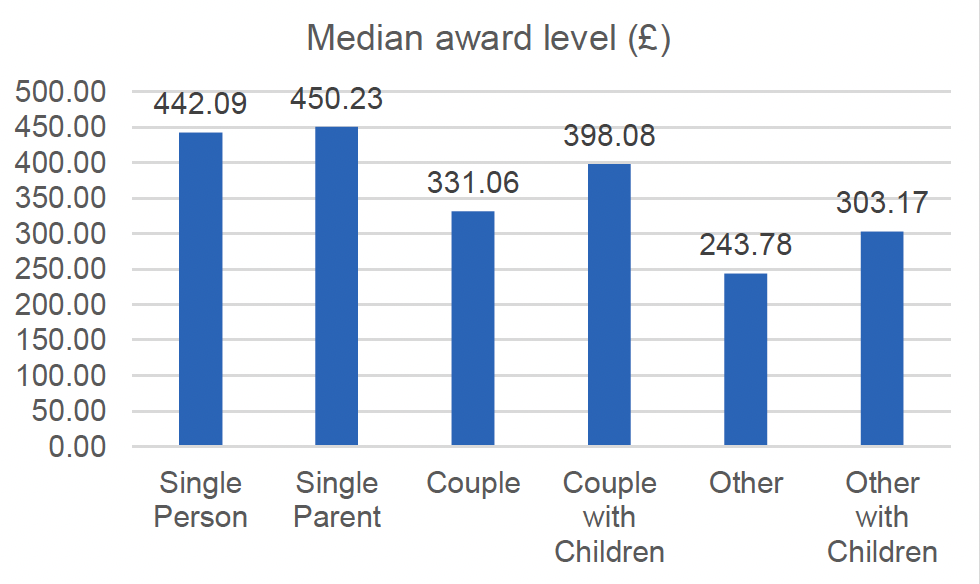
Looking at household type, Community Care Grant awards in 2019/20 were higher for single people and single parents than for other types of households. This is also associated with the need for new accommodation, with 28% of single person awards to vulnerable homeless people and single parents more vulnerable due to domestic abuse (in 7% of awards) and relationship breakdown (9%) as well as homelessness (19%).
Source: SWF management database 2013/14 to 2020/21
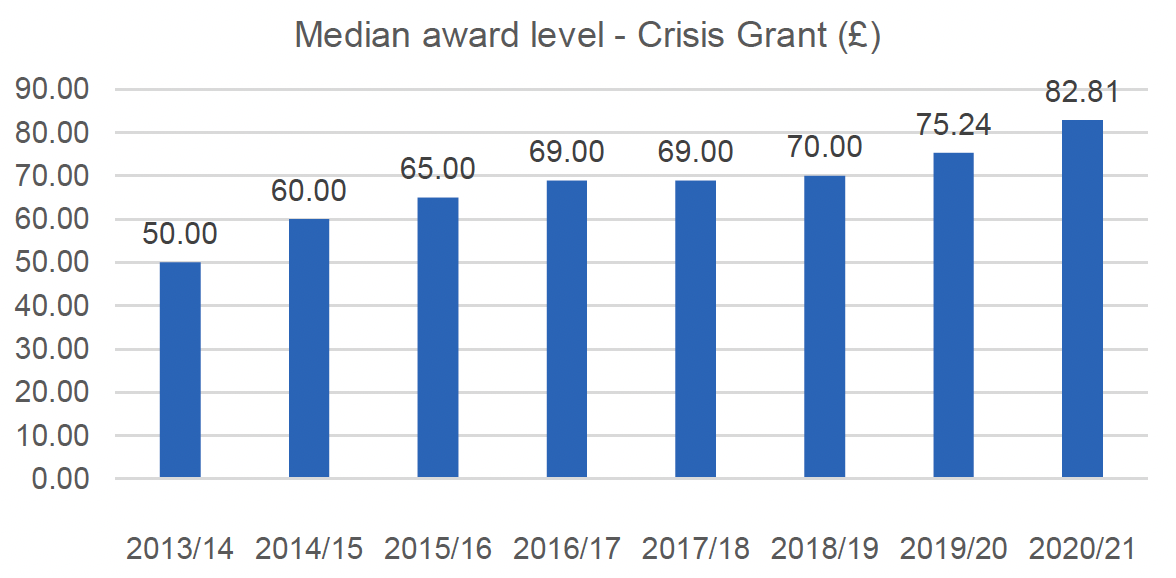
The median level of the Crisis Grant awarded has increased from £50 in 2013/14 to £82.81 in 2020/21, with £75.24 the median pre-pandemic award.
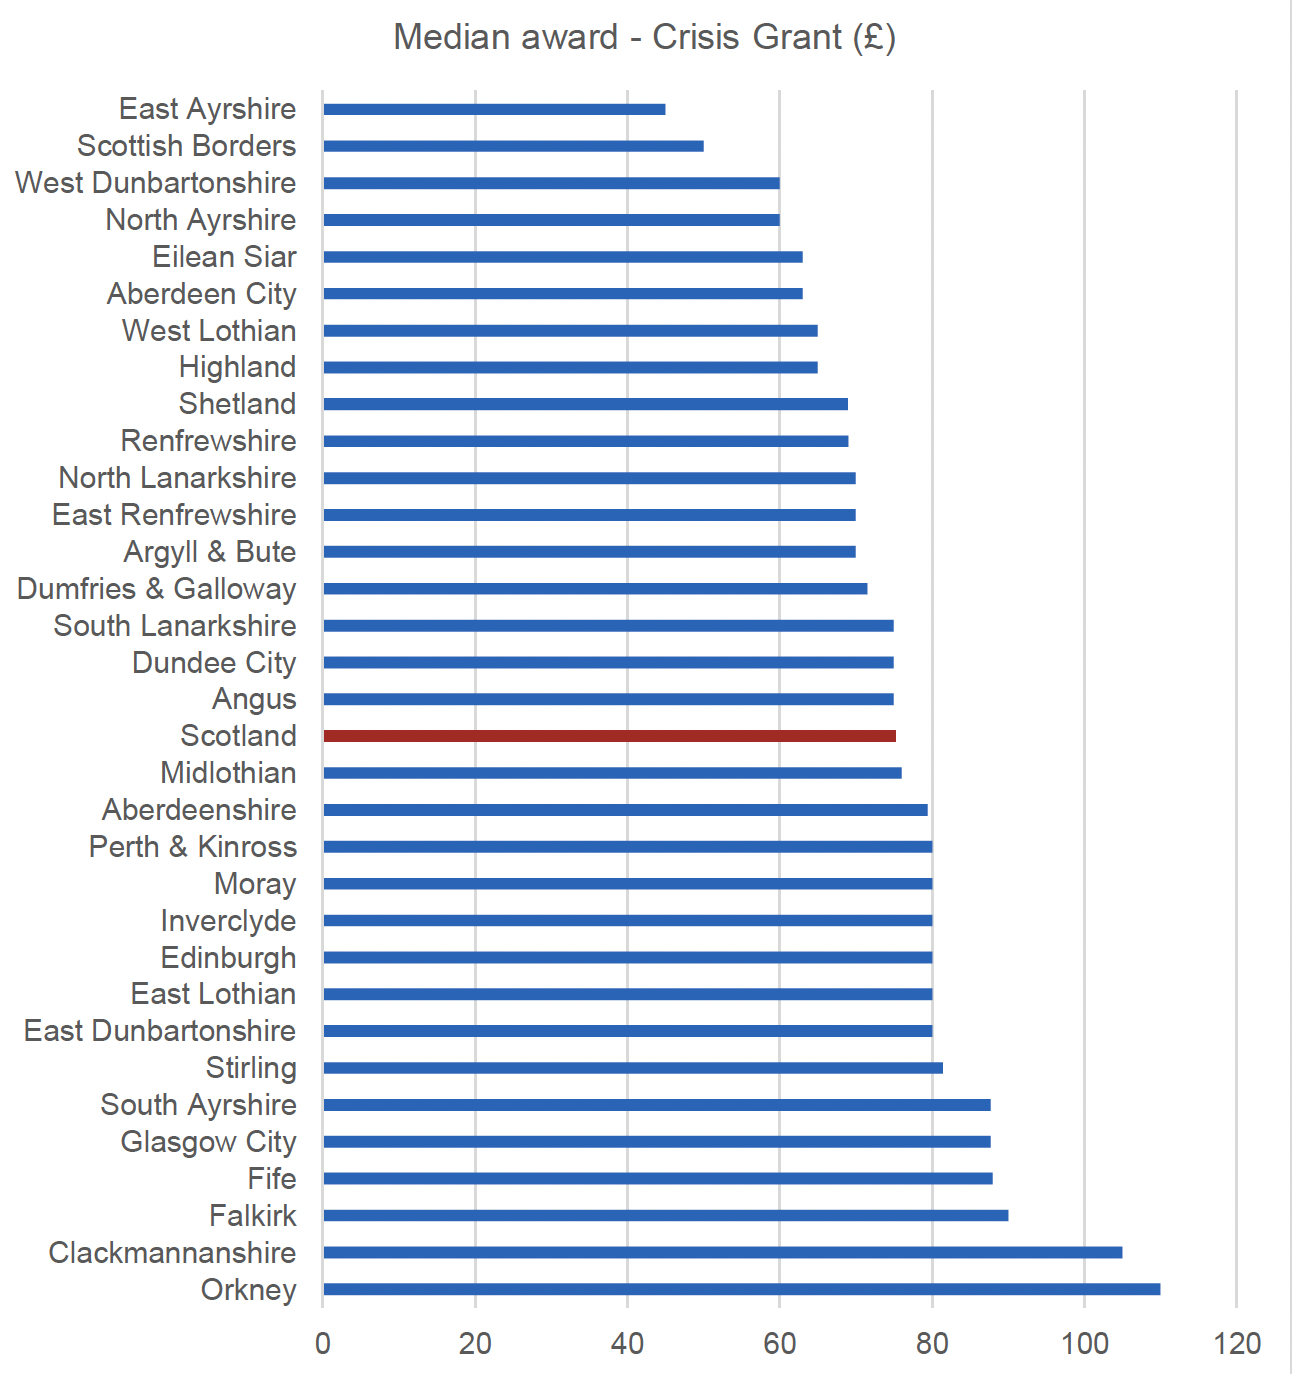
Again, looking at the latest pre-pandemic period, there is variation between local authorities in relation to the median level of the award, although less so than for Community Care Grants.
Source: SWF management database
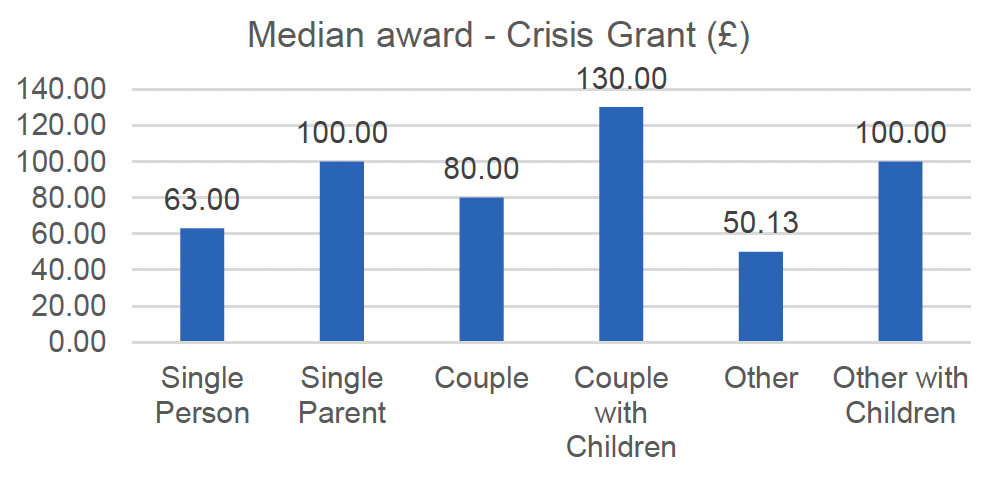
Awards were higher among households with children, which may help in explaining the local authority pattern of awards. For example, awards were higher than average in Clackmannanshire, where 32% of Crisis Grant recipients were single parents (compared with 24% across Scotland). However, 63% of Orkney award recipients were single people compared with 57% of all applicants. East Ayrshire and the Scottish Borders also had a higher than average proportion of single adult recipients (66% and 70% of awards) which may partly explain their relatively lower award levels.
Source: SWF management database
Higher average awards for Crisis Grants tended to be spread across overspending local authorities (Glasgow, Fife, Clackmannanshire, Stirling) as well as underspending authorities (Orkney, Falkirk, South Ayrshire). This is different than was the case for Community Care Grants, where we saw higher awards in underspending local authorities.
Source: SWF management database
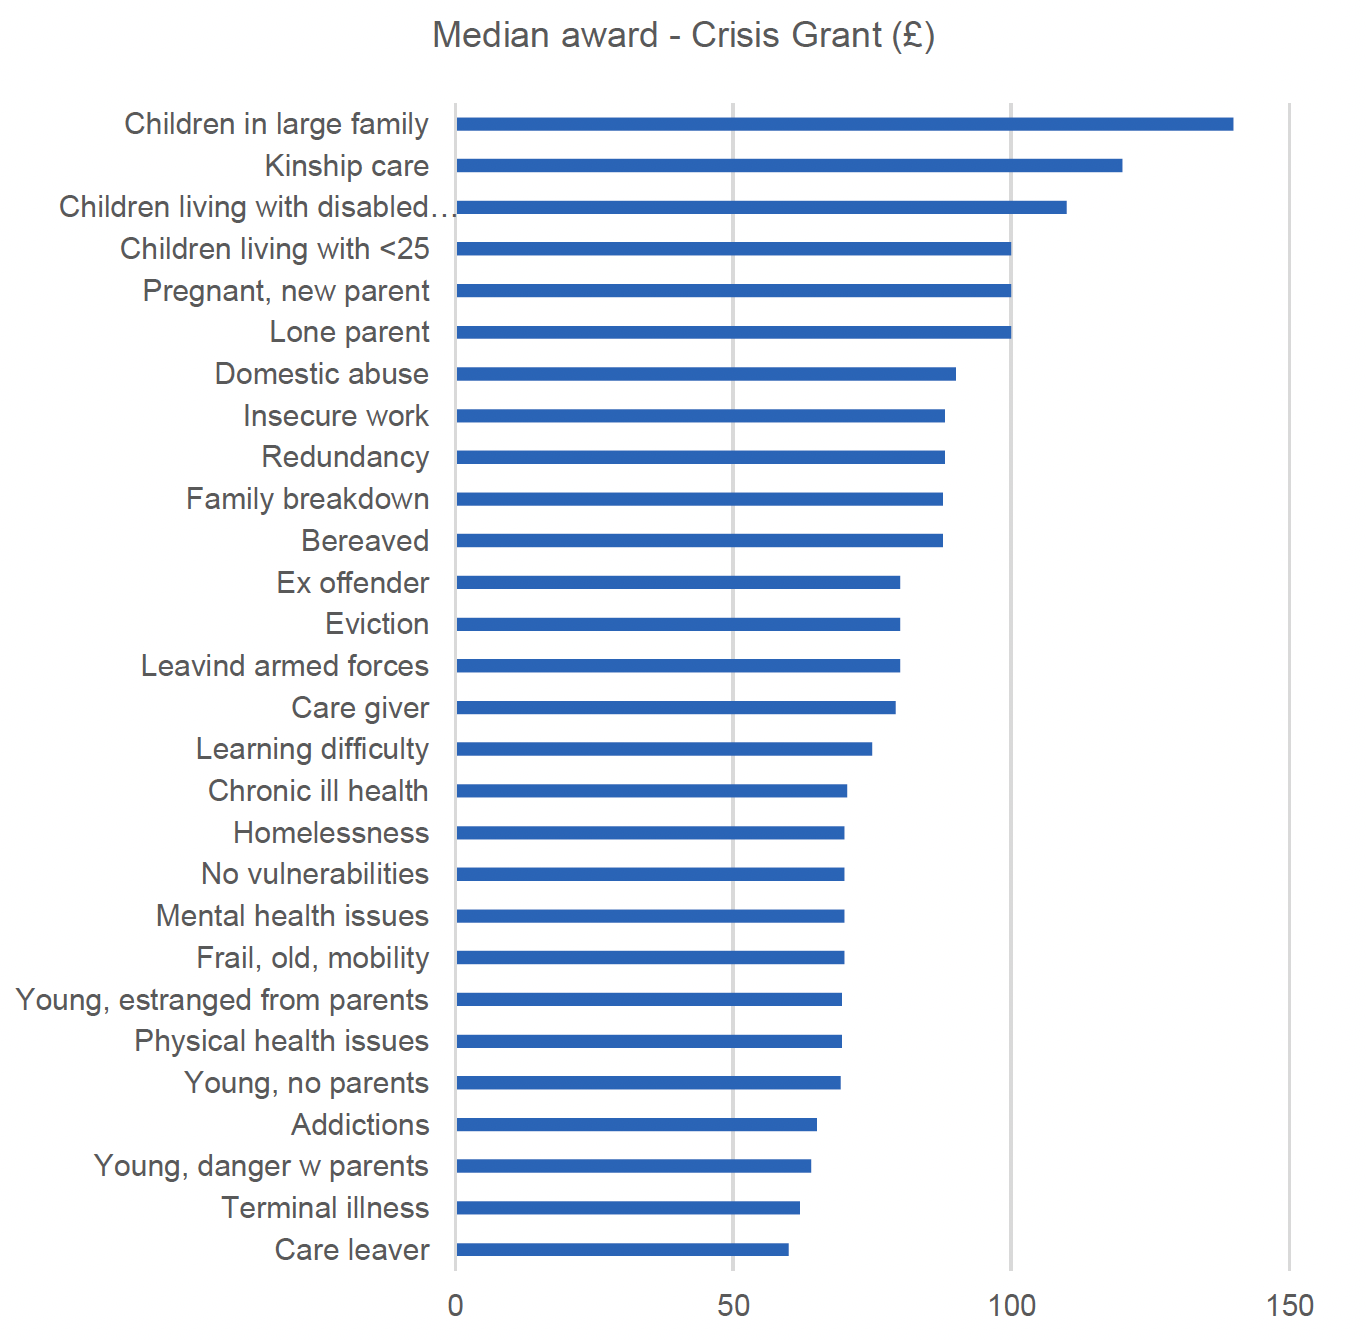
Vulnerability is also associated with Crisis Grant award levels but with higher average awards largely driven by household size and the presence of children in the household, followed by vulnerability associated with sudden income shocks – fleeing domestic abuse, insecure work, redundancy, family breakdown, bereavement. Households with primarily health-related vulnerabilities and young people appear to receive lower awards, generally most likely due to the smaller household size.
Overall, there is evidence that reduced vulnerability may have impacted on success rates and potentially award levels. However, regression analysis indicates that success rates are impacted by local authority independently of vulnerability.
One aspect of vulnerability not captured well in the data is no recourse to public funds (NRPF). Several local authorities had no data on refugee status and this is not a separate category of vulnerability. From the data available, in 2019/20 (pre-pandemic) 0.9% of Community Care Grant applicants had an 'other' refugee status (so not seeking asylum and not with leave to remain) as were 0.4% of applicants to Crisis Grants. Some of this small group did receive awards – 40% applying for Community Care Grants and 56% applying for Crisis Grants. This is significantly below the overall success rates of 54% and 63% respectively. However, with so much missing data this is an incomplete picture.
Referral to other services
The evidence above shows that, although vulnerability has reduced in recent years, many applicants and recipients are still vulnerable. Application success rates have also fallen in recent years, pre-pandemic and in the case of Community Care Grants the average levels of award have reduced. This means that referral to other services is becoming more important.
| 2013/14 | 2014/15 | 2015/16 | 2016/17 | 2017/18 | 2018/19 | 2019/20 | 2020/21 | |||||||||
|---|---|---|---|---|---|---|---|---|---|---|---|---|---|---|---|---|
| No CCG | CCG | No CCG | CCG | No CCG | CCG | No CCG | CCG | No CCG | CCG | No CCG | CCG | No CCG | CCG | No CCG | CCG | |
| None | 77% | 79% | 79% | 79% | 71% | 71% | 70% | 71% | 67% | 70% | 65% | 66% | 63% | 65% | 63% | 66% |
| Welfare rights | 14% | 12% | 11% | 10% | 11% | 12% | 14% | 13% | 17% | 15% | 17% | 17% | 18% | 18% | 18% | 18% |
| Money manage | 10% | 8% | 7% | 6% | 11% | 8% | 11% | 9% | 12% | 9% | 15% | 11% | 17% | 12% | 18% | 11% |
| CAB | 7% | 5% | 5% | 5% | 9% | 8% | 10% | 8% | 12% | 9% | 13% | 11% | 14% | 11% | 15% | 11% |
| Housing | 12% | 13% | 8% | 12% | 11% | 15% | 11% | 14% | 11% | 12% | 8% | 8% | 7% | 8% | 6% | 8% |
| Employ-ability | 7% | 8% | 4% | 7% | 5% | 8% | 5% | 7% | 5% | 7% | 3% | 8% | 3% | 8% | 3% | 8% |
| Pension Service | 4% | 7% | 4% | 7% | 4% | 8% | 5% | 7% | 5% | 7% | 3% | 8% | 3% | 8% | 3% | 8% |
| Other | 8% | 5% | 3% | 3% | 6% | 5% | 6% | 6% | 8% | 6% | 8% | 7% | 7% | 7% | 6% | 6% |
| Social Work | 6% | 5% | 3% | 4% | 8% | 7% | 7% | 7% | 5% | 5% | 6% | 6% | 8% | 7% | 8% | 6% |
| Debt advice | 2% | 2% | 3% | 2% | 6% | 4% | 6% | 4% | 7% | 4% | 9% | 5% | 11% | 5% | 12% | 5% |
Source: SWF management database 2013/14 to 2020/21
Overall, at Scotland level, the majority of Community Care Grant applicants (both successful and unsuccessful) are reported as not having received a referral on to other service providers. However, this has fallen from almost 80% recorded as receiving no onward referrals in 2013/14 to closer to 65% in 2019/20 and 2020/21. So, around 20% received a referral in 2013/14 compared with 35% in 2019/20.
The most common referrals are for welfare rights – now referred to in 18% of Community Care Grant cases, whether there is an award or not. This is up from 12% of award recipients and 14% of non-recipients in 2013/14. Debt advice has also increased from 2% of unsuccessful applicants referred in 2013/14 to 12% in 2020/21.
Money management is also a common referral route, with 18% on those not receiving an award and 11% of those receiving a Community Care Grant being referred for budgeting advice (up from 10% and 8% in 2013/14). A similar proportion (12%) receiving no award are referred to debt advice while 5% of those who receive a Community Care Grant are referred. Unsuccessful applicants were more likely than successful applicants to be referred to Citizen's Advice Bureaux (CAB) – (15%) in 2020/21 compared with those receiving an award (10%). The same pattern is observed in relation to social work referrals, which were more common for unsuccessful applicants. Those receiving a Community Care Grant were more commonly referred to the Pension Service, for employability advice and for housing advice compared with non-recipients.
Table 6: The most common referrals for Crisis Grants among those who received an award (CG) and those who did not (No CG) (2013/14 to 2020/21)
| 2013/14 | 2014/15 | 2015/16 | 2016/17 | 2017/18 | 2018/19 | 2019/20 | 2020/21 | |||||||||
|---|---|---|---|---|---|---|---|---|---|---|---|---|---|---|---|---|
| No CG | CG | No CG | CG | No CG | CG | No CG | CG | No CG | CG | No CG | CG | No CG | CG | No CG | CG | |
| None | 77% | 78% | 80% | 80% | 71% | 72% | 71% | 73% | 71% | 72% | 67% | 68% | 64% | 65% | 66% | 66% |
| Money manage | 14% | 13% | 7% | 8% | 10% | 11% | 10% | 11% | 11% | 12% | 15% | 17% | 18% | 19% | 18% | 19% |
| CAB | 8% | 6% | 5% | 4% | 8% | 8% | 8% | 8% | 8% | 10% | 10% | 14% | 13% | 17% | 14% | 16% |
| Debt advice | 3% | 3% | 3% | 3% | 6% | 7% | 6% | 7% | 6% | 8% | 8% | 12% | 12% | 15% | 12% | 15% |
| Welfare rights | 15% | 13% | 9% | 9% | 9% | 9% | 10% | 10% | 11% | 10% | 11% | 11% | 13% | 12% | 13% | 14% |
| Social Work | 8% | 7% | 3% | 3% | 6% | 7% | 5% | 8% | 5% | 8% | 6% | 9% | 8% | 9% | 7% | 8% |
| Other | 8% | 7% | 4% | 4% | 8% | 7% | 7% | 7% | 7% | 7% | 8% | 7% | 8% | 6% | 6% | 6% |
| Housing | 12% | 12% | 7% | 7% | 7% | 7% | 6% | 7% | 5% | 7% | 5% | 7% | 5% | 6% | 3% | 5% |
| Police | 6% | 5% | 0% | 0% | 2% | 2% | 1% | 1% | 2% | 3% | 2% | 4% | 3% | 4% | 3% | 3% |
| Employability | 8% | 7% | 5% | 3% | 4% | 2% | 3% | 2% | 3% | 2% | 3% | 2% | 3% | 2% | 4% | 2% |
Source: SWF management database 2013/14 to 2020/21
It is the same group of agencies discussed above in relation to Community Care Grants that received the most referrals for Crisis Grant applications, with the addition of the Police, with 3% of applicants being referred (to verify the theft of money, presumably). Although two third of Crisis Grant cases had no referrals in 2019/20 and 2020/21 (while a third did) this was again an improvement as around 4 out of 5 cases received no referrals previously (with 1 in 5 being referred). Referrals increased most for debt advice – up from 3% for both groups to 12% where there was no award and 15% where an award is made. CAB and money management also saw an increase in referrals while housing services have seen a decrease (from 12% to 3%-5%). There seems to be less difference in the pattern of referrals for recipients and non-recipients of Crisis Grants, compared with Community Care Grants (where more non-recipients were referred for money management advice, debt advice and to the CAB).
The scope to compare experiences by applicants in different local authorities is compromised by the fact that a number of areas report no referrals at all. It is not completely clear whether this reflects a complete absence of referrals, or differences in recording practices (i.e. some referrals are happening but are not included in the management data for these local authorities). However, in terms of recorded referrals, there are clear differences between local authorities, with some areas where recorded referrals are particularly high.
In 2019/20 (pre-pandemic), referrals for debt advice were high in Fife (72% of applications), East Dunbartonshire (72%) and Clackmannanshire (68%). Money management advice referrals were high in Eilean Siar (100%) Fife (72%) Clackmannanshire (68%) East Dunbartonshire (47%) and North Ayrshire (28%). Social Work referrals were also higher in East Dunbartonshire (87%) Fife (55%) and North Ayrshire (28%). DWP referrals were higher among Eilean Siar (100%) Fife (24.3%) and the Scottish Borders (14%).
Referrals to welfare rights advice were higher in East Renfrewshire (97%) Angus (83%) and East Dunbartonshire (66%). Referrals to food banks were highest in Angus (52%) and North Ayrshire (29%), with North Ayrshire commonly referring to advocacy services too (83%). Dumfries and Galloway and South Ayrshire referred across a wide range of agencies including money management, welfare rights and others.
The local authorities recording referrals in 1 in 4 cases or fewer were – Aberdeen, East Lothian, Glasgow, North Lanarkshire and Renfrewshire, the Scottish Borders, Stirling and West Lothian.
Those reporting referring 5% of cases or fewer were – Aberdeenshire, Argyll and Bute, East Ayrshire, Edinburgh, Falkirk, Highland, Midlothian, Moray, the Orkney Islands, Perth and Kinross, the Shetland Islands and West Dunbartonshire. Of course, this includes some locations with very favourable outcomes so the referral data is not showing the whole picture – in other words, it may be that areas with high success rates perceive a lower need for referrals, as the grant is seen to have resolved the issue that led to the application.
Enablers/barriers
Data on who accesses support in applying and how this might impact on the outcome is available from the management data. Although earlier we saw that around a third of applicants reported being vulnerable in some way, over 85% of applicants to the Scottish Welfare Fund apply by themselves, without help.
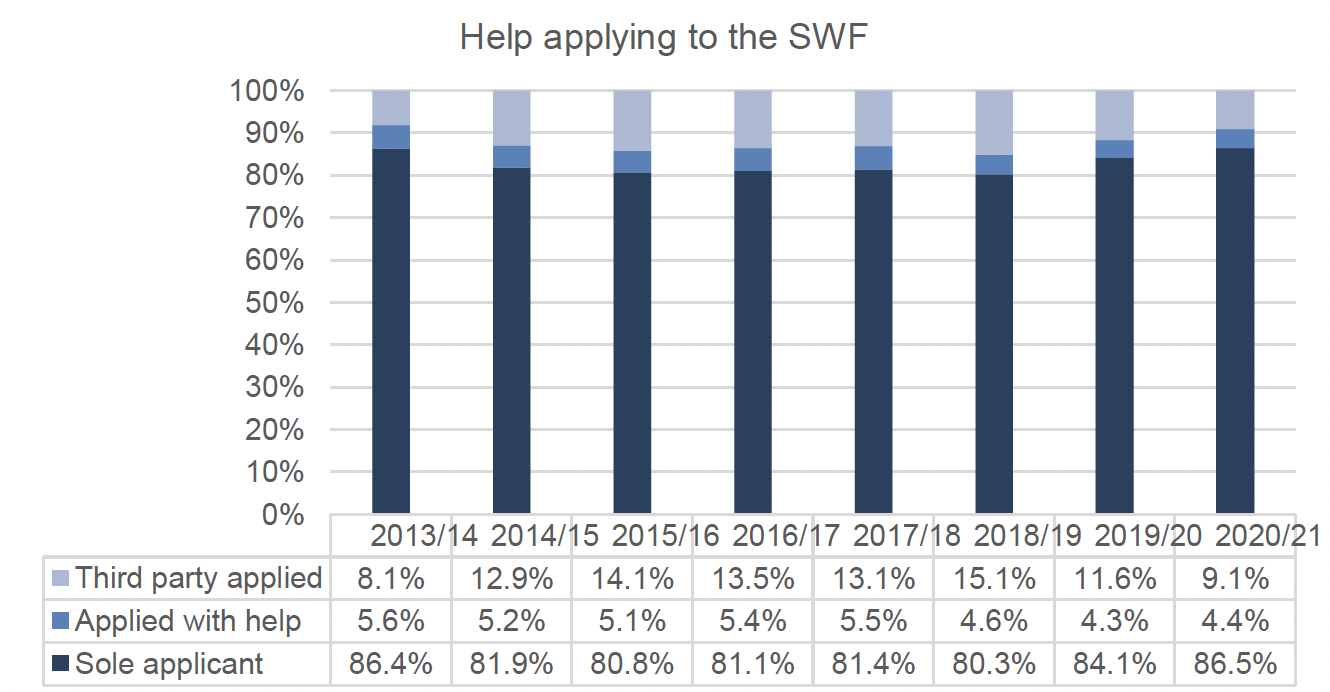
Source: SWF management database
The proportion receiving help had increased between 2015/16 and 2018/19 but has reduced again. Pre-pandemic (2019/20), just 4% received help applying and 12% had someone apply on their behalf while during the pandemic in 2020/21 this was down to 4% and 9%.
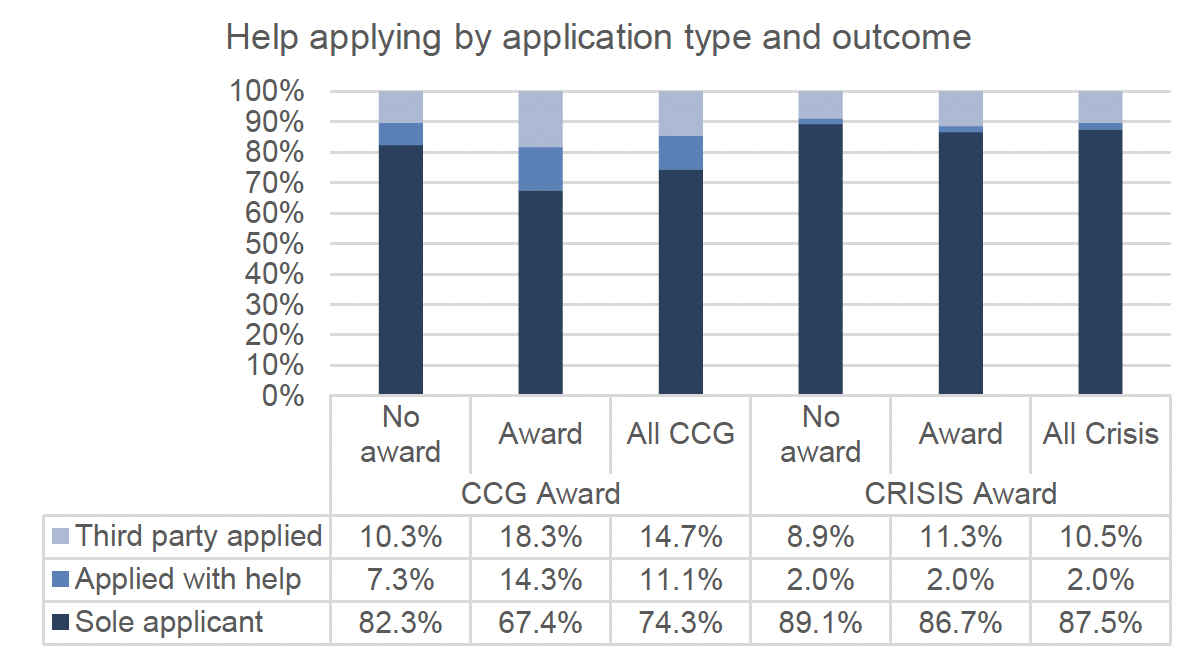
Looking at the pre-pandemic period (2019/20) applicants more commonly received help when applying for Community Care Grants (11% with help and 15% via a third party) compared with Crisis Grants (2% with help and 10% via a third party).
Source: SWF management database
As discussed in the section above on factors associated with successful outcomes, having help was associated with positive outcomes for Community Care Grants, even after other factors (such as vulnerability) were taken into account.
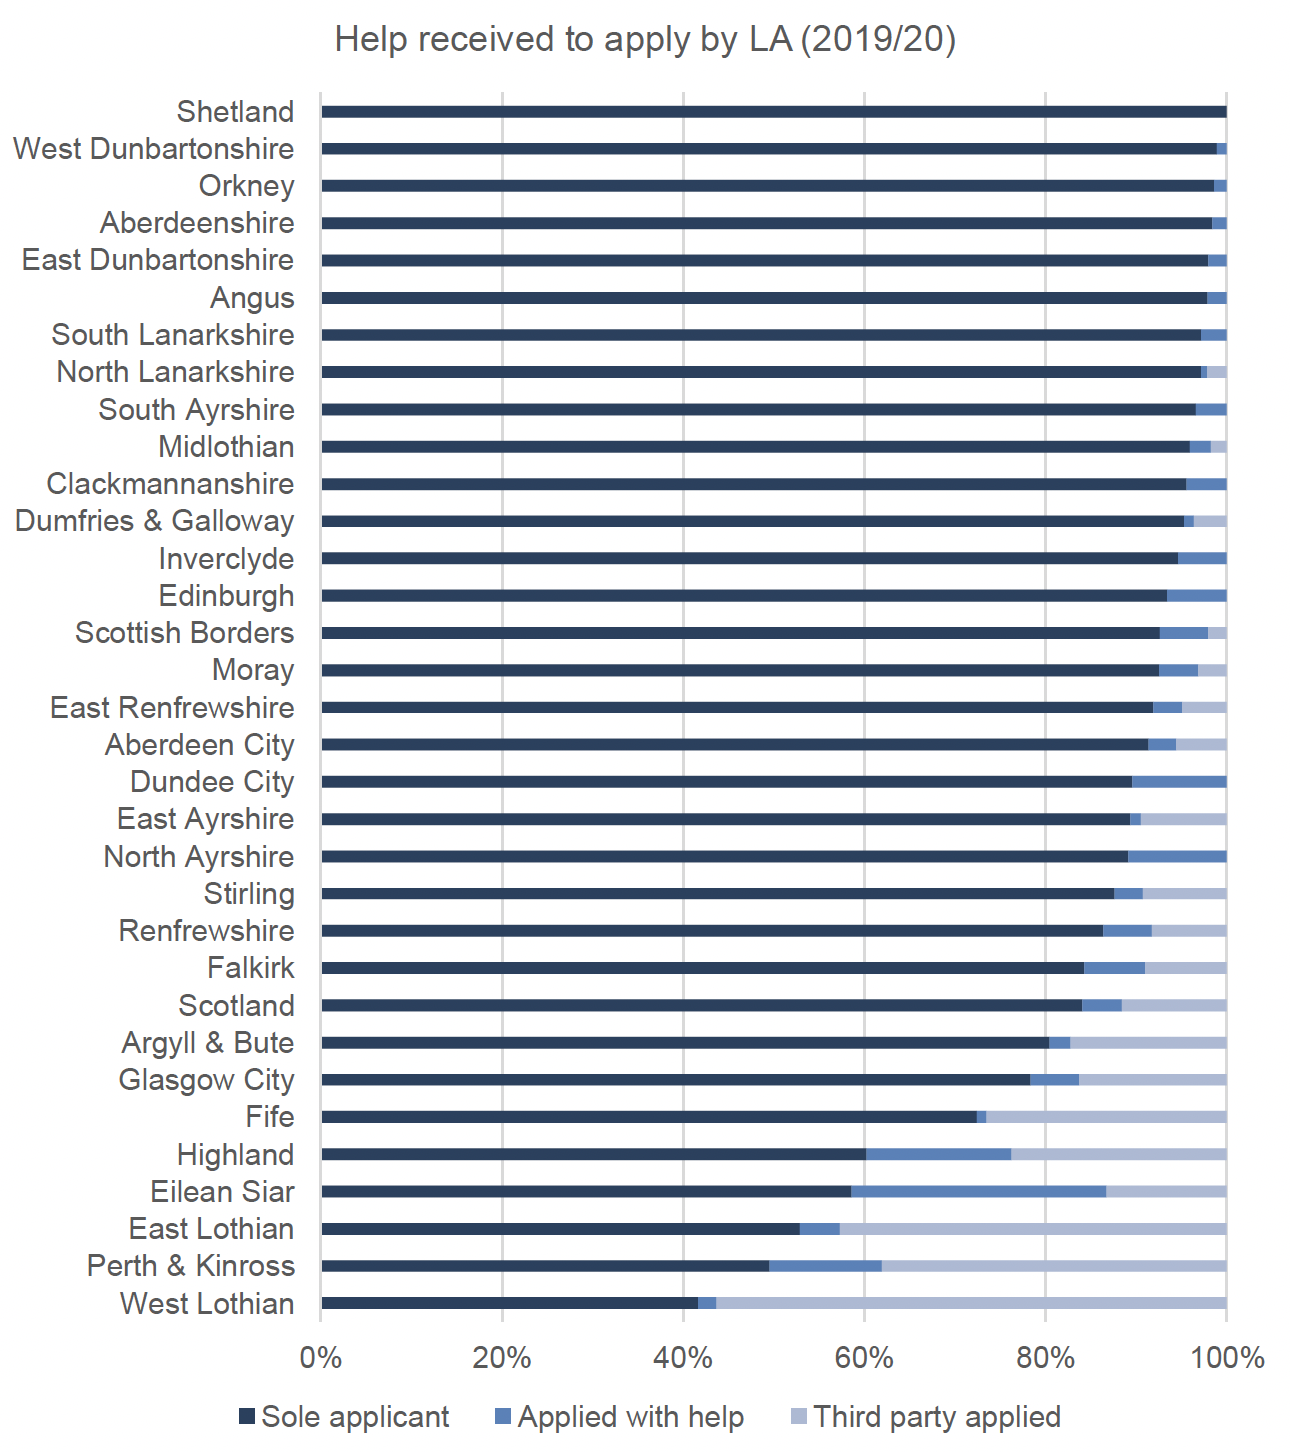
There was significant variation by local authority, with far more help and third-party application in West Lothian, Perth and Kinross and East Lothian, Eilean Siar and Highland but hardly any help in The Shetland Isles, West Dunbartonshire and the Orkney Islands, Aberdeenshire, East Dunbartonshire and Angus.
Source: SWF management database
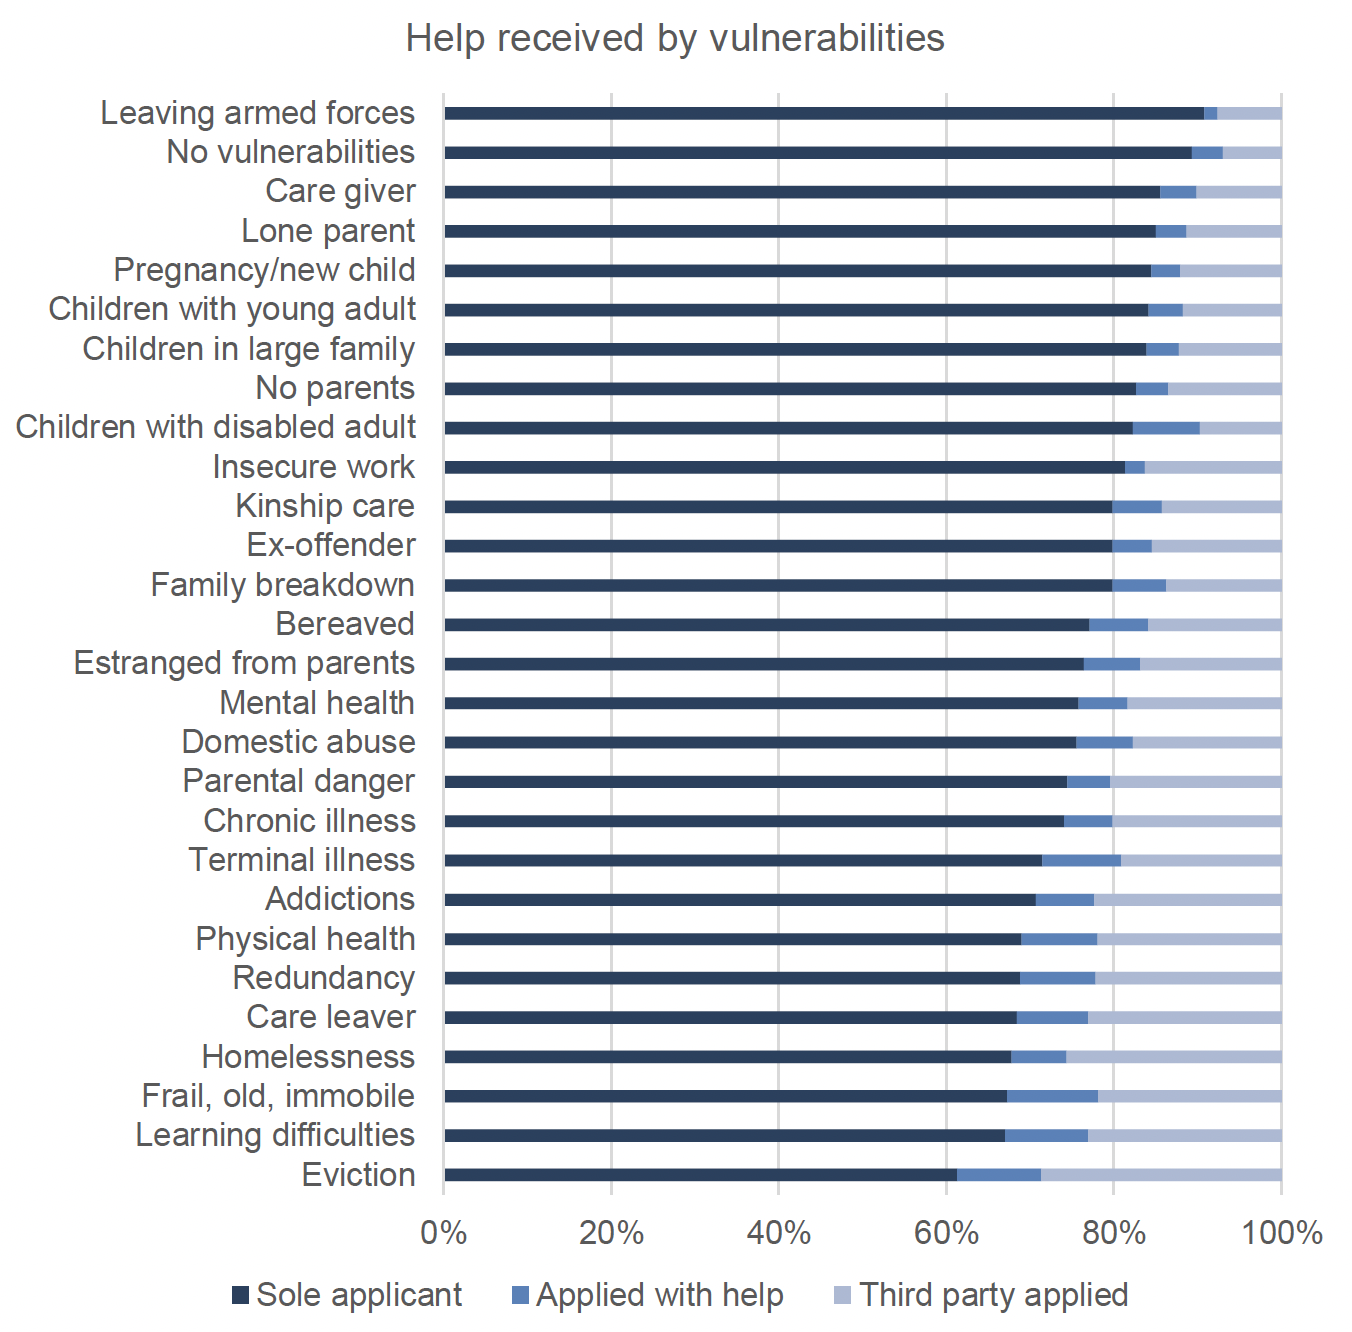
Those facing housing issues – eviction, homelessness and being a care leaver – as well as people with learning difficulties and frail, older people with mobility issues were most likely to have received help to apply or had someone apply to the Scottish Welfare Fund on their behalf. Those leaving the armed forces, those not reporting vulnerabilities, care givers and families were less likely to access help applying.
Information on those from whom help is received is limited – with 85% of applications referring to 'other people' as helping rather than using the codes available. In 9% of cases, the person helping was from the local authority, with help also received from family, friends, landlords and other agencies.
Source: SWF management database
Another important potential enabler is the method of application. Local authorities are required to offer applications via at least three modes, as method of application should ideally offer a range of means of applying to suit different circumstances.
Overall, the range of application methods being used has reduced over time. In 2013/14 applications were evenly split between telephone (48%) and online applications (44%) with a small number by post (6%) and in person (3%). By 2020/21 over 80% of applications were online, with just 18% by telephone and less than 1% by post or in person.
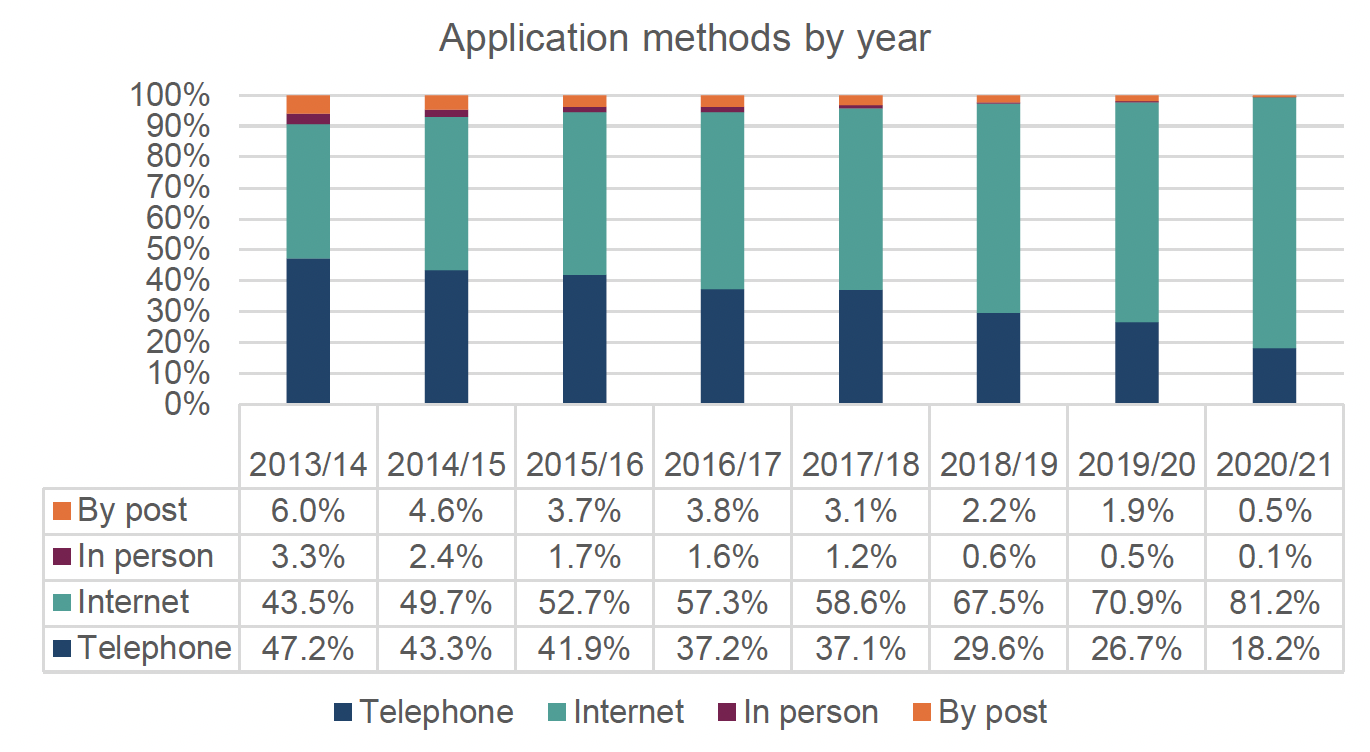
Source: SWF management database 2013/14 to 2020/21
Looking at the pre-pandemic period (2019/20) there had already been a significant shift to online application (71%) with 27% by telephone and a similarly small proportion (2%) done in person or by post.
This shift is significant, since method of application also appeared in the regression analysis as a factor driving successful applications, with successful applications more likely with telephone, face to face and postal methods. Although online application is still highly prevalent among successful awards, the proportion of successful applicants using other methods is higher.
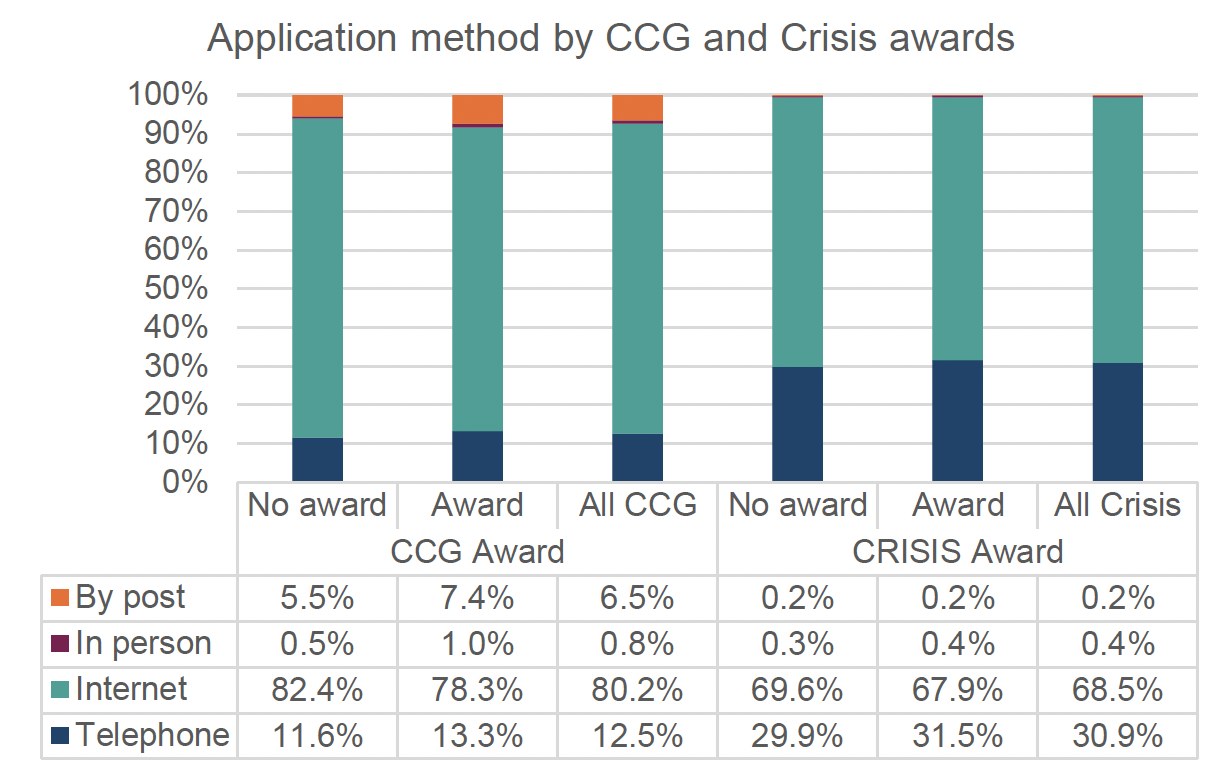
Source: SWF management database
Given the reduced level of success in recent years, the shift to online application from relatively more successful modes is important.
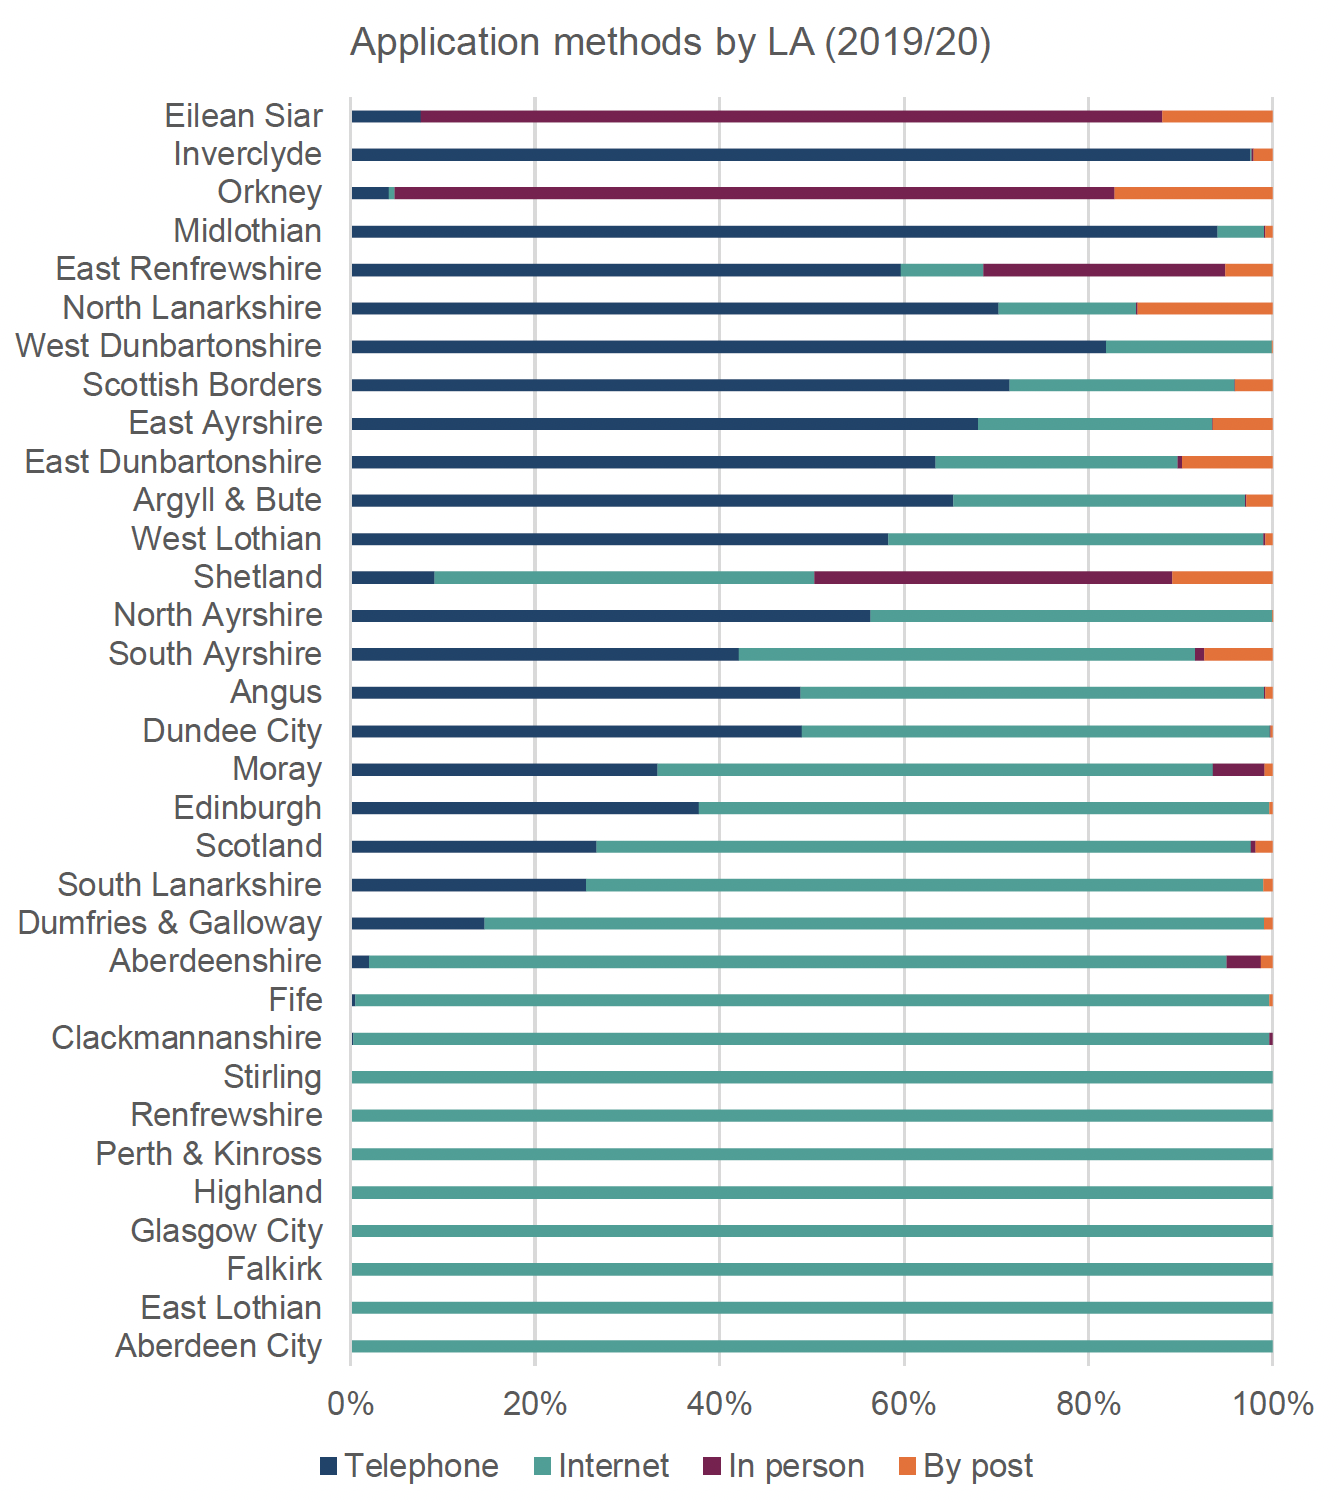
It is also significant, then, that in some local authorities applicants appeared to have a more mixed range of application methods pre-pandemic (albeit many shifted to online in 2020/21 during lockdown). Even pre-pandemic, almost a third of local authorities had applicants almost exclusively applying online.
However, a number of local authorities received a high proportion of telephone applications pre-pandemic – Inverclyde, Midlothian, West Dunbartonshire, the Scottish Borders and East Renfrewshire. The Island Councils had a strong face-to-face element, with East Renfrewshire also having around a quarter of applications in person pre-pandemic. The Shetland Islands, East Renfrewshire and the Orkney Islands showed the most mixed application profile, although some other local authorities have small numbers of different modes used.
Source: SWF management database
Some groups of vulnerable applicants were more likely than average to apply online, with 92% of vulnerable frail, older/immobile people applying online and 97% of households with children living with a disabled adult doing so, compared with 71% of all applicants in 2019/20. These applicants may have applied online as it was more convenient due to their mobility issues, but they may also not have been aware of alternative options.
However, online applications were lower among people who were vulnerable because they were leaving the armed forces (44%) terminally ill (64%) young people unable to live with their parents as this would put them in danger (63%) and prison leavers (66%). Eight per cent of prison leavers applied by post, presumably from prison.
Looking specifically at the local authorities where exclusively online applications were recorded in 2019/20, we see that 41% of applications came from non-vulnerable applicants compared with 50% of all applications. Applicants with mental health issues were more prevalent in the areas where online-only applications were received (31%, compared with 27% overall) as were vulnerable lone parents (23%, compared with 16% overall). The levels of frail older people and chronically ill people were also two percentage points higher in the areas with online-only applications. Online application is heavily used in higher demand areas with higher levels of vulnerability, indicating that vulnerable people are not necessarily deterred by online application.
Repeat applications and repeat awards
The SWF guidance states that ultimately, the scheme is aiming over time to seek a real terms reduction in expenditure on Crisis Grants as a result of successful intervention preventing crisis reoccurring, thereby increasing funds available for preventative spend on Community Care Grants. The main potential indictor in the monitoring data of whether awards are meeting need in a timely and adequate way is the extent to which applicants apply for repeat awards. The analysis examines changes in repeat applications over time, with the hypothesis that a reduction in repeat applications – particularly for Crisis Grants – might indicate more sustainable outcomes over time.
Repeat applications and repeat awards are instances where an applicant has already applied to the Fund during the 12-month period prior to the current application or where they have received an award in the 12-month period prior to the current award. In examining trends in repeat applications, it is worth setting 2013/14 data to one side, as the initial period where repeat applications would inevitably have been lower due to the transfer to the new scheme.
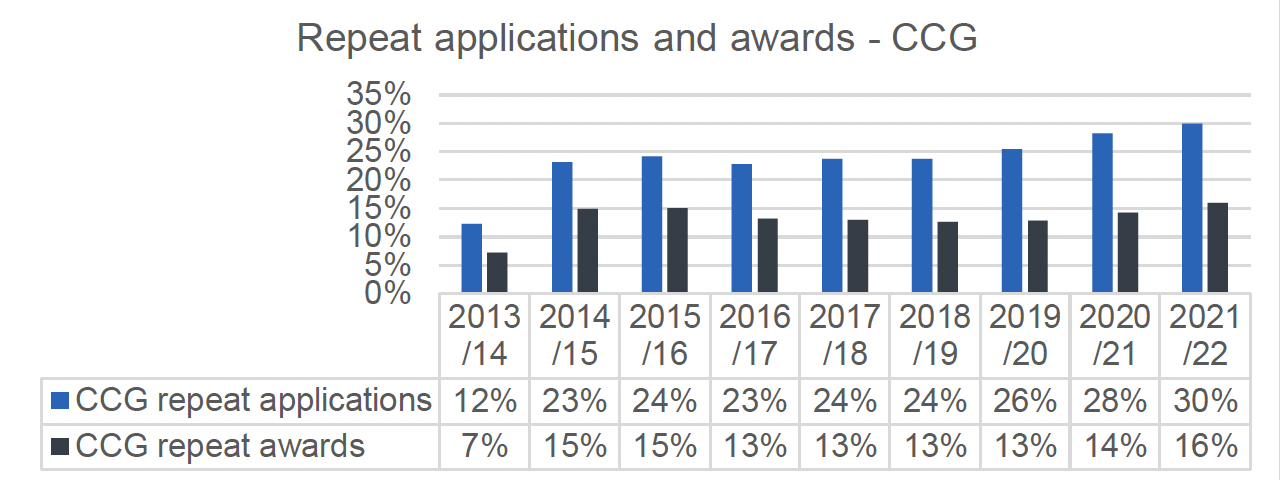
Source: Scottish Welfare Fund Statistics 2021/22, Table 65 and Table 67
23% of Community Care Grant applications were from repeat applicants in 2014/15, a figure that remained similar until 2018/19, but had increased to 26% in 2019/20, 28% in 2020/21 and 30% in 2021/22. The level of repeat awards have not increased significantly over this period, however (15% in 2014/15, and 16% in 2021/22). This might indicate a need to better articulate the eligibility criteria around the Community Care Grant.
Source: Scottish Welfare Fund Statistics 2021/22, Table 69 and Table 71
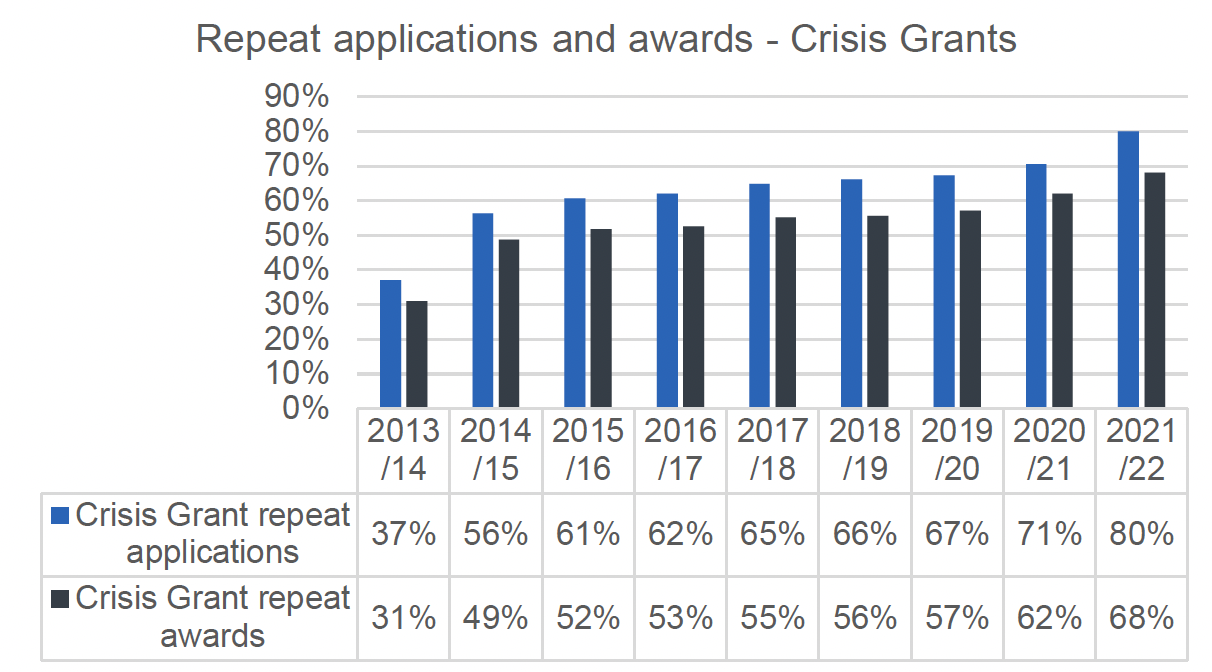
Repeat applications and awards have been far more common for Crisis Grants, with 56% of applications in 2014/15 being repeats, increasing to 67% by 2019/20 pre-pandemic, 71% of applications in 2020/21 during the pandemic and 80% in 2021/22. Unlike Community Care Grants, repeat awards have also increased over time from 49% of awards being repeats in 2014/15 to 57% of awards in 2019/20 pre-pandemic, 62% in 2020/21 during the pandemic and 68% in 2021/22.
This suggests that in the majority of cases that Crisis Grant awards have not been able to meet needs in a sustainable way. The high level of repeat applications and awards also indicates that the core purpose of one-off or occasional provision for exceptional needs is being stretched in a way not envisioned when the Fund was established.
Variation in repeat applications and awards by local authority
The proportion of applications and awards that were repeats is examined by local authority, comparing the most recent period pre-pandemic (2019/20). This is because the rules around repeat applications and awards were relaxed during the pandemic and so 2019/20 provides insights into the most recent typical experiences in different local authorities.
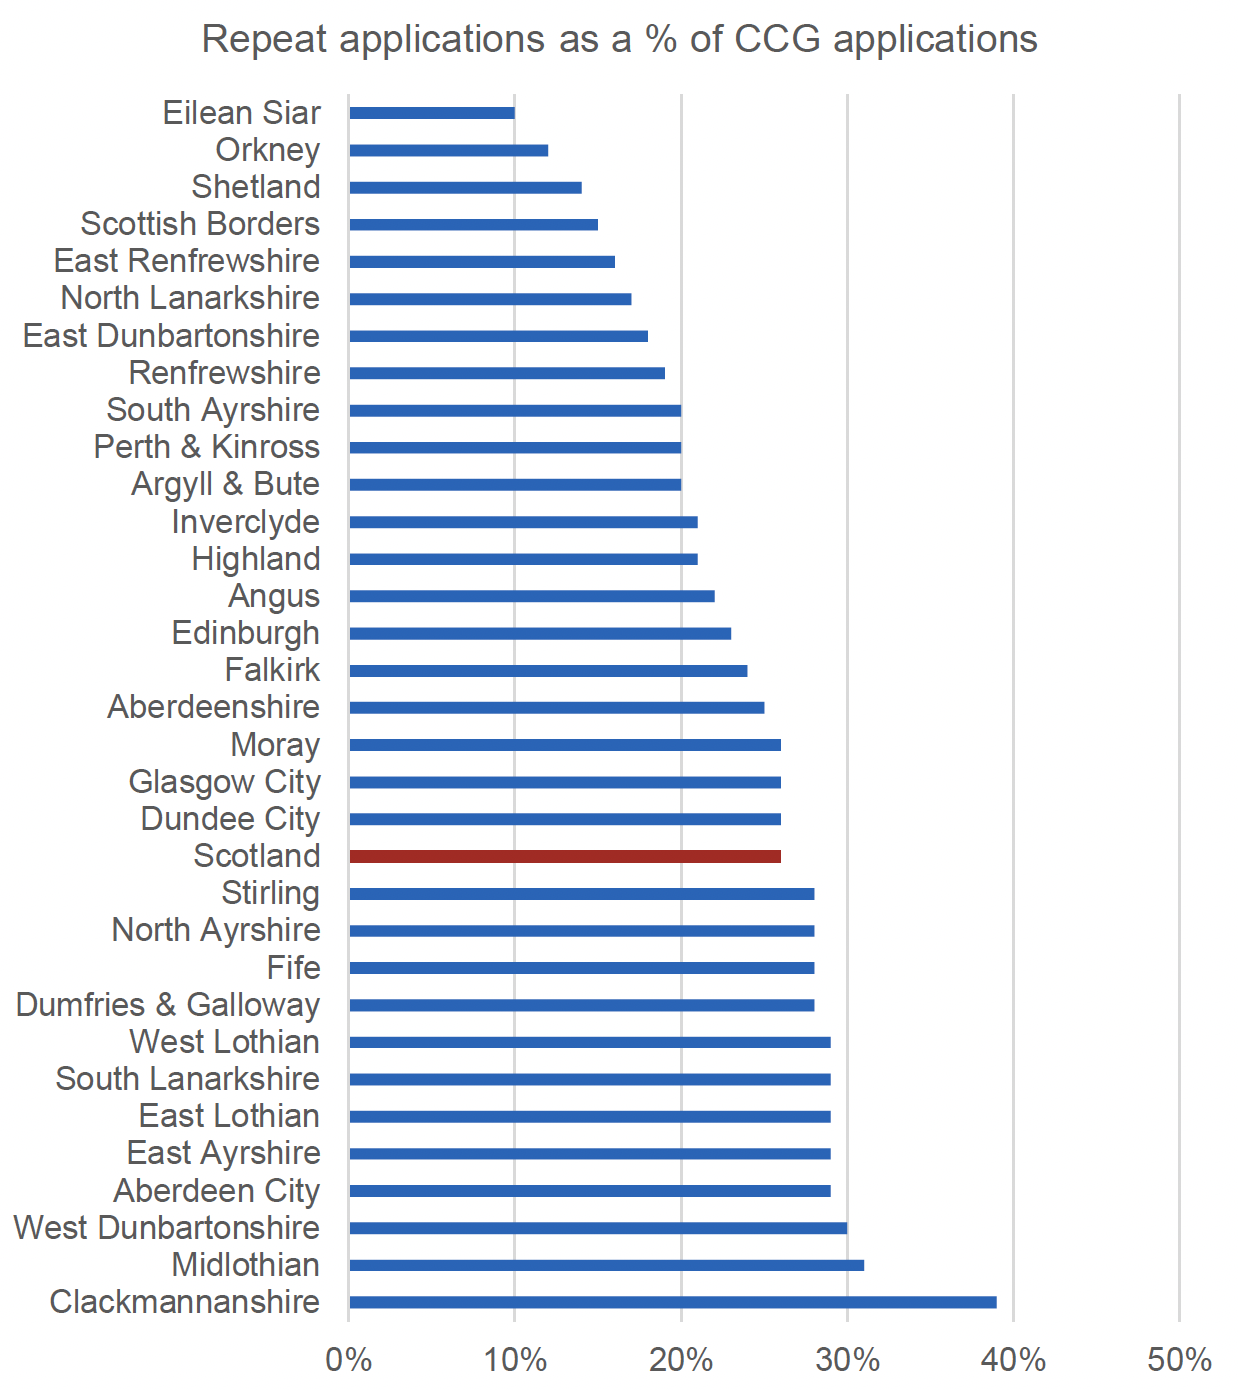
Source: Scottish Welfare Fund Statistics 2019/20, Table 65
In 2019/20, 26% of Community Care Grant applications were repeat applications, with a significantly higher than average rate of repeat applications in Clackmannanshire (39%), Midlothian (31%) and West Dunbartonshire (30%). Significantly lower than average repeat applications for Community Care Grants were recorded in many local authorities ranging from Edinburgh at 23% to the Island local authorities with fewer than 15% repeat applications.
Two of the three locations with higher repeat applications – Clackmannanshire and West Dunbartonshire – had higher than average expected application rates generally for Community Care Grants. Clackmannanshire also had among the lowest success rates in Community Care Grant applications in 2019/20 – just 37% compared with 54% across Scotland. Midlothian did not have higher than expected Community Care Grant application rates but did have applications very heavily skewed towards Crisis Grants – which made up 82% of all applications in 2019/20 compared with the 74% across Scotland.
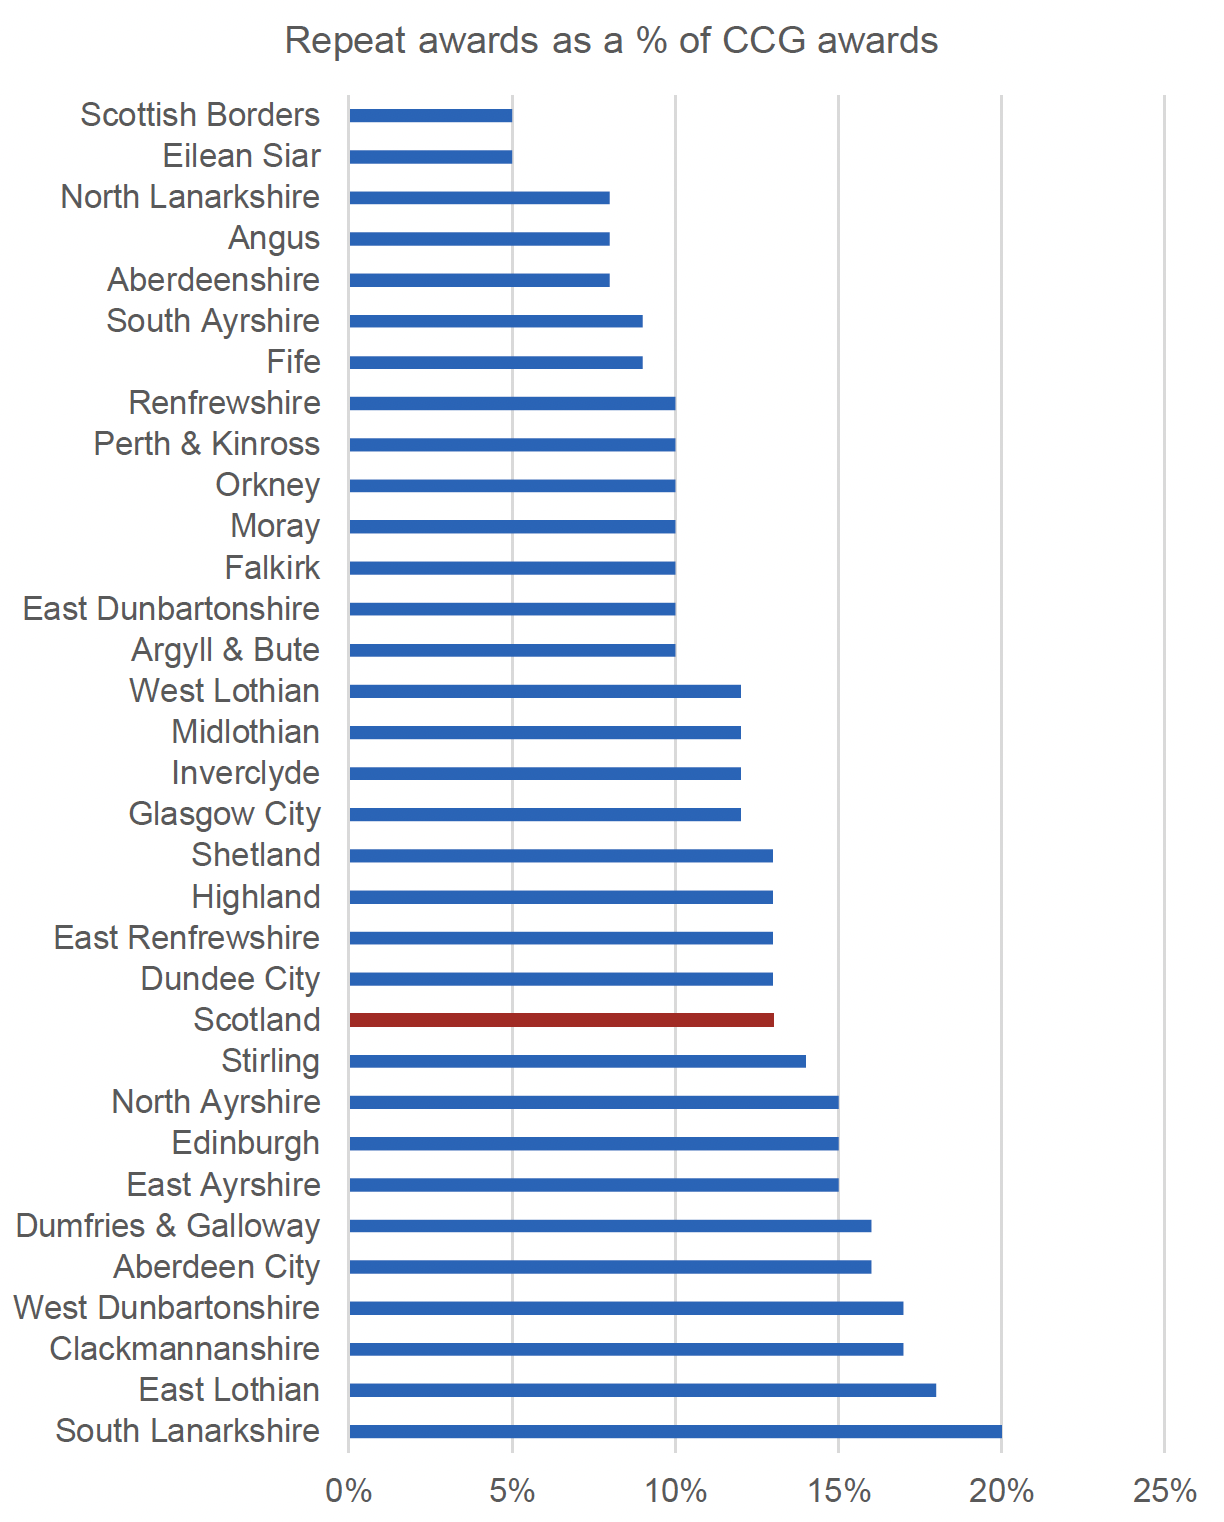
Source: Scottish Welfare Fund Statistics 2019/20, Table 67
Repeat awards amounted to 13% of Community Care Grant awards across Scotland, with significantly higher than average repeat awards in South Lanarkshire, East Lothian, Clackmannanshire, West Dunbartonshire, Aberdeen City and Dumfries & Galloway. Again, there were lots of local authorities with significantly below average repeat award rates (more than one standard deviation from the mean) from Glasgow at 12% to Eilean Siar and the Scottish Borders with just 5% of Community Care Grant awards being repeats.
As with repeat applications, a higher prevalence of repeat awards was related in part to having a higher than expected rate of applications – in the case of Clackmannanshire, West Dunbartonshire, Aberdeen and Dumfries and Galloway. This was not the case in East Lothian and South Lanarkshire, though. Differences in the prevalence of repeat awards may also be related to differing reasons for Community Care Grant applications between areas. Both East Lothian and South Lanarkshire had a far higher than average proportion of Community Care Grant reasons being families facing exceptional pressure (71% of reasons in East Lothian and 63% of reasons in South Lanarkshire, compared with 33% across Scotland). It is also worth noting that Dumfries and Galloway had a far higher than average proportion of Community Care Grant applications related to helping people stay in the community – 64% of reasons in Dumfries and Galloway, compared with 35% across Scotland.
It is also worthy of note that in Aberdeen and Clackmannanshire, with higher than average repeat applications and awards for Community Care Grant, the success rates for Community Care Grant applications were among the lowest in Scotland in 2019/20 - 43% in the case of Aberdeen and 37% in Clackmannanshire compared with 55% across Scotland. Both these areas had a higher than average level of demand than expected. This may indicate a high level of awareness of the scheme but a lack of understanding of the eligibility criteria (or strict application of these).
Figure 52: Repeat applications (Crisis Grant) by local authority
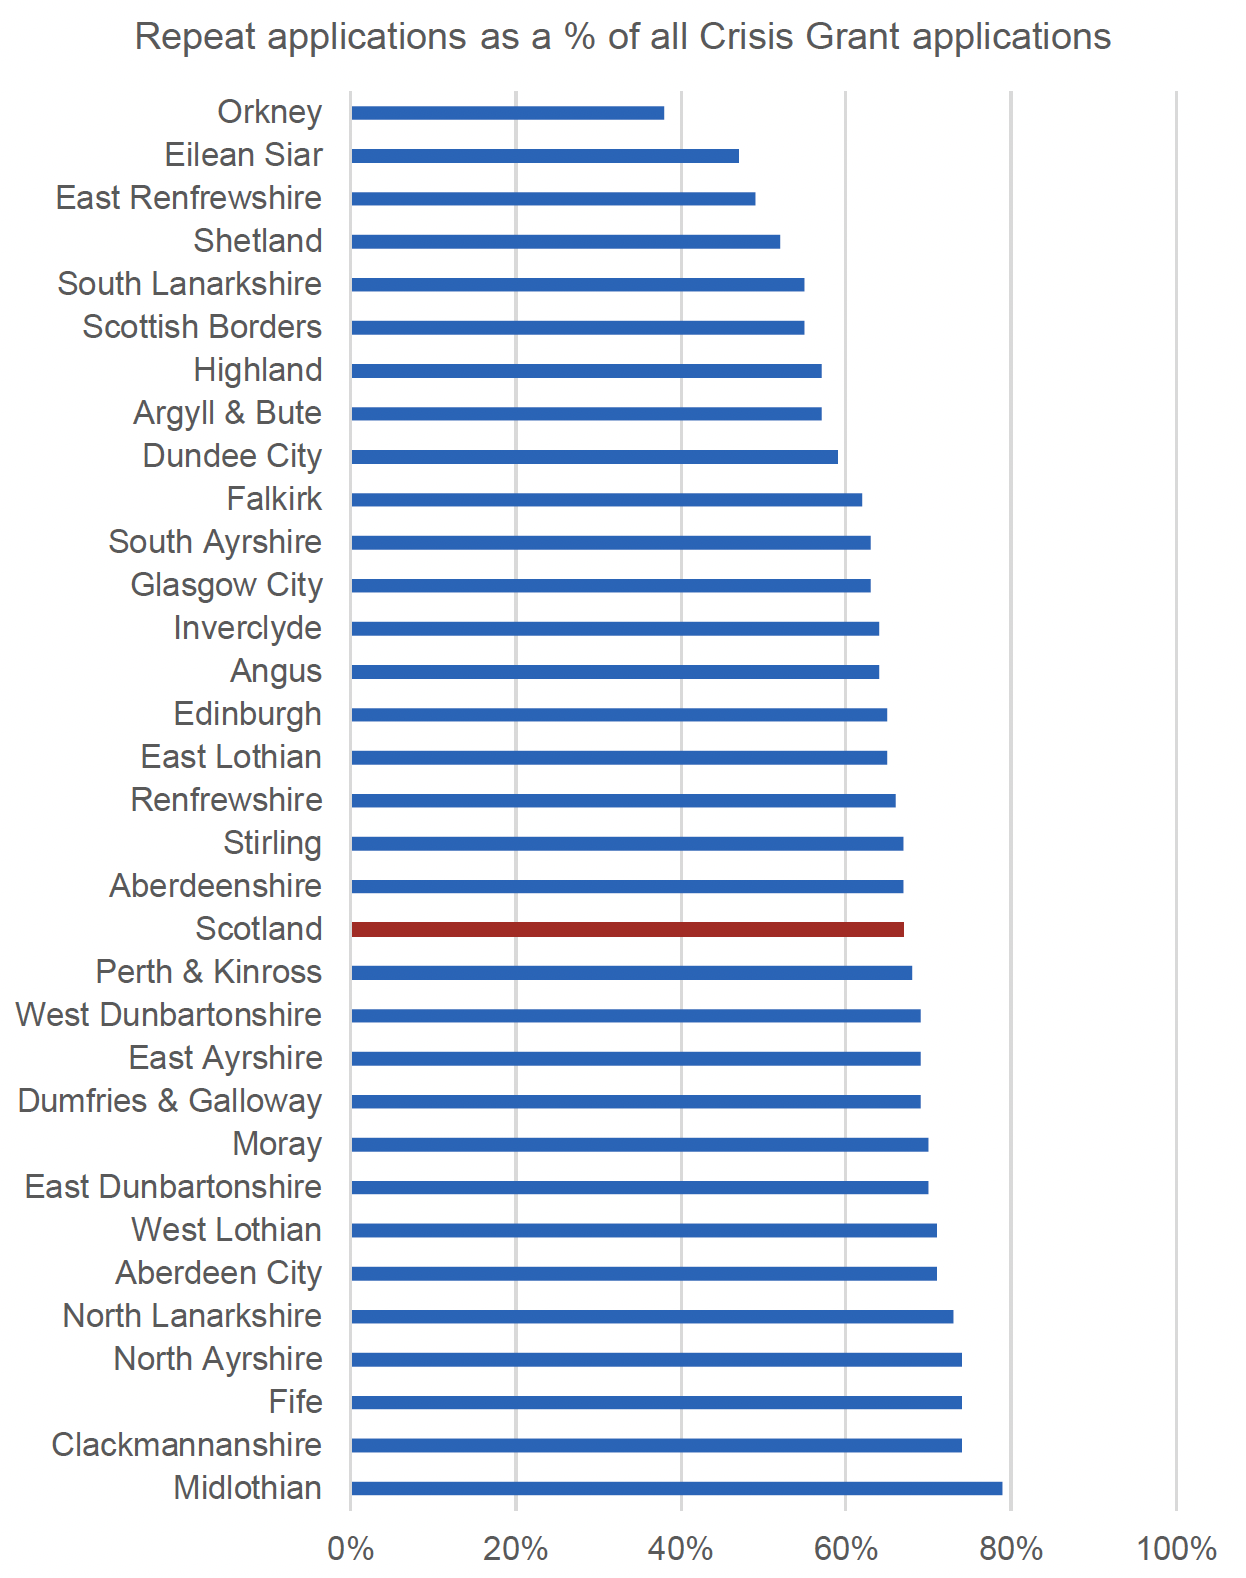
Source: Scottish Welfare Fund Statistics 2019/20, Table 69
There was also considerable variation between local authorities on repeat application rates for Crisis Grants – 67% of Crisis Grant applications across Scotland but ranging from almost 80% in Midlothian to just 38% in the Orkney Islands.
Although a higher rate of repeat applications for Crisis Grants was common among a couple of the local authorities with higher than expected application rates for Crisis Grants generally, for Clackmannanshire and Fife, in Midlothian, North Ayrshire and North Lanarkshire this was not the case. In Midlothian and North Lanarkshire (as well as Fife) there was, however, a very strong bias towards applications for Crisis Grants as a share of all SWF applications – with 80% or more of all SWF applications being for Crisis Grants in 2019/20, compared with 74% across Scotland. In this respect, repeat applications may be an indicator of very high demand, which could be due to higher awareness levels.
North Ayrshire had high rates of repeat applications alongside one of the lowest success rates for Crisis Grants in 2019/20 – just 46% compared with 63% across Scotland. Again, this may suggest a high level of awareness of the scheme but either poor understanding of eligibility or very strict application of this.
A higher rate of repeat Crisis Grant awards was also found among some of the local authorities with higher than expected application rates for Crisis Grants generally – in the case of Clackmannanshire, Fife and West Dunbartonshire. In Midlothian, there were high levels of repeat awards alongside a very strong bias towards applications for Crisis Grants, as noted above. East Dunbartonshire appears to be closer to the average on other indicators, however, so the higher than average repeat awards does not appear to be associated with other indictors of pressure in this case.
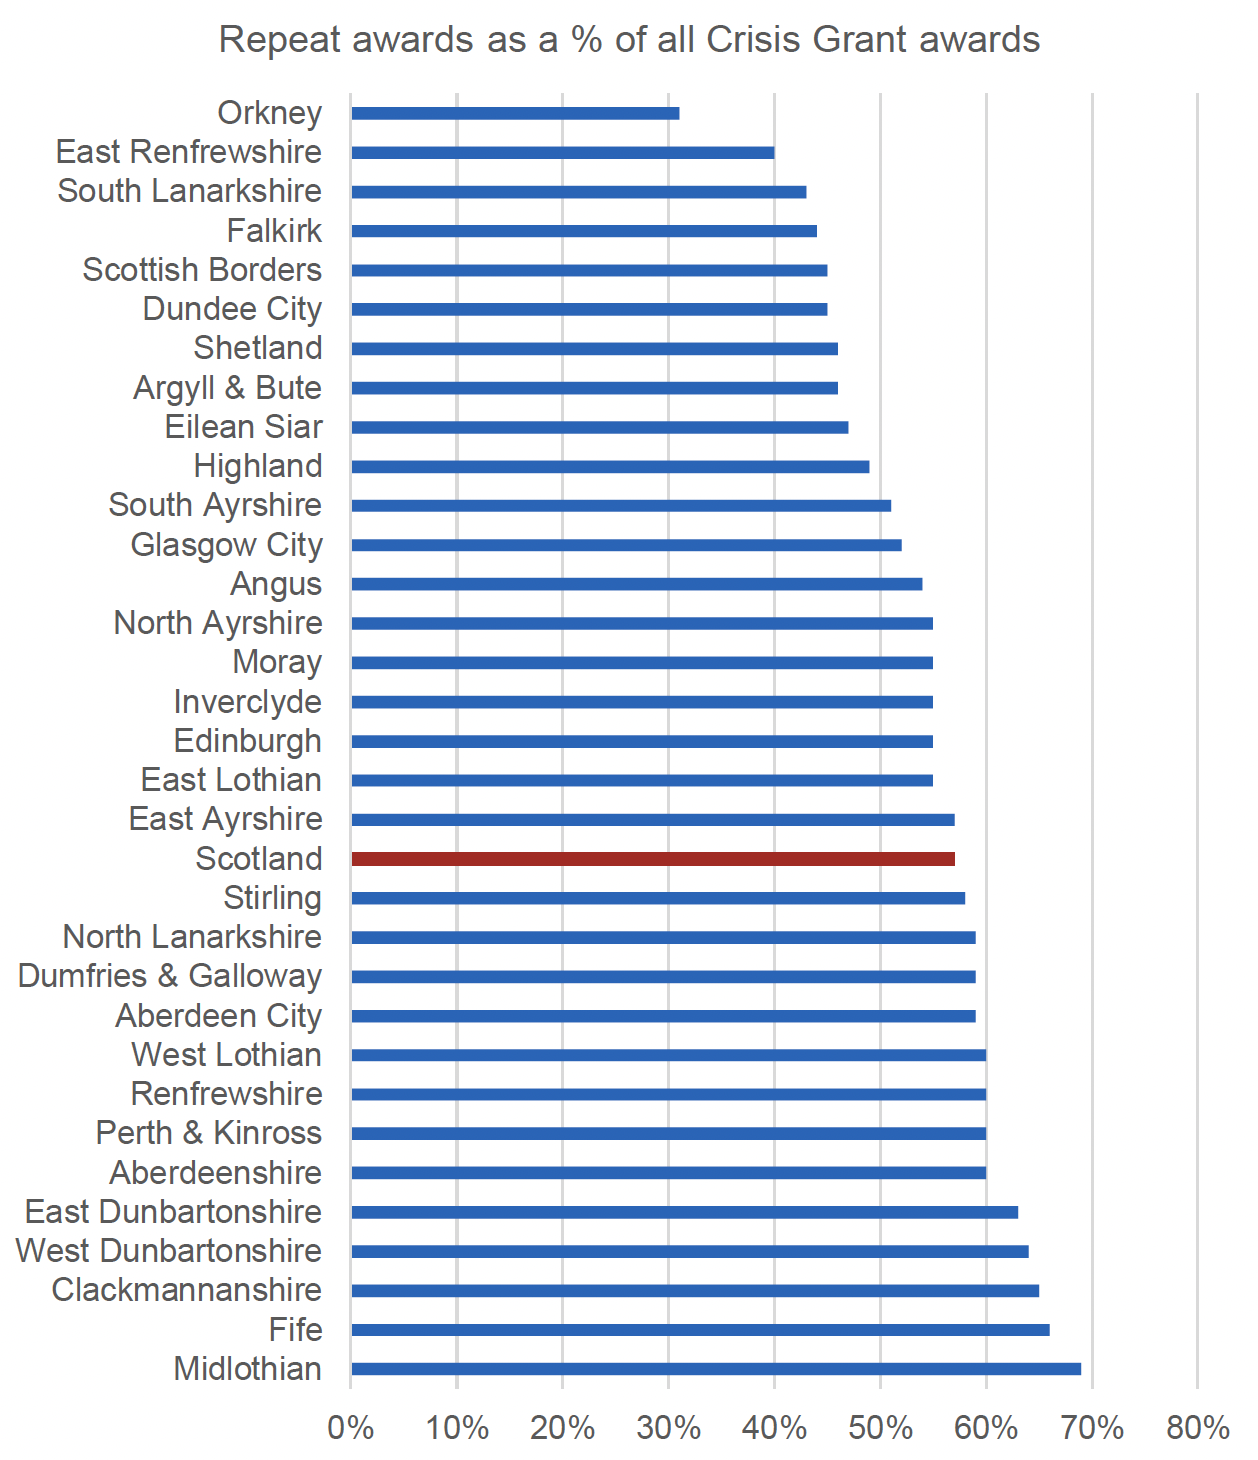
Source: Scottish Welfare Fund Statistics 2019/20, Table 71
Overall then, higher rates of repeat applications and awards tend to be associated with other indicators of higher pressure on the Fund locally – higher than average application rates generally or high concentrations of Crisis Grant applications as a share of all applications, higher than average rates of failed applications or concentrations of Community Care Grant applications for specific reasons.
In terms of vulnerability – the characteristics of repeat applicants and those receiving repeat awards are similar to other applicants. However, repeat applicants and repeat award recipients in the latest year (pre-pandemic) were more likely to be people with mental health issues or addictions. Prison leavers were also more common among repeat recipients of Community Care Grants while lone parents were also more common among repeat applicants and recipients of Community Care Grants.
Contact
Email: Socialresearch@gov.scot