Scottish Welfare Fund review: final report - data analysis appendix
An appendix to the main report of the review of the Scottish Welfare Fund, containing technical detail of the secondary analysis.
4. Funding
Key points
- Overall, spending on SWF by local authorities exceeded the budget allocated (including carried over underspend from previous years) in both 2019/20 (spending was 108% of budget) and 2021/22 (115% of budget).
- Although spending in 2020/21 was under the allocated budget, this reflected a very large (£22 million) additional injection of funds in response to the Covid-19 pandemic. The overall spend was 31% higher compared with 2019/20.
- There have been wide variations in levels of over- and underspending between different local authorities in Scotland. In 2021/22, 18 out of 32 local authorities overspent, with five overspending by 50% or more. However, six spent 70% or less of their allocated budget.
- There is no consistent pattern as to which local authorities over- or under-spend on budget. However, with notable exceptions, rural local authorities have been more likely to underspend, while those with higher than expected levels of demand (based on proxy indicators of need) are more likely to overspend.
- There was also some evidence of a relationship between over- or under-spend and having lower or higher than expected application rates, though this relationship was not consistent across all areas.
- There is also not a straightforward relationship between meeting and not meeting waiting times and budget over- and under-spends.
- Overall, although there is a trend towards longer waits more recently, particularly for Community Care Grant applicants, there is evidence that local authorities are prioritising some applicants. For Community Care Grants, this includes those who are moving to a new home (which will include homeless people and those leaving institutions) and people with disabilities.
- Crisis Grants applied for by a third party were also decided faster, as were those for people with disabilities, those refusing information about disabilities and older people.
Are levels of funding for the SWF appropriate?
The key research questions relating to funding explored in this chapter are:
- Do local authorities have the resources to administer the Fund effectively?
- What patterns and trends are evident in relation to decisions within statutory time limits, and how do these relate to funding levels/patterns of under/over-spend?
This analysis considers patterns of expenditure alongside decision-making. For example, how do underspends/overspends relate to decision-making times and application success rates?
Patterns of expenditure
Pre-pandemic, spending on the SWF was exceeding allocated budget - by March 2020, across Scotland 108% of the overall budget (including the underspend carried forward) had been spent. In March 2021, when the Fund had benefited from a large injection of additional funding to help it respond to needs arising from the pandemic, just 83% had been spent. In March 2022, spending had rebounded – 115% of the budget was spent.
Source: SWF Annual Report 2021/22, Table 33 & Table 35
The latest annual figures show some extremely high overspends in particular areas in 2021/22 – 198% of the budget was spent in West Lothian, 182% in South Lanarkshire, 169% in Perth and Kinross, 167% in Edinburgh and 162% in Dumfries and Galloway.
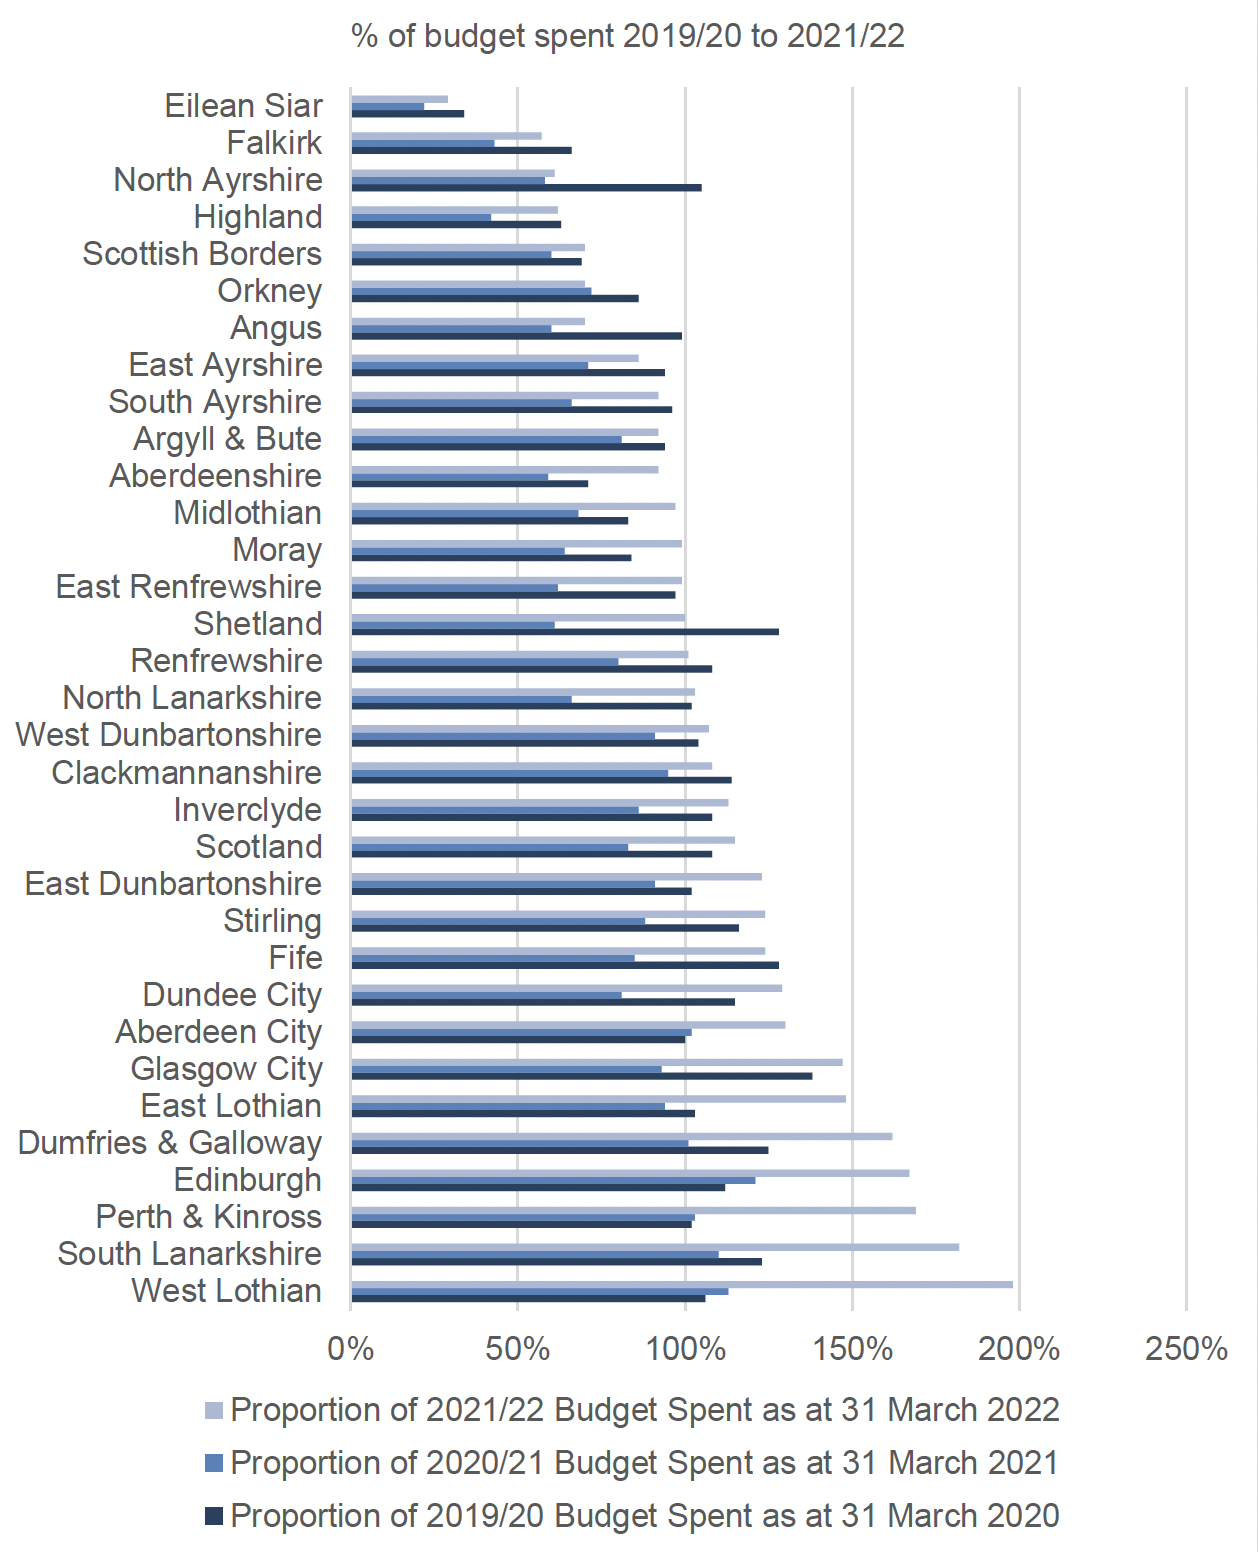
Source: SWF Annual Report 2019/20, 2020/21 and 2021/22, Table 42
There were still some local authorities spending below the budget by a significant margin, however – Eilean Siar spent just 29% of their 2021/22 budget, Falkirk 57%, North Ayrshire 61% and Highland 62%.
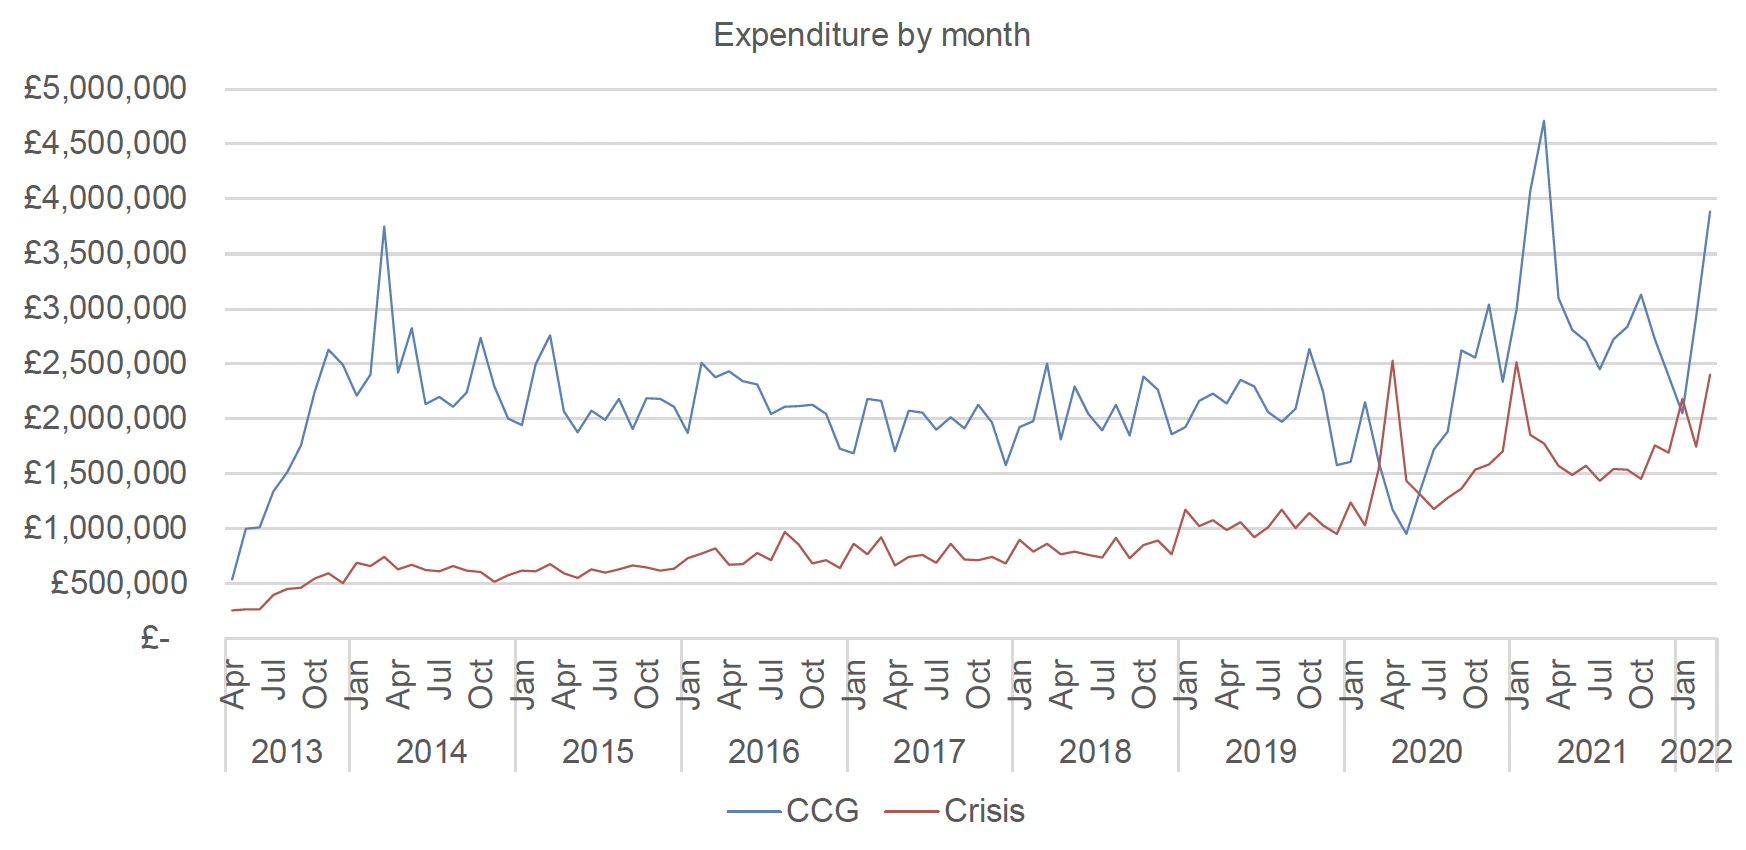
During the year of the Covid lockdown (2020/21), generally speaking, local authorities that had previously been closer to spending, or had overspent, their 2019/20 budget (including budget underspend carried forward) were much further from spending their allowance. Overall, in March 2021 £49,461,775 of a budget of £59,456,925 had been spent, compared with £37,621,428 spent against a budget of £34,909,249 in March 2020. That was a 31% increase in expenditure between 2019/20 and 2020/21 despite the overall underspend. In March 2022, the actual spend was £54,109,502 against a budget of £46,989,736. So, between March 2021 and March 2022 the budget (post-Covid) was reduced by 9% but the spending increased by 9%.
Comparing over- and underspending (pre-Covid) with the analysis of the number of applications above, it is clear that some (but not all) of the local authorities with overspends (pre-Covid) are also those with a higher than expected level of applications compared with proxies of need. Those areas that had budget overspends and also higher than expected numbers of applications were – Glasgow, Fife, Clackmannanshire, Edinburgh and Dundee.
The Shetland Islands had a lower than expected rate of applications but also overspent in 2019/20. Dumfries and Galloway, South Lanarkshire and Stirling had more average application rates alongside a pre-Covid overspend.
The local authorities that had spent less than 80% of their 2019/20 budget by the end of March 2020 were – Aberdeenshire, the Scottish Borders, Falkirk, Highland and Eilean Siar. The Scottish Borders, Highland and Eilean Siar had lower than average application levels while Aberdeenshire and Falkirk had application rates closer to the average. These lower-spending local authorities remained so in 2021/22, even when others were spending far more than their budget – 18 of 32 local authorities overspent, while 14 were within their budget.
This suggests at least some relationship between budget underspending and overspending and having lower or higher than expected application rates compared with proxy indicators of need.
The analysis above shows the overspends and underspends pre- and mid-Covid but it is also possible to track expenditure since 2013-2014 to examine the extent to which local authorities tend to have persistent over- or under-spending or more mixed spending patterns. Again, this is based on the whole budget, including any previous underspending.
- Consistent overspending (including Covid) – Aberdeen, Edinburgh, South Lanarkshire and West Lothian
- Generally overspending pre-Covid - Dundee City, Glasgow City, Inverclyde, North Ayrshire, North Lanarkshire, Renfrewshire, Stirling and West Dunbartonshire
- Mixed spending experience – Clackmannanshire, Dumfries & Galloway, East Dunbartonshire, East Lothian, East Renfrewshire, Fife, Orkney, Perth & Kinross and Shetland
- Recent underspend – Angus, South Ayrshire
- Longer term underspend – Falkirk, Midlothian, Aberdeenshire, Argyll & Bute, East Ayrshire, Eilean Siar, Highland, Moray, Scottish Borders.
Overall, consistent overspending tends to be common in more urban and mixed local authorities while consistent underspending is more common in rural local authorities. However, it is important to note that the qualitative research found that a majority of local authorities that had previously underspent over the longer-term said that they would be over budget this year.
Processing times
The analysis below focusses on pre (2019/20) and post (2021/22) Covid-19 data. Further detail of processing times in during Covid is covered in chapter 7 of this report. Between January and March 2020 (the last quarter pre-pandemic), 81% of Community Care Grants were decided within the target time (of making a decision within 15 working days) though the majority of local authorities delivered proportionately more of their decisions than this within the target, with half of local authorities making 95% of decisions within the target time. The local authorities deciding 100% of awards within the target time were Clackmannanshire, Edinburgh, Inverclyde, Midlothian and North Ayrshire.
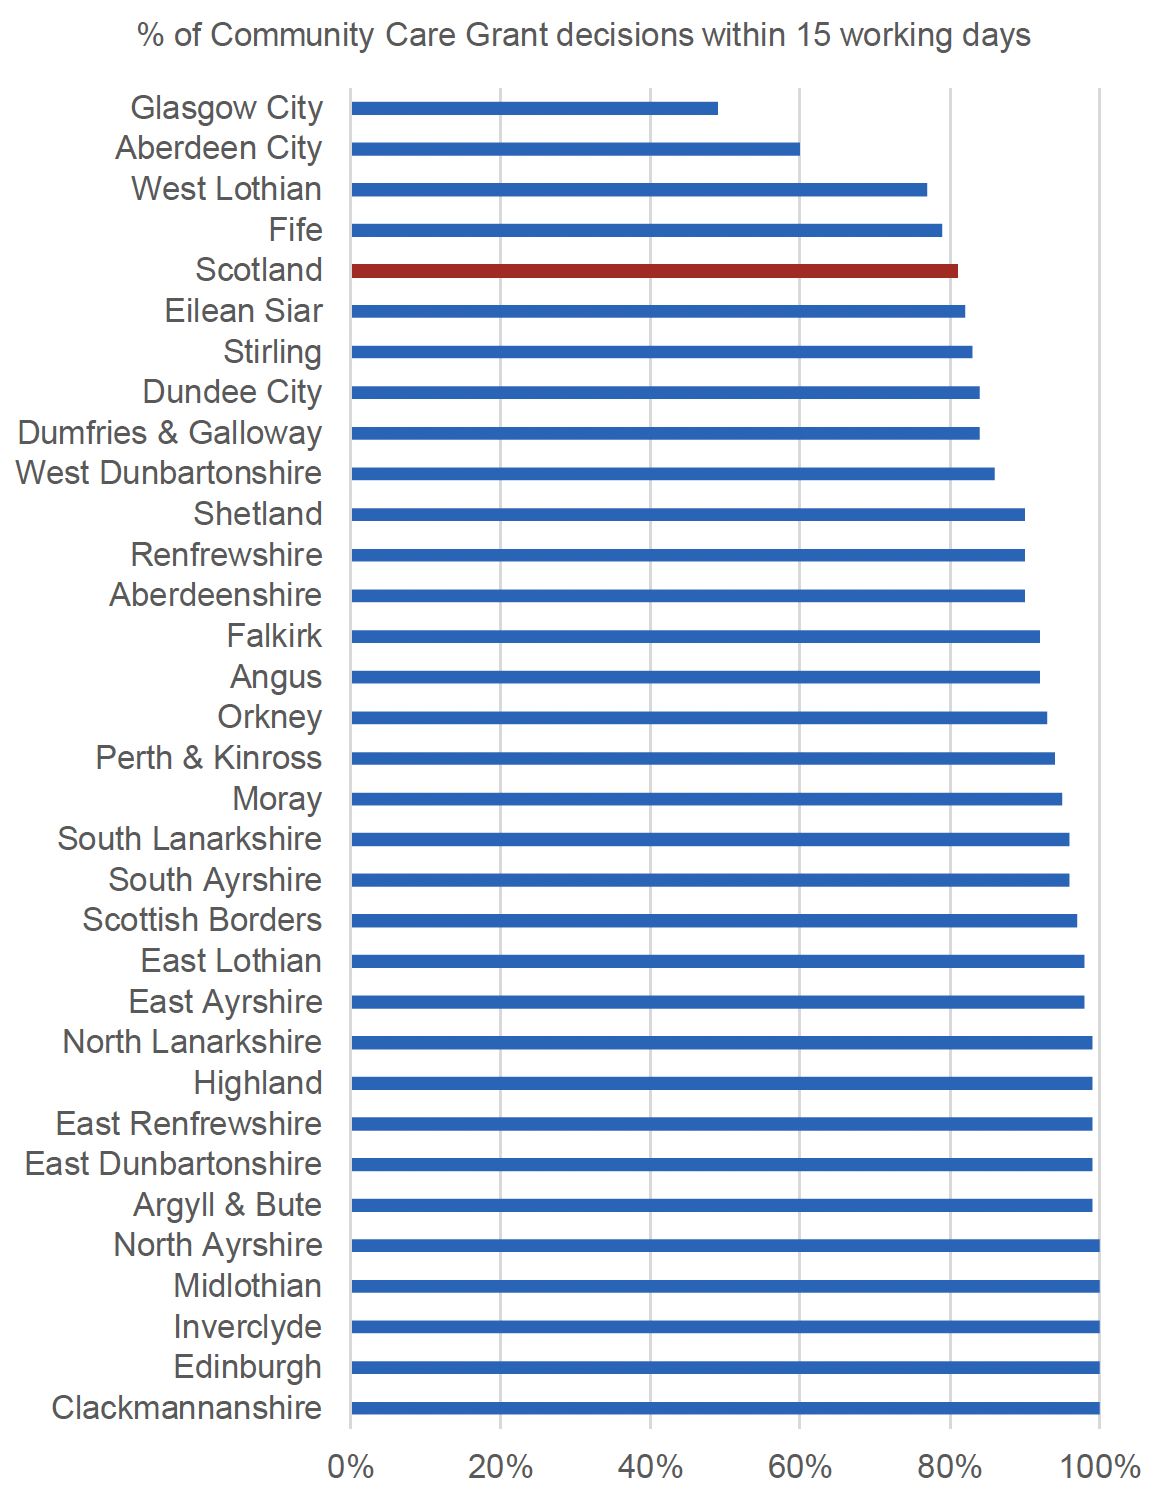
Source: SWF Annual Report 2019/20; Table 15 (For quarter: 1 January to 31 March 2020)
West Lothian (77%), Aberdeen (60%) and Glasgow (49%) less commonly met the target (at least one standard deviation below the average). Glasgow and Aberdeen have among the highest rate of SWF applications which may indicate more pressure on capacity. This was not the case in West Lothian, however.
Source: SWF Annual Report 2019/20; Table 18 (For quarter: 1 January to 31 March 2020)
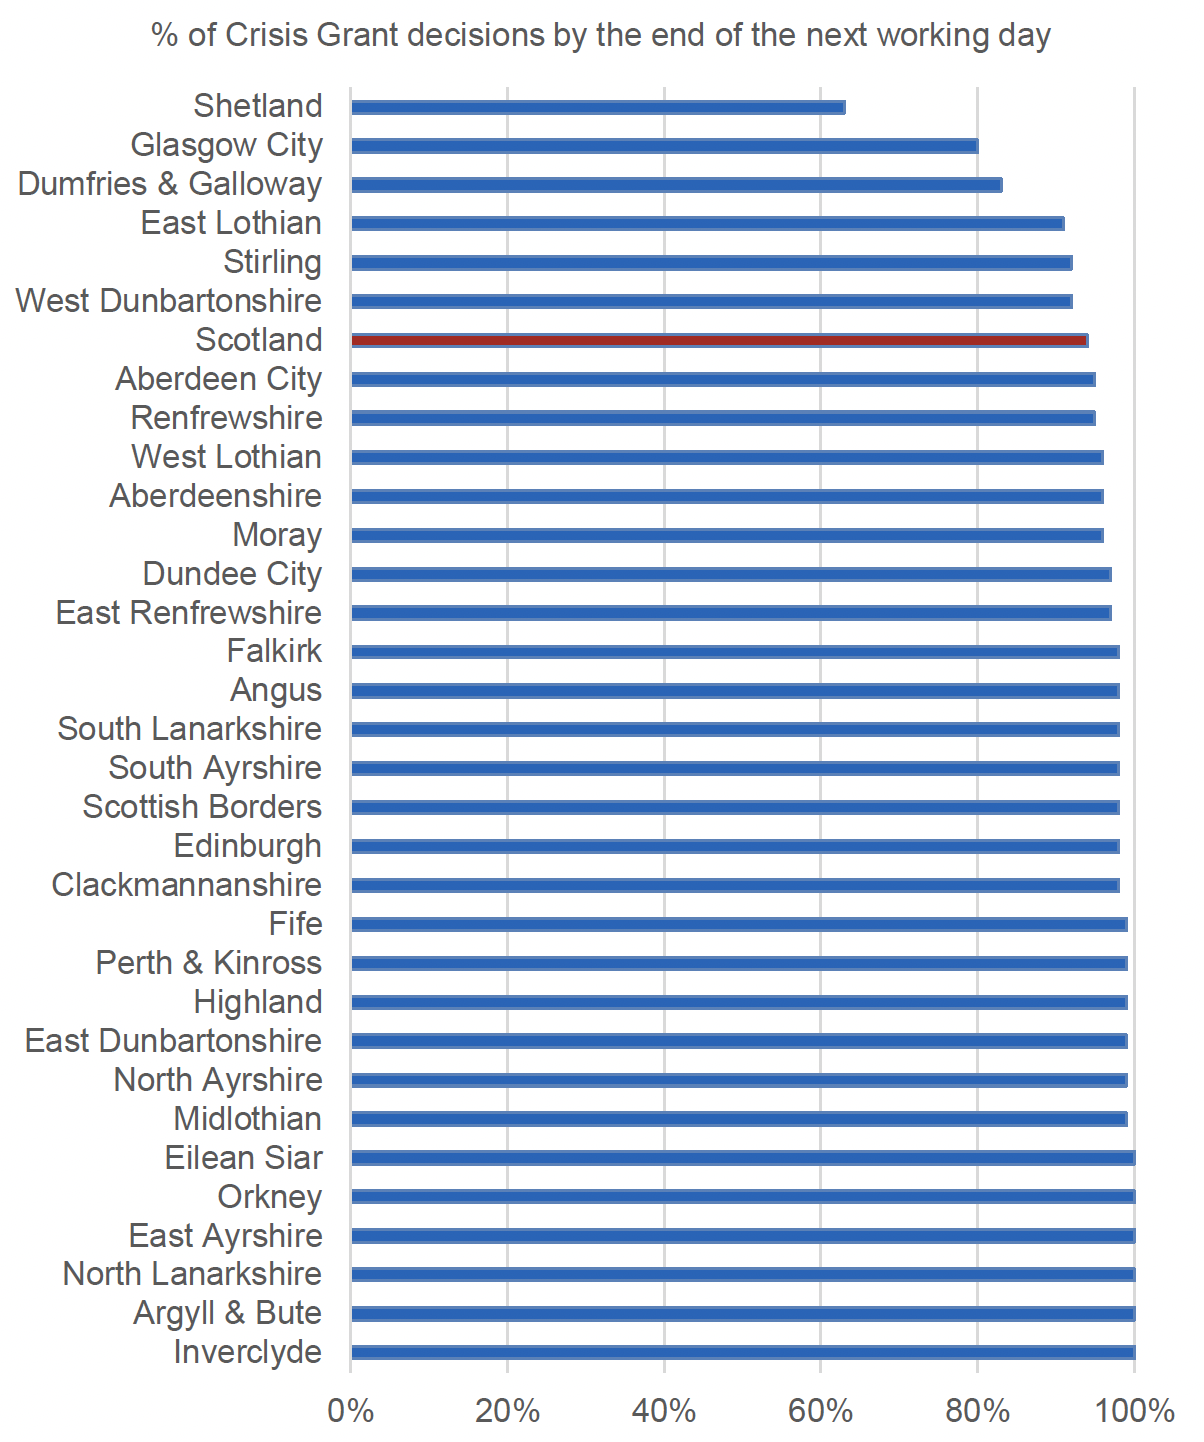
With respect to Crisis Grants, 26 of 32 local authorities made at least 95% of decisions by the end of the next working day (the target deadline).
Glasgow was again among those less likely to meet Crisis Grant decision times between January and March 2020, along with Shetland and Dumfries and Galloway. Shetland decided 63% of Crisis Grants by the next working day, Glasgow did 80% and Dumfries and Galloway decided 83% within target (compared with 94% across Scotland).
Again, the longer decision-making times in Glasgow may be in part due to the higher than expected number of SWF applications received, compared with proxies of need, though this was not obviously the case in Shetland and Dumfries and Galloway.
Compared to budget expenditure, most of the local authorities deciding 100% of Community Care Grant awards within the target time – Clackmannanshire, Edinburgh, Inverclyde and North Ayrshire had spent at least 100% of their budget in 2019/20 while Midlothian had spent 83%. Among those with the lowest proportion of Community Care Grant decisions made within 15 days, total budgets had also been spent - West Lothian had spent 106% Aberdeen spent 100% and Glasgow, with the lowest proportion of decisions withing target time (49% within 15 days) also had the biggest overspend – 138% in 2019/20.
So, there is not a straightforward relationship between meeting and not meeting waiting times for Community Care Grants and Crisis Grants and budget over- and under-spends.
There was also no clear cut relationship between decision-making times and levels of need. As noted above, although Glasgow had a higher than expected rate of Crisis Grant applications, given the level of UC claimants/children in low income households, this was not the case for Shetland and Dumfries and Galloway. The issue of what drives longer decision-making times is explored further below, alongside trends in decision-making times.
The 2021/22 SWF annual update[19] shows that 93% of Crisis Grants were processed within the target time of the next working day. A lower proportion – 86% - of Community Care Grant applications were processed within the 15 working day target limit. Although the majority of applications are processed within time, this has worsened recently particularly for Community Care Grants, with over 90% of Community Care Grant applications processed within target times between 2015/16 and 2018/19 but just 83% in 2019/20, with limited recovery since. Over 95% of Crisis Grants were processed within target times in 2018/19 but this rate has not been reached since.
Variability within local authorities on decision times
Figure 24 (below) shows that for Community Care Grants since April 2013, the median processing time (or the middle value of processing times if all applications were ranked from highest to lowest) was lower than the target of 15 working days. 95% of applications took up to around 25 days to process, with 5% of applications taking longer than this.
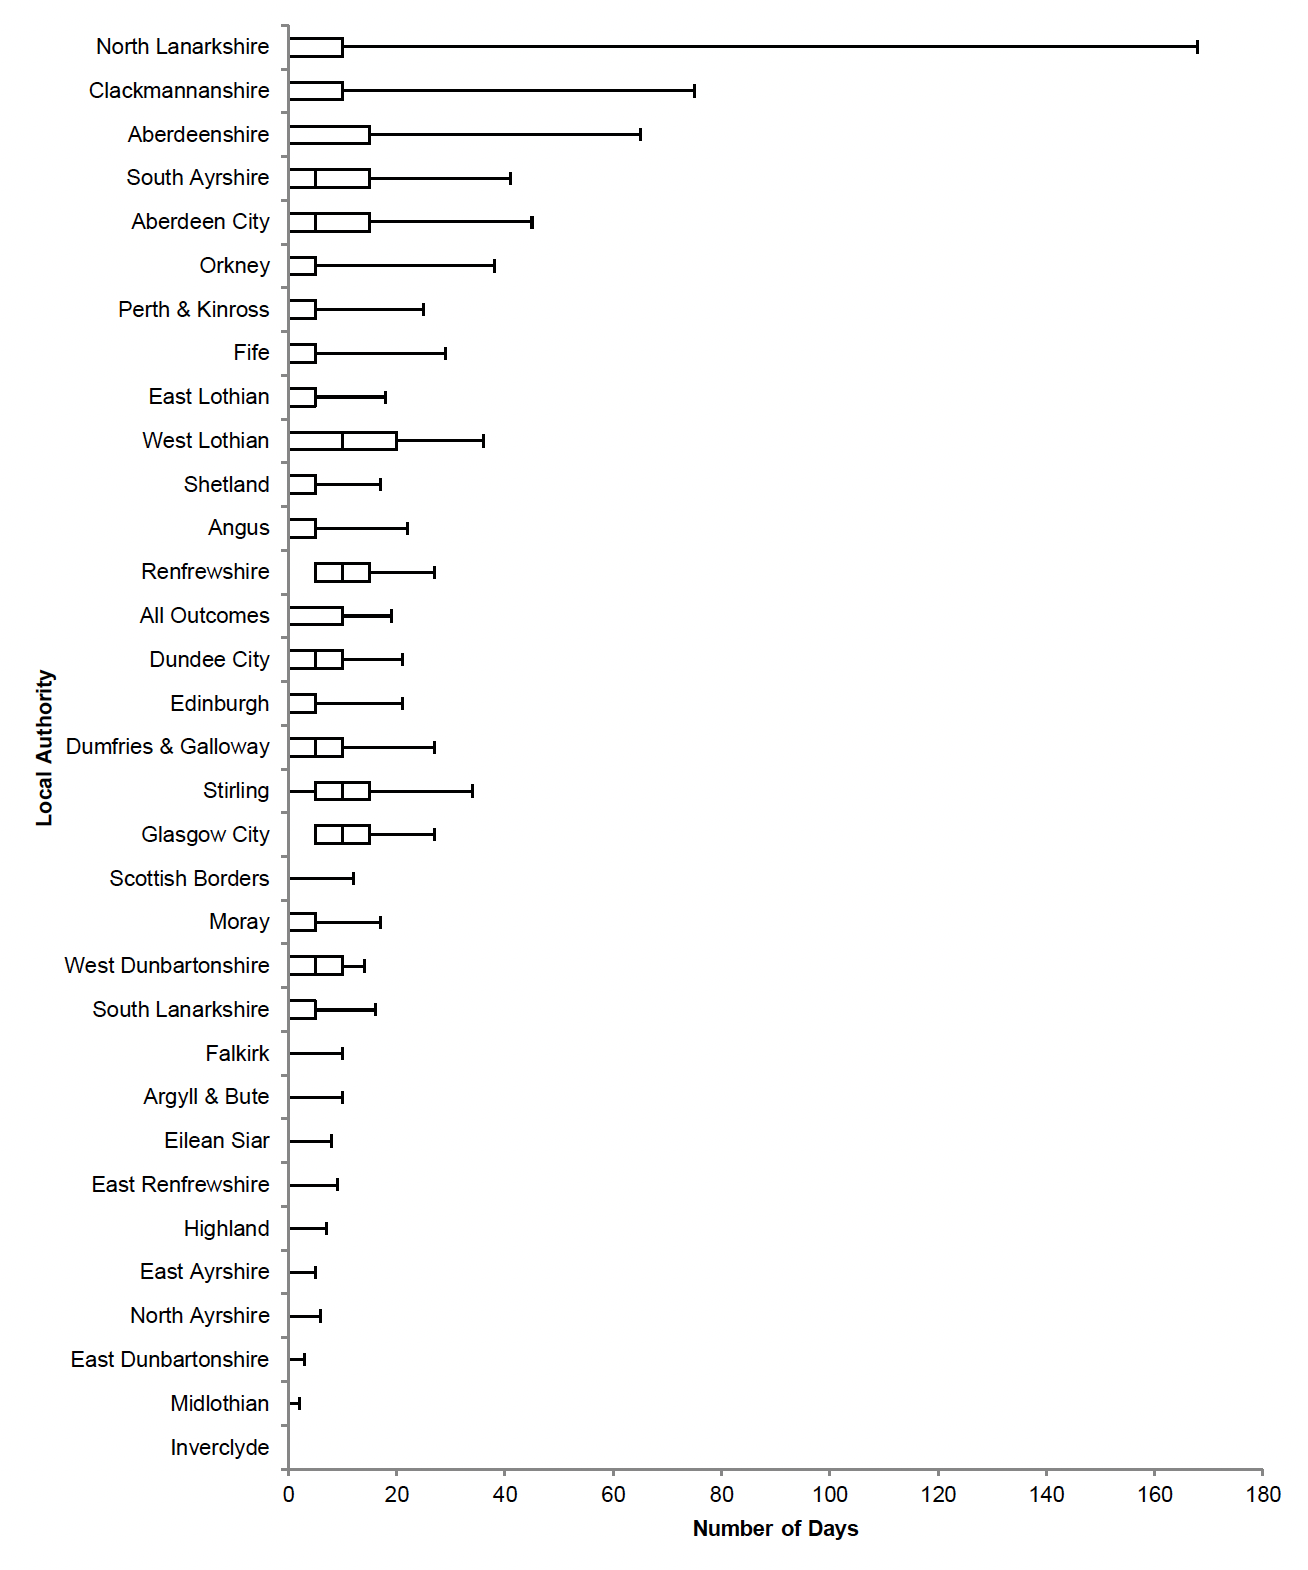
Source: SWF Annual Report 2019/20, Chart 4b
The largest range of waiting times are found in the local authorities at the top of the chart, with North Lanarkshire having the longest of waits – with the slowest 5% of waiting times (the 95th percentile of all waiting times) being 90 days.
Other local authorities with higher outliers were Clackmannanshire (65 days) Aberdeenshire (60 days) South Ayrshire (45 days) Aberdeen (45 days) and the Orkney Islands (35 days).
This longer-term analysis differs from more recent data, which shows 100% of Community Care Grant decisions made in Clackmannanshire within 15 days. Looking at the latest full year prior to the pandemic (2019/20) both North Lanarkshire and Clackmannanshire had a 95th percentile waiting time of just one day.
In 2019/20, the local authorities with the longest waiting times for Community Care Grants were Glasgow (with a median waiting time of 15 days) followed by Aberdeen and Stirling (both 11 days) and West Dunbartonshire (8 days), with Shetland at 7.5 days and Dumfries and Galloway at 7 days. Although these waiting times are all below the target of 15 working days, this is considerably longer than the median across Scotland, which was just 1 day in 2019/20.
These differences are driven by some very large outliers, with Glasgow having a 95th percentile waiting time (i.e. the longest 5% of waiting times) of 47 days and Aberdeen 39 days. Other local authorities with outlying waiting times of more than twice the target (i.e. over 30 days) were Aberdeenshire at 37 days, Fife (32 days) and Shetland (31 days). Glasgow, Fife and Aberdeen are all higher pressure areas, in terms of application rates but Aberdeenshire and Shetland are not.
Who waits longer?
In addition to variations in waiting times by local authorities, the management data can be used to look at other patterns in who waits longest for a decision. Again, data for the pre-pandemic period of 2019/20 is used to consider pre-pandemic practice.
Online applicants - In 2019/20, 18% of applicants waited more than 15 days for a Community Care Grant decision, ranging from just 7% of those who applied in person (who were more likely to be vulnerable) and 8% who applied by post (who were more likely to be in prison) to 14% of telephone applicants and 20% of online applicants.
Third-party applications – In 2019/20, only 13% of those who got help with their application waited more than 15 days, compared with 17% who applied by themselves. However, 29% of third-party applications took more than 15 days.
People without disabilities – In 2019/20, 18% of people in households with a disabled person waited for more than 15 days for a decision, compared with 28% of households reporting no disabilities. However, just 8% of households refusing to provide disability information waited longer. Not providing information about disabilities may be an indicator of vulnerability, though, as this group was also more likely to receive an award (59% received an award, compared with 54% overall in 2019/20). This is explored further later.
People who are not moving – In 2019/20, 19% of those applicants who were not moving waited more than 15 days for a decision on a Community Care Grant, compared with 6% of those moving into an RSL tenancy or other accommodation, 8% moving into private renting, 11% of those applying in advance of finding a tenancy and 12% of those awaiting a local authority tenancy. This indicates that local authorities may be prioritising Community Care Grant decisions relating to a new tenancy over those for replacing items in an existing home.
'Other' types of household – In 2019/20, 18% of single people and couples with children and 17% of single parents and couples without children waited more than 15 days for a decision while 21% of 'other' households with children and 22% of other households without children waited longer.
Older people and males – In 2019/20 the median age of those waiting for more than 15 days for a Community Care Grant decision was 36 compared with 35 years for those waiting less time while 18% of females and 19% of males waited over 15 days for a decision (both statistically significant differences).
For Crisis Grants, in 2019/20 6% of applicants waited longer than the target of the next working day, ranging from just 2% applying by telephone to 5% applying by post, 7% applying online and 8% applying in person.
For Crisis Grant applicants, third party application was faster than getting help – only 4% of third party applicants waited longer than the next day, while 11% of those who applied with help did, compared with 6% who applied themselves.
Again, for Crisis Grants, those reporting a disability or refusing information less commonly waited beyond the target time, 5% did, compared with 7% of those who reported no-one in the household with a disability. 8% of 'other' types of household waited more than a day, compared with 5-6% of single people and couples with children. For Crisis Grants, the age/gender relationship was reversed with younger people and females waiting longer – 6% of females waited longer than one working day, compared with 5% of males and the median age of those waiting longer than a day was 32, while those not waiting as long was 33 years. Again, though small differences these are statistically significant.
Overall, although there is a trend towards longer waits, with a smaller proportion of Community Care Grant and Crisis Grant applications processed within target times more recently, there is evidence that local authorities are prioritising some applicants. For Community Care Grants, this includes those who are moving to a new home (which will include homeless people and those leaving institutions) and people with disabilities. Crisis Grants applied for by a third party were also decided faster, as were those for people with disabilities and those refusing information about disabilities and older people.
Contact
Email: Socialresearch@gov.scot