Restricting multi-buy price promotions on high fat, sugar or salt discretionary foods: analysis summary - briefing
Analysis on the impact on potential calorie and nutrient intake by SRUC and the University of Aberdeen of restricting multi-buy promotions of high fat, sugar or salt discretionary food and drink. It is a companion to reducing health harms of foods high in fat, sugar or salt: economic modelling – final report.
5. Results for Restricting Promotions of HFSS Discretionary Foods
Across the whole sample, the model estimated an average reduction of 155 calories per person each week from implementation of a restriction on multi-buy promotions. On average, people were estimated to potentially consume 18.5 fewer grams of sugar each week, 4.3 fewer grams of fat and 31.7 fewer grams of carbohydrates.
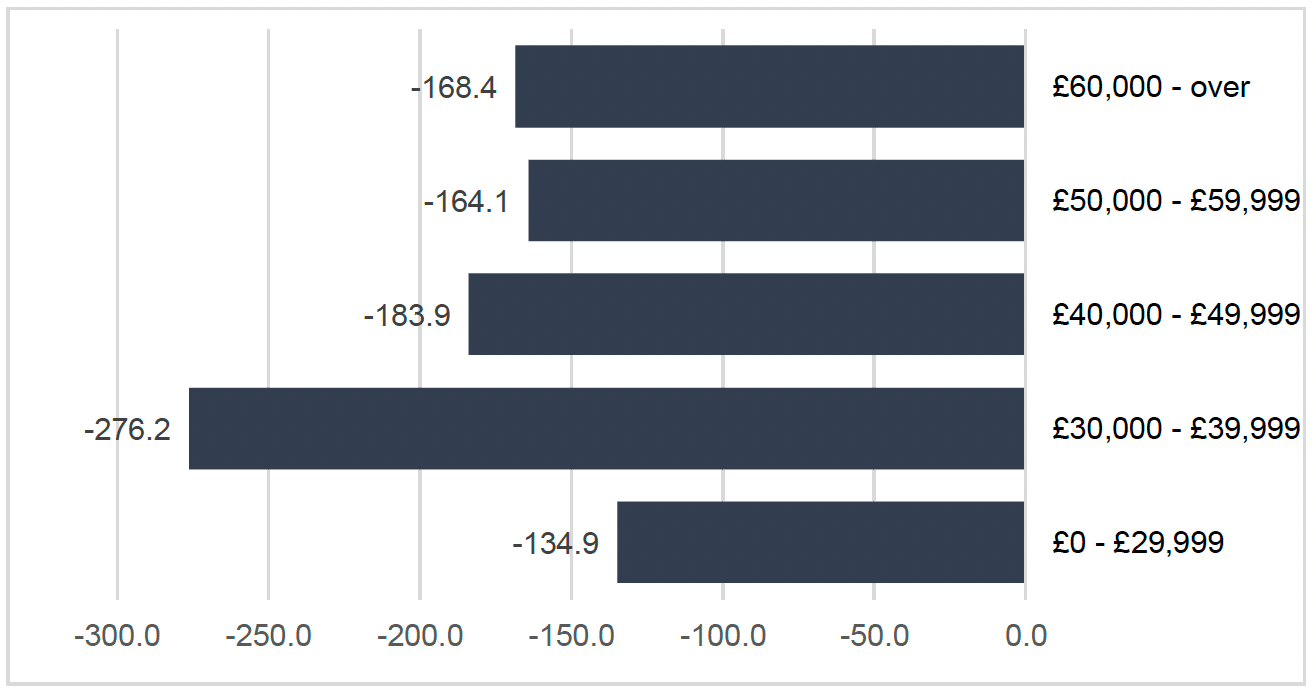
5.1. Impact by income
Potential impact by income level was examined using income quintiles, see Figure 1. Overall, all income groups were estimated to consume fewer calories under the policy on average. There was a non-linear impact across the income gradient. The greatest reduction was in the income group £30,000-39,0000 (quintile 2) with an average reduction of 276 calories per person each week. The least impact was seen on those in the lowest income quintile, earning less than £30,000 per year, with an average reduction of 135 calories per person each week.
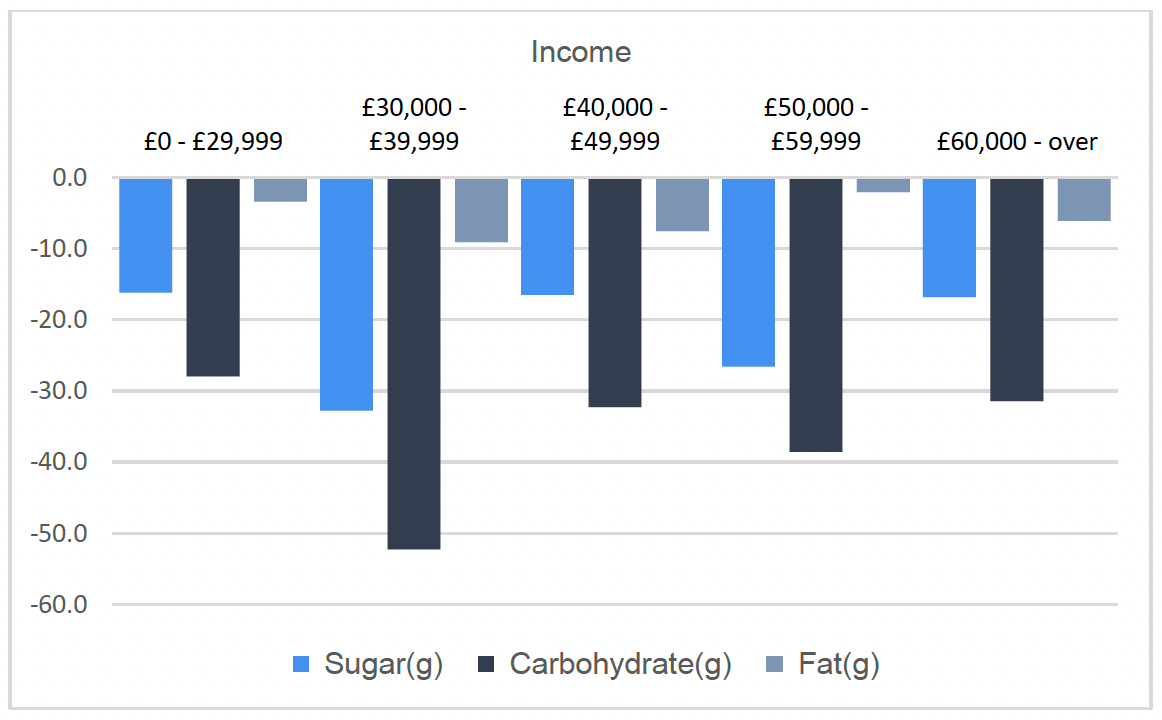
A similar impact was observed on major nutrient groups (Figure 2) as for calories. People earning less than £30,000 were estimated to consume 16 grams less sugar, 27.8 grams less carbohydrates and 3.5 grams less fat per person each week on average.
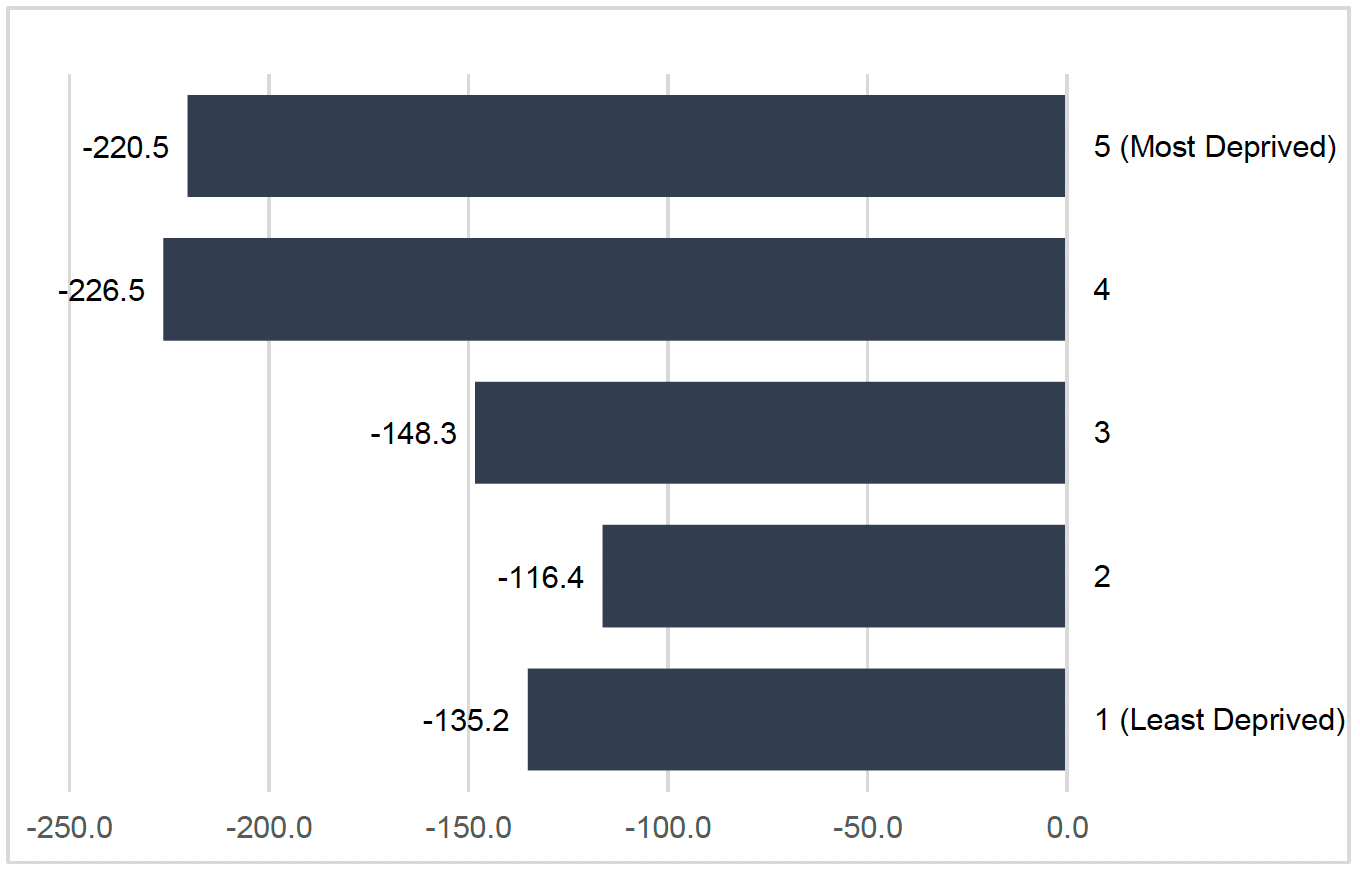
5.2. Impact by SIMD
By SIMD, all groups were estimated to consume fewer calories per person each week on average due to the policy. There was a nonlinear impact, although Figure 3 shows a deprivation gradient, with those in the least deprived quintiles reducing calorie consumption the most on average. The greatest reduction was seen in quintile 4 with a reduction of 226.5 calories per person each week on average.
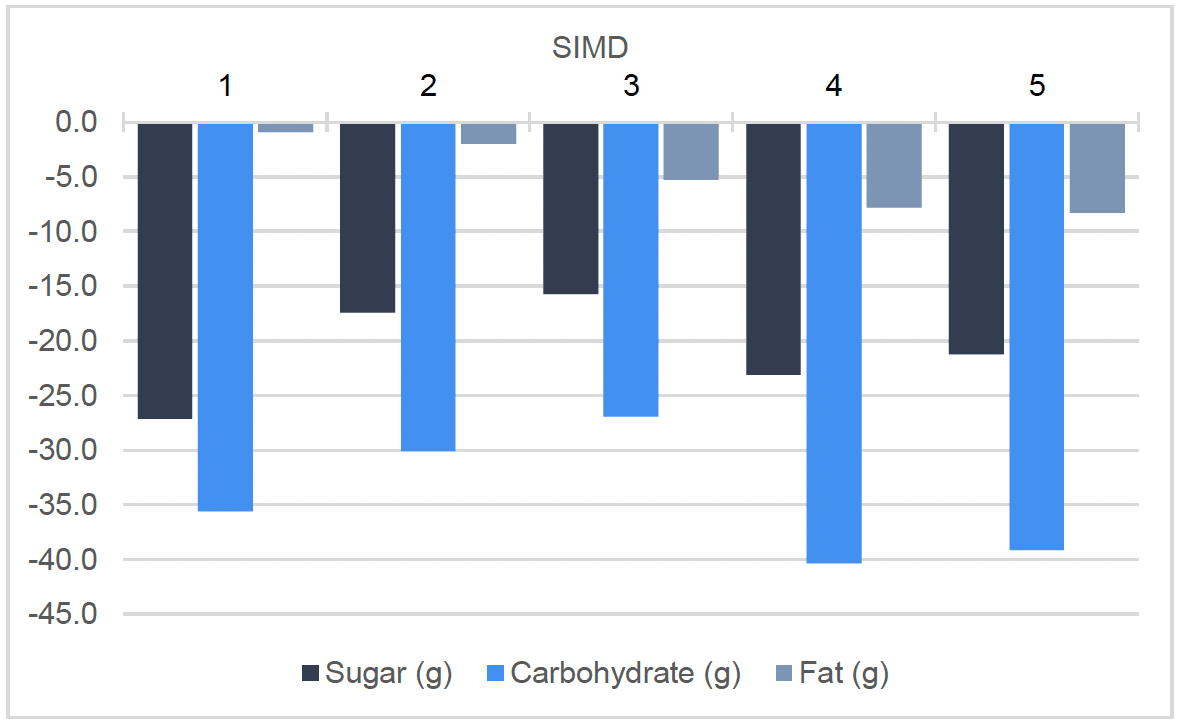
People in the most deprived SIMD group (quintile 1) may be expected to consume 27.1 grams less of sugar, 35.6 grams less of carbohydrates and 0.9 grams less of fat on average per person each week, see Figure 4.
While those in the most deprived quintile were estimated to reduce sugar consumption the most, those in the least deprived quintile may be expected to reduce fat consumption by the most (8.3 grams) on average per person each week.
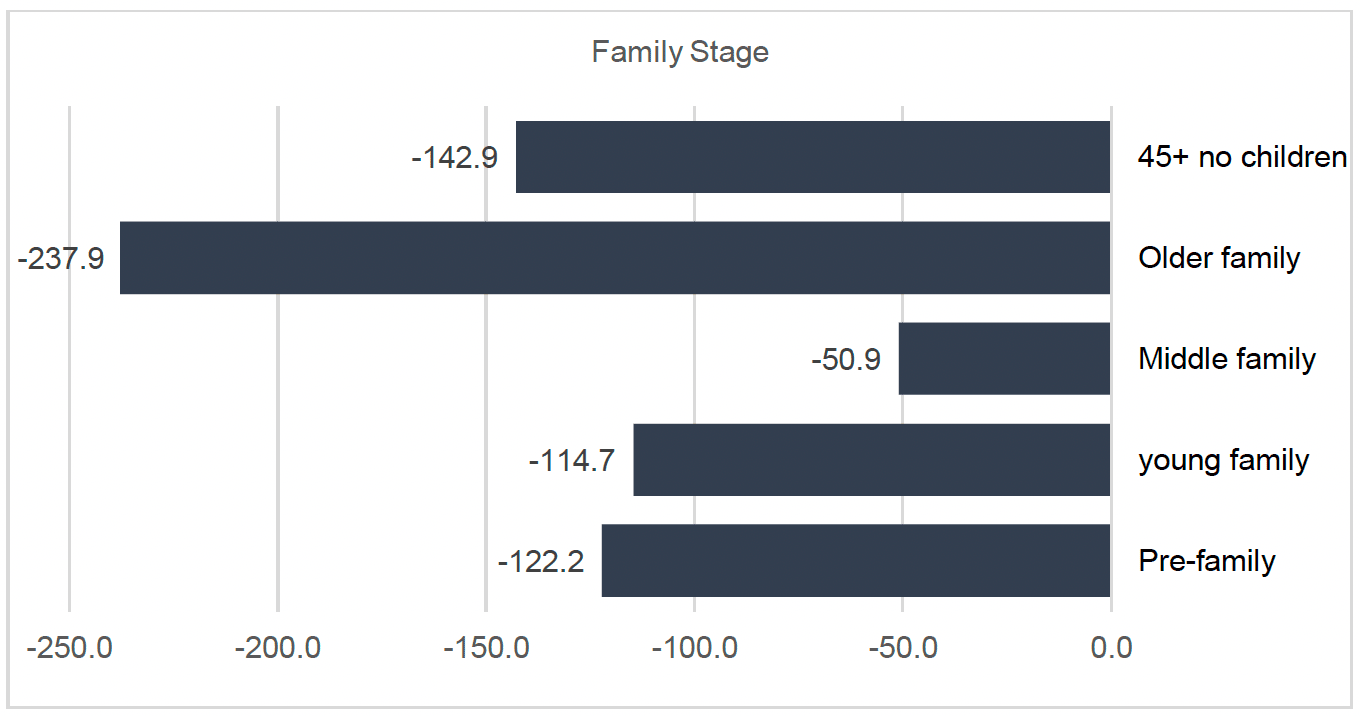
5.3. Impact by Family Stage
Older families[6] were estimated to have the greatest reduction in calories on average: 237.9 calories per person each week (Figure 5). The lowest impact was estimated for those classed as middle family. Those who are in pre family stages are expected to consume on average 188 grams less of sugar, 27.2 grams less of carbohydrates and 3.8 grams less of fat per person each week.
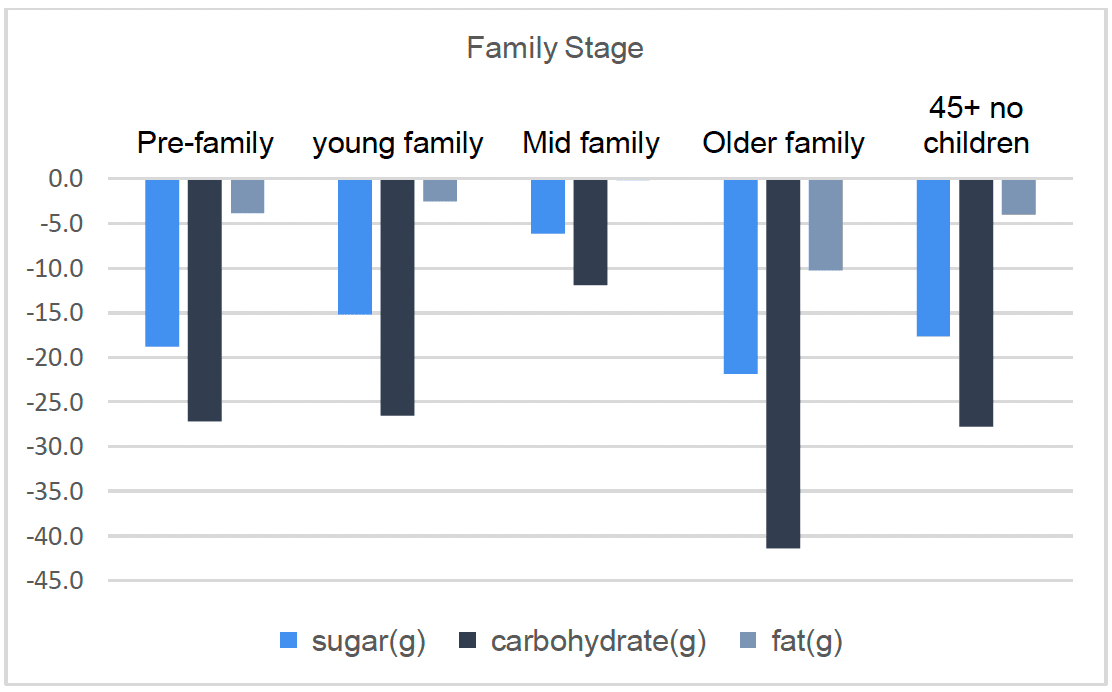
Older families were estimated to have the greatest reduction across the board, with an average reduction of 21.9 grams of sugar, 41.1 grams of carbohydrates and 10.3 grams of fat per person each week. Middle families are estimated to have on average the smallest impact on major nutrient consumption, with a reduction of 6.2 grams of sugar, 11.9 grams of carbohydrates and 0.1 grams of fat on average person each week. See figure 6 below.
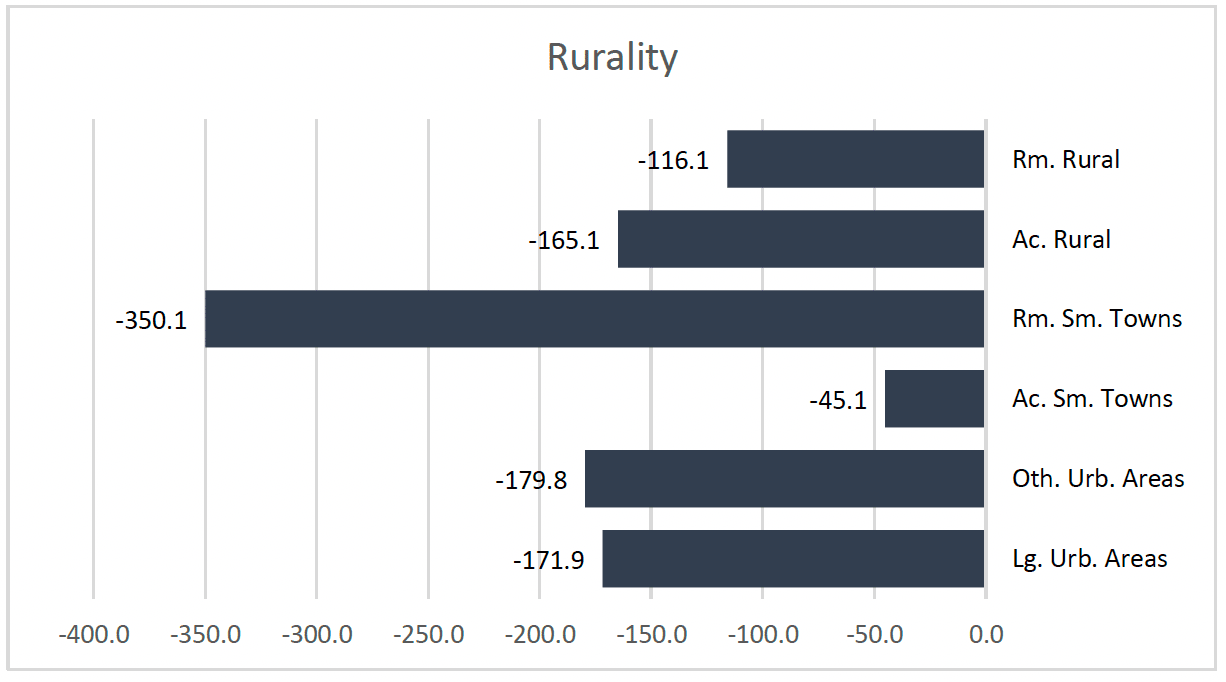
5.4. Impact by Rurality
Analysis by level of rurality[7] used the following categories: Remote Rural, Accessible Rural, Remote Small towns, Accessible Small towns, Other Urban Areas and Large Urban Areas.
The impact on calories purchased was greatest in Remote Small Towns, reducing consumption by 350.1 calories per person each week on average, and the smallest reduction was in Accessible Small Towns of 45.1 calories per person each week on average. See figure 7 below.
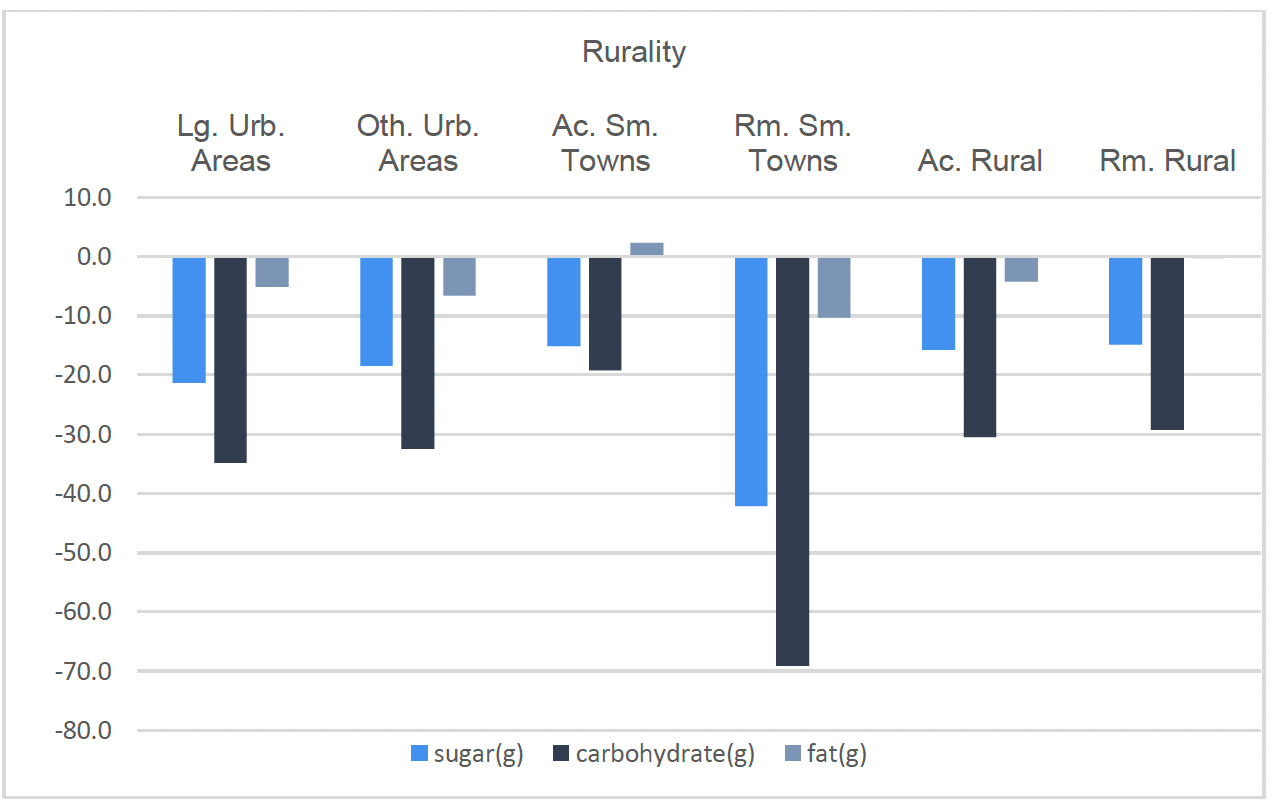
People in Large Urban Areas were expected to consume 21.3 grams less of sugar, 34.8 grams less of carbohydrates and 5.1 grams less of fat on average per person each week. Rural Small Towns saw the greatest reduction overall with 42.1 grams less of sugar, 69.1 grams less of carbohydrate and 10.3 grams less of fat on average per person each week. See figure 8 below
Contact
Email: DietPolicy@gov.scot