Building standards - ventilation guidance: research
Research to investigate whether changes made to the building standards guidance in 2015 (standard 3.14) have resulted in better occupant interaction with the dwellings natural ventilation components and improved levels of indoor air quality within the dwelling.
Part of
6. Detailed IAQ monitoring study
Aims and objectives
6.1. The aim of the detailed IAQ monitoring is to capture granular data on occupancy and behaviour. This includes the use of additional and specific pollutant monitoring equipment (see below section "Description of monitoring set up" for details). Detailed analysis of this data will examine the effectiveness of the regulatory measures that have been installed. This will provide information including indicative ventilation rates, comparison with threshold levels of IAQ, pollutants and environmental conditions such as temperature and moisture. It will also compare with this occupant comfort and energy use. It will use the data to examine use and effectiveness of the CO2 sensor, occupant awareness, behaviours and examine impacts on IAQ and ventilation.
Homes selection and description
6.2. The original idea was to deploy such sensors in 4-6 selected homes to identify specific risks or activities (for instance, homes identified as poorly ventilated from WP3).
6.3. The seasonal (winter) report from the monitored data found various homes at medium and high risk of poor IAQ. Out of 6 homes performing poorly (i.e. homes with measured bedroom CO2 levels above the 1000 PPM threshold for most of the time) only 2 homes (H13 and H14) were included in the detailed monitoring. This is because some occupants were unavailable at the time of monitoring setup.
6.4. The detailed monitoring included a valuable mixed sample of homes whose seasonal (winter) analysis of seasonal results, typologies, and CO2 monitors, as show in figure 6.1.
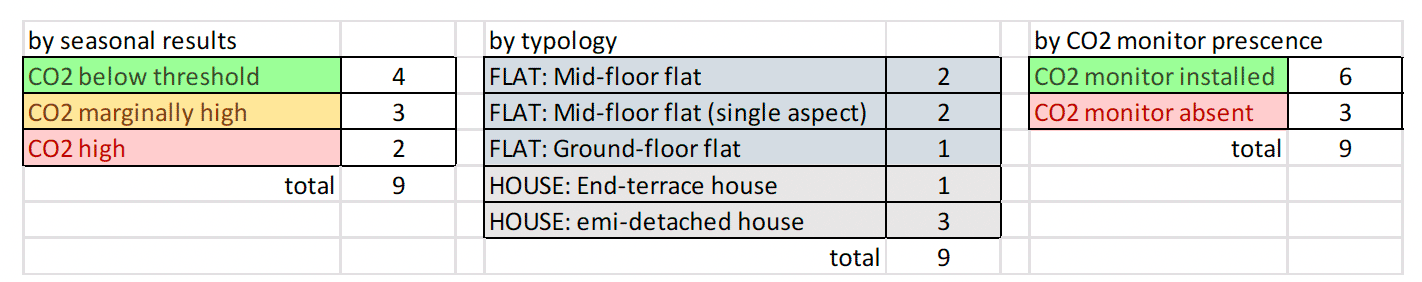
6.5. It should be noted that among the well performing homes (i.e. homes with measured bedroom CO2 levels below the 1000 PPM threshold for most of the time, from the winter analysis) there is one Passivhaus flat and one single aspect flat with a smoker. The interest in performing short term monitoring of the Passivhaus flat is to assess the effect of the constant provision of fresh air through the inlets provided in bedrooms and living rooms on indoor pollutant concentrations. The single aspect flat with a smoker, on the other hand, provides an insight of a flat categorised as "well performing", though this result is influenced by the constantly open windows to remove smoke and odours.
| Home ID | Carbon dioxide (CO2 ) monitor | Postcode | Property Type | Dwelling Type | Total floor area (m2) | Air Tightness (design) | Air Tightness (tested) | Mechanical Ventilation |
|---|---|---|---|---|---|---|---|---|
| 1 (ex RR983) | No | G32 7BS | Flat | Mid-floor flat | 76 | 0.4 | MVHR | |
| 2 (ex RR1211) | yes | G43 1FF | Flat | Ground-floor flat | 69 | 4 | dMEV | |
| 3 (ex RR991) | No | G32 7BS | Flat | Mid-floor flat | 55 | 4 | dMEV | |
| 4 (ex RR1628) | No | G78 2BF | House | End-terrace house | 74 | 4.5 | dMEV | |
| 9 (ex RR12) | Yes | EH11 3US | Flat | Mid-floor flat | 72 | 4.5 | dMEV | |
| 11 (ex RR1560) | Yes | G73 2DS | Flat | Mid-floor flat | 51 | 4 | dMEV | |
| 12 (ex RR1386) | Yes | G53 6ER | House | Semi-detached house | 95 | 4 | dMEV | |
| 13 (ex RR1351) | Yes | G53 6EH | House | Semi-detached house | 95 | 4 | dMEV | |
| 14 | Yes | G46 8AZ | House | Semi-detached house | 96 | 4.5 | dMEV |
Description of monitoring set up and survey process
6.6. The monitoring set up consisted of the following three steps:
STEP 1 – Consent. Before beginning with any form of data collection, and in line with the ethical procedure put in place by the University of Strathclyde, researchers obtained signed consent from occupants for this specific detailed monitoring.
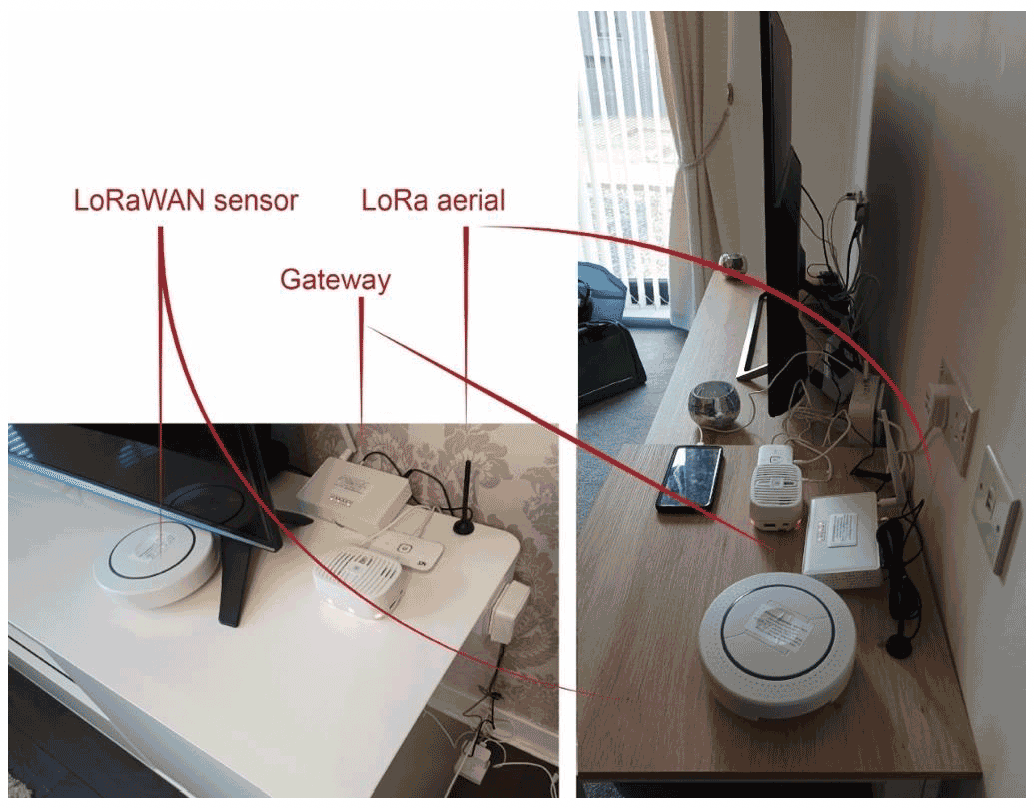
STEP 2 – Environmental Monitoring installation. The equipment used was provided by the company Duomo Ltd, marketed as LoRaWAN Wireless Indoor Air Quality Sensor. It is composed by a LoRawan multi sensor, a LoRa aerial and a gateway. The sensor measures temperature, relative humidity, carbon dioxide levels, pressure, tVOCs, PM1, PM2.5, PM4, PM10 and Typical Particle Size. These factors are monitored at 5-minute intervals. The equipment was installed only in the living rooms (i.e. one sensor per home). Equipment was placed near the TV for space convenience and to make sure that no sources of heat would affect readings. As for the long term monitoring, sensors were placed without drilling into walls and all equipment contained a label with a house code and the researchers contact details (see figures below).
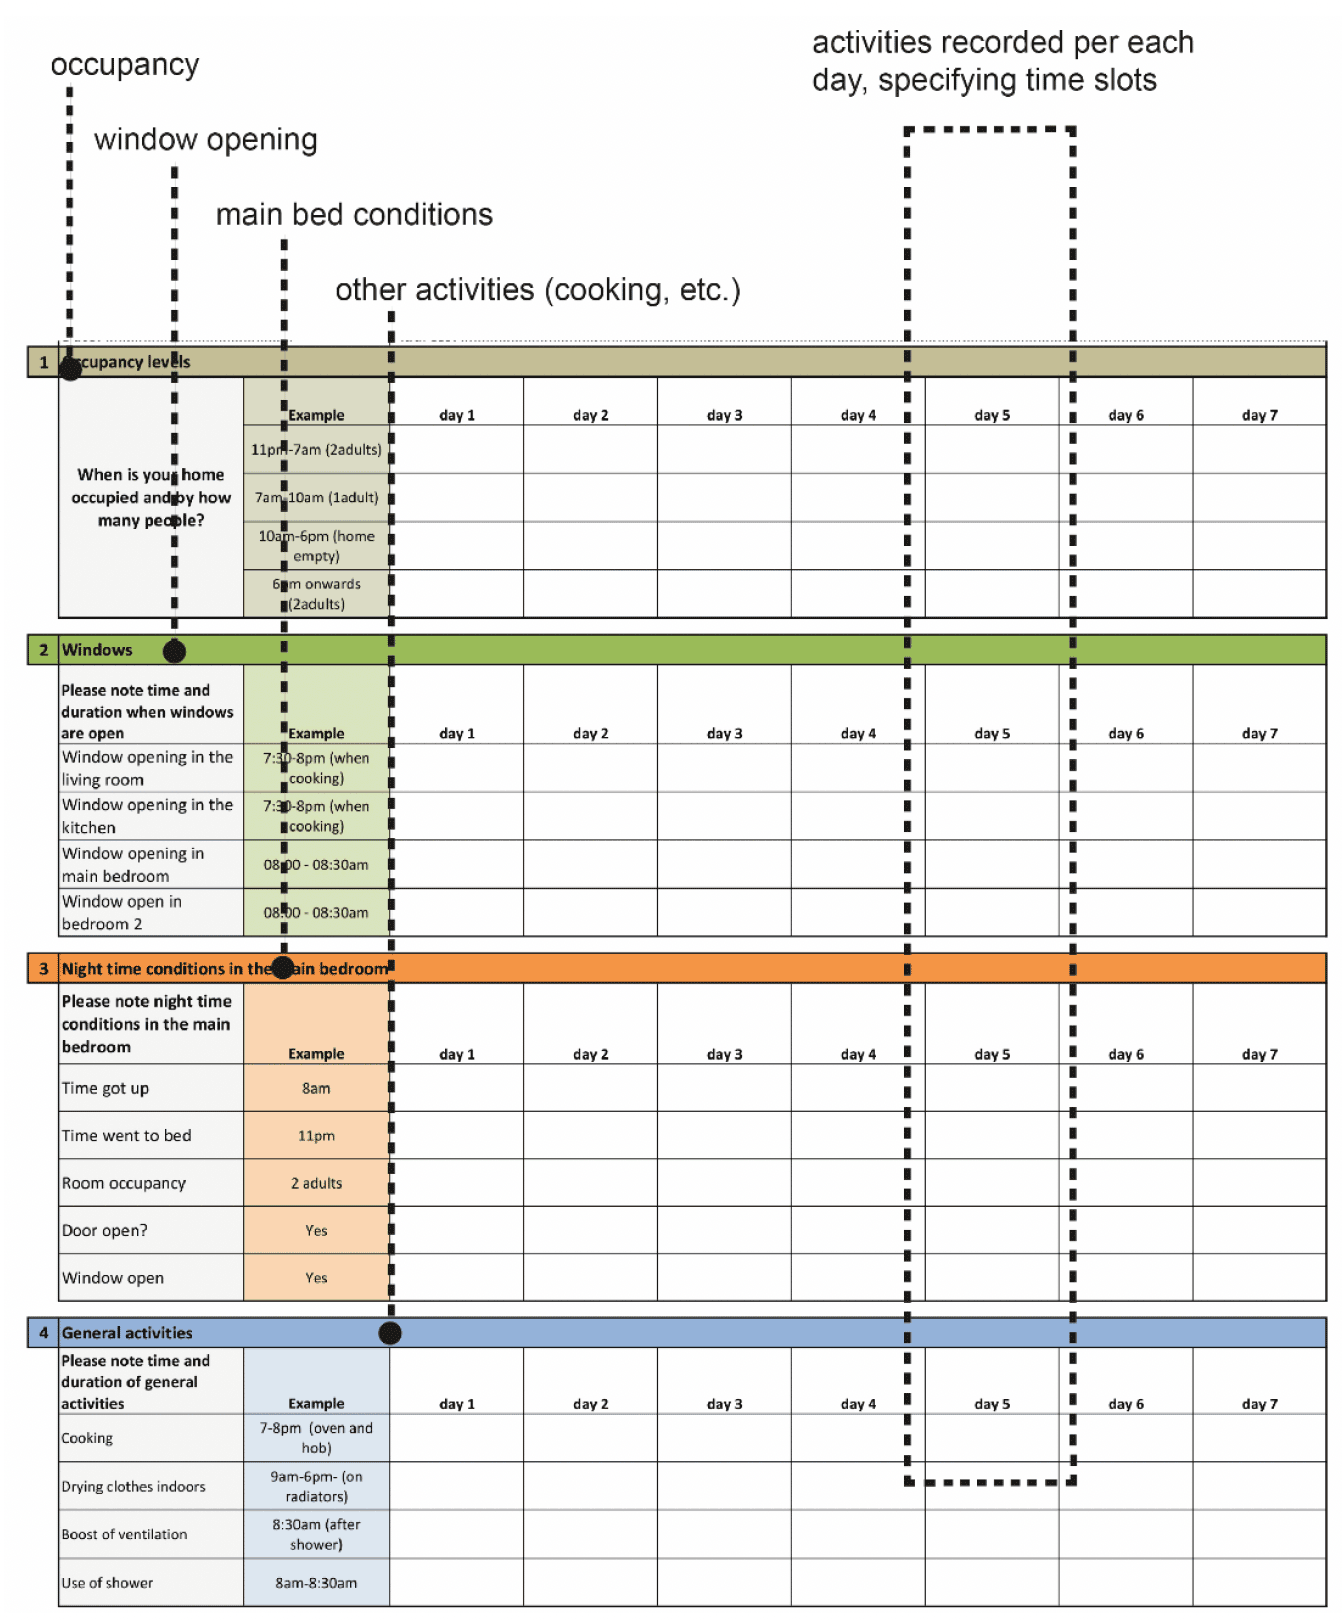
STEP 3 – Occupant diaries. This step consists of the production of daily diaries for occupants that identify ventilation habits and activity for specific spaces. Occupant diaries were disseminated to occupants and occupants were briefed on how to complete these. A total of 3 copies were left in each home.
The occupant diary (figure 36) contained detailed daily questions about:
- dwelling occupancy;
- room window opening;
- main bedroom conditions: occupancy, night-time window and door opening;
- a general activities section, to record activities such as cooking, showering, drying clothes, etc.
- additionally, a blank space was provided to add any additional activity the occupants may want to highlight.
6.7. The use of occupant diaries were instrumental in identifying whether occupants use of the alert system affected their awareness and use of ventilation, and whether this had resulted in improvements to indoor air quality in their home. Monitors were collected after the measurement period, along with the occupant diary.
Analysis
6.8. Analysis was carried after the monitors and diaries were collected. The aim was to identify poor indoor air quality in the surveyed homes, to examine pollutants presence in relation to the diaries and to examine the correlation between behaviour variables and measurements. Graphical summaries of key observations and findings were produced.
| Pollutant | Recommendations related to health WHO air quality guidelines 2005 guidelines - UK regulations - CIBSE TM40 recommendations | short term threshold used |
|---|---|---|
| PM10 |
(Reduce as much as possible, as no safe level is known) |
50 μg/m3 |
| PM2.5 |
(Reduce as much as possible, as no safe level is known) |
25 μg/m3 |
| Formaldehyde (a VOC) | 100 μg/m3 - 30-min average | (included in TVOCs) |
| TVOC (as indicator) | 300 μg/m3 - 8-hour average | 300 μg/m3 |
6.9. Several previous studies have shown that CO2 levels are directly correlated with TVOCs and negatively correlated with PM10 levels[23] [24]. While good indoor air quality requires relatively high ventilation rates, if the external air is heavily polluted with PM10, the challenge is reducing the concentration of pollutants of indoor origin while inhibiting the infiltration of external air pollutants, especially at locations where external particulate burdens are high (main road junctions where traffic may be regularly queuing).
6.10. The sub-set of 9 dwellings that underwent more detailed monitoring were selected to provide some comparisons between rural and urban locations and house type/ventilation regimes (4 dwellings were selected with relatively low CO2 levels and 5 dwellings with CO2 levels regularly on/exceeding the 1000ppm threshold). With such a small sample and a multiplicity of confounding variables (volume, occupant behaviour (smoking), construction type, location, air tightness, orientation, cooking facilities (gas v electricity) and furniture, fittings and fixtures), any comparison between data sets should not be considered as statistically significant and extrapolations or generalisations should therefore be avoided. The monitoring was restricted to 14 days in March/April and external weather conditions may also have had an impact on occupant behaviour. The effects of outdoor temperature and wind conditions, that can play a major part in particulate concentrations, were not monitored and therefore any possible impacts cannot be accounted for in the analysis. The data sets do, however, give some insight into the relationship between internal air change rates, pollutants being generated internally and those that may be infiltrating from external sources (fuel combustion).
Results
6.11. The complete survey results can be found in Annex D.
6.12. In general, the dwellings maintained CO2 levels below the target threshold of 1000ppm and the relationship between CO2 and TVOC concentrations was found to be closely correlated. The relationship with PM levels however is more complex as several dwellings had a combined living/kitchen configuration and particulate matter from cooking (either smoke or gas combustion) produced a notable rise in the levels around meal times.
Example 1: H1
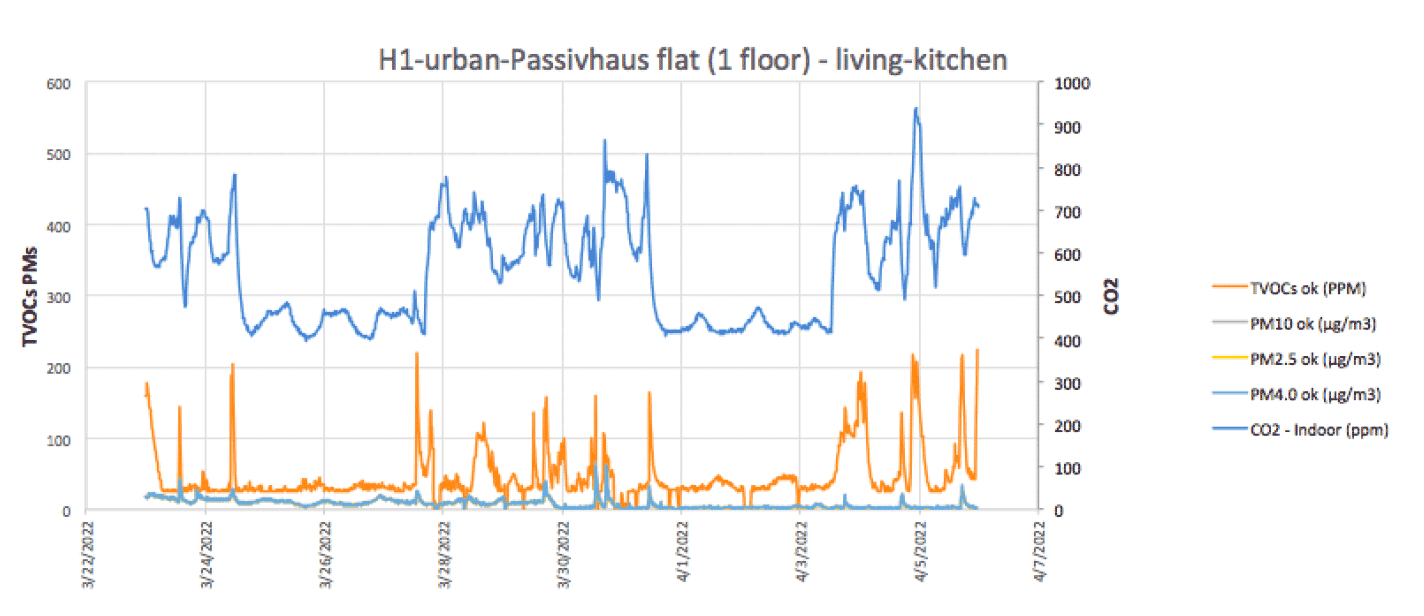
6.13. The graph shows that the whole house ventilation system maintained CO2 levels well below the threshold for poor IAQ of 1000ppm. The occasional peak in TVOC levels closely followed CO2 concentrations and occurred during typical mealtimes. PM10 levels were relatively low in this home despite it's urban location, suggesting that the MVHR system had an effective air filter. Although there is no known safe threshold for PM10 levels, the average concentration was well below the 20 ug/m3 benchmark, with levels only rising above the short term 50 ug/m3 for circa 30 minutes over the entire 14-day period, and this is again likely to be associated with cooking activities. The MVHR system maintained CO2 levels well below the 1000ppm threshold. This is in contrast to the dMEV systems, that did not appear to be quite as effective.
Example 2: H13
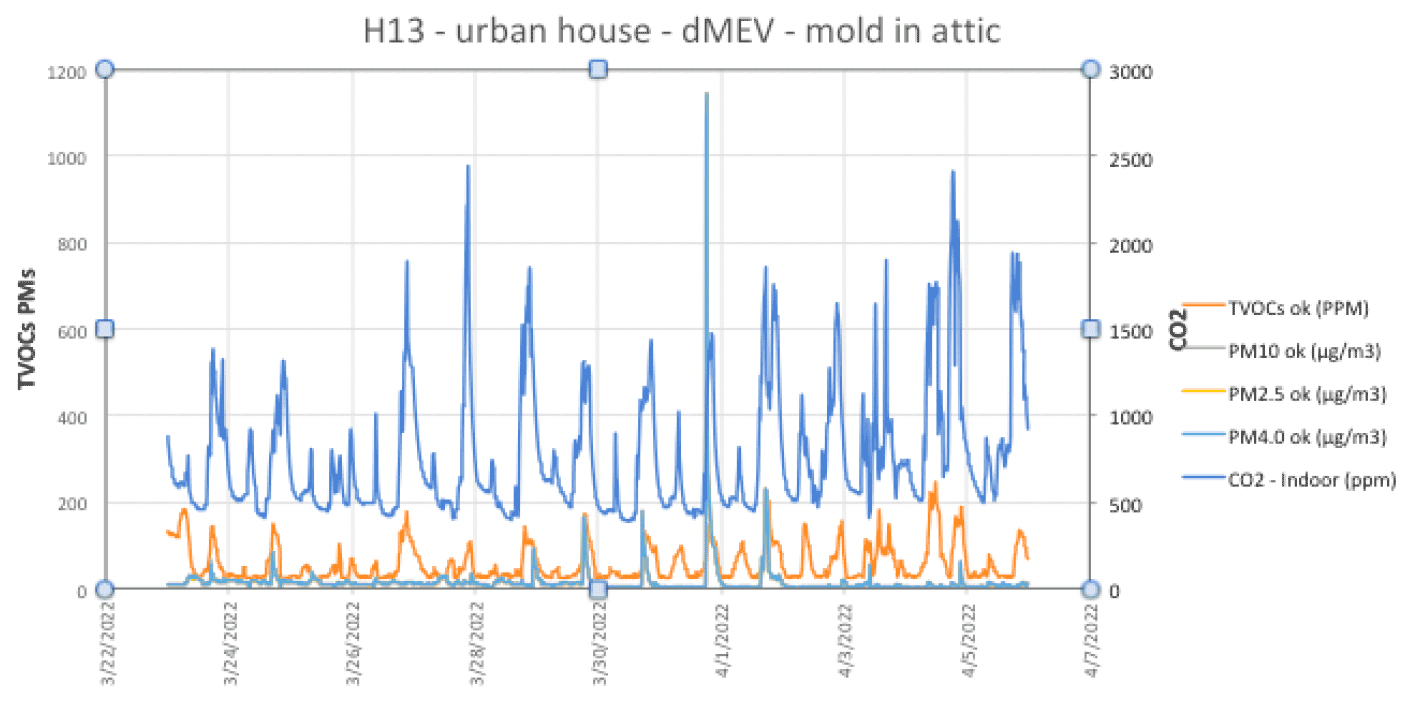
6.14. The graph shows that the dMEV system in H13 was unable to keep the CO2 levels consistently below the threshold of 1000ppm (average 875 ppm) with many peaks above 1500ppm. H13 was unoccupied for most days during 8.30 until 3 pm. TVOC levels closely followed CO2 concentrations and peaked when cooking activities were being undertaken. PM10 levels were low for an urban environment and associated with cooking times. This would suggest that the major source of particulate matter in this home was smoke from cooking or methane combustion.
Example 3: H11
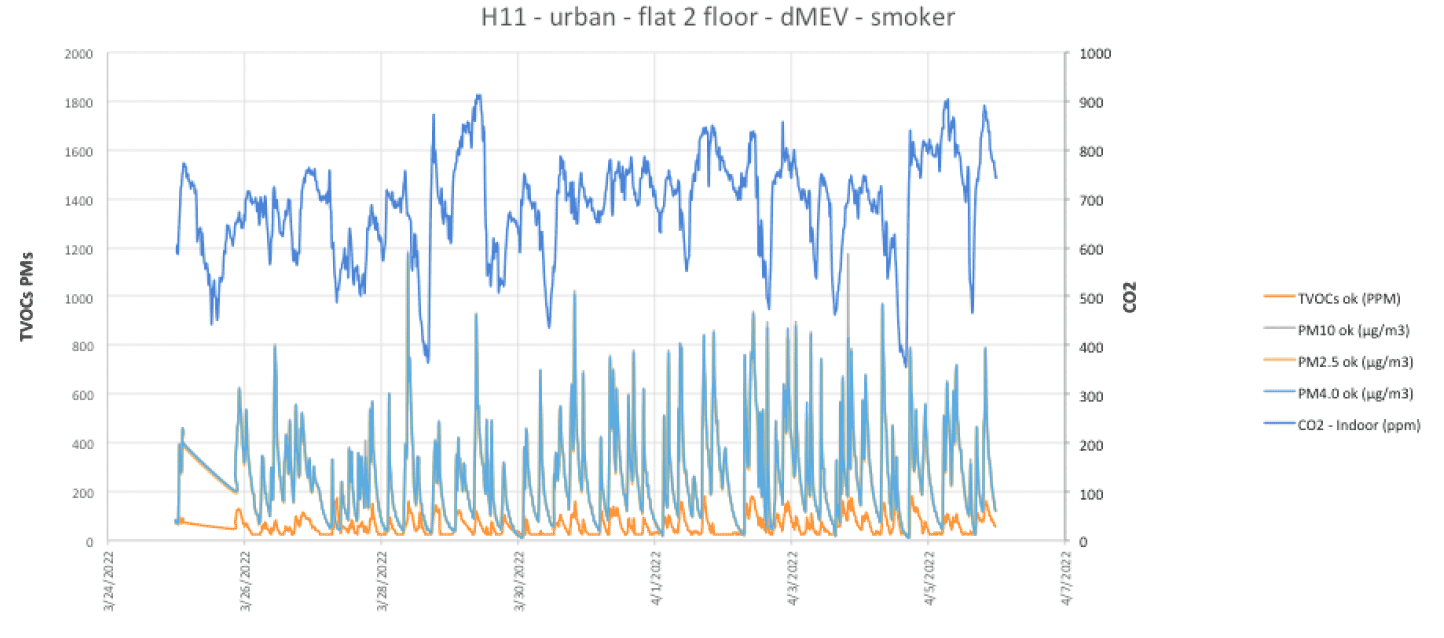
6.15. H11 was occupied at all times during the detailed survey. Windows were reported to be open 24/7 to mitigate the occupant's heavy smoking habits (there is no specific information on times smoking occurred indoors). No specific information was collected to times when the occupant smoked. Smoking in H11 is clearly a major factor affecting PM10 concentrations despite the ventilation system maintaining CO2 below 1000ppm. Air change rates would therefore have to increase significantly to extract this level of internal particulate pollution.
Example 4: H14
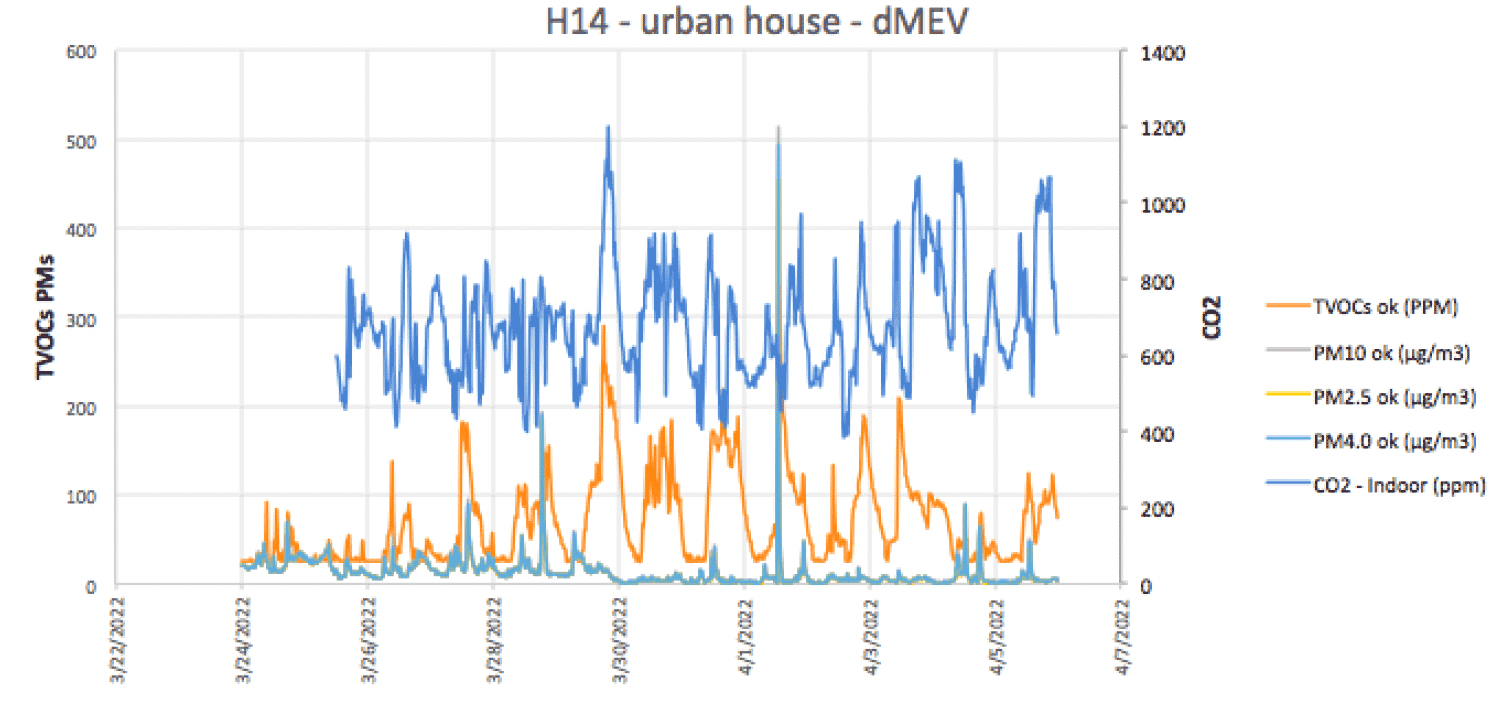
6.16. Most of the dwellings under the more detailed monitoring regime have TVOC levels that would be considered to be relatively low (i.e. under 300ug/m3). As many dwellings have open plan kitchen and living rooms, the levels tend to rise when cooking is taking place as VOCs copen plan kitchen or living room and TVOC levels have a closer correlation with CO2. When the CO2 level reaches 1000ppm we can note that TVOC levels are on occasion approaching the 300ug/m3 threshold.
Summary – What can we take from these results?
6.17. MVHR and dMEV systems are relatively effective in maintaining internal CO2 levels below the target threshold of 1000ppm.
6.18. TVOCs are positively correlated with CO2 however, levels were generally below the recommended threshold of 300 ppm. It is worth noting that TVOC cannot provide an indication of health effects, as it doesn't measure VOCs individually.
6.19. The PM levels did not have a particularly strong negative correlation with CO2 levels across all 9 dwellings. This would suggest that external traffic pollution was not a major factor over the monitoring period due either to the dwellings' suburban locations or relatively high wind speeds effectively dispersing localised traffic fumes. The particulate matter, if anything, had a positive correlation during periods where cooking was likely to be taking place. This of course could be dealt with by better wet zone extraction (cooker hoods).
Future research
This small sub-set did not demonstrate a problematic negative correlation between PM10 particulates and air change rates than many studies have shown to be in operation in heavily polluted urban environments (see literature review). It remains unclear as to whether this was primarily due to the dwellings location and external weather conditions dispersing pollutants. There were no significant differences between the urban and rural dwellings. This result requires further measurement to compare urban and rural locations and classify the type of particulate matter and VOCs that may be both infiltrating and off-gassing.
Contact
Email: buildingstandards@gov.scot