Building standards - ventilation guidance: research
Research to investigate whether changes made to the building standards guidance in 2015 (standard 3.14) have resulted in better occupant interaction with the dwellings natural ventilation components and improved levels of indoor air quality within the dwelling.
Part of
3. Literature review
Background and context
3.1 The University of Strathclyde has been commissioned to undertake research to identify whether the changes to the 2015 Building Standard (Scotland) Regulations, that required the installation of CO2 monitors, has produced any changes in occupant behaviour regarding the opening of trickle vents, windows and/or internal doors. This is founded on the fundamental principles enshrined in Section 3.14 of the Technical Standards that, "Every building must be designed and constructed in such a way that ventilation is provided so that the air quality inside the building is not a threat to the building or the health of the occupants."
3.2 This investigation represents the third phase of research into indoor air quality (IAQ) that has attempted to quantify the impact increasing building envelope air tightness standards, have had on background air infiltration rates. The previous report (Sharpe, 2014) was founded on research work (Sharpe, 2015) (Howieson, 2014) into low ventilation rates in contemporary Scottish dwellings that confirmed high levels of CO2, particularly in bedrooms. This literature review adds to the introduction that prefaced the 2014 report and will attempt to survey, synthesize, analyse and present our current understanding of the cognate area.
3.3 The research undertaken in Scotland built on investigations in England (Raw GJ, 2004, Davis, 2008; Crump, 2009) and Europe (Stranger, 2012; Kaunelienė, 2016) that highlighted the drive for energy efficiency by reducing ventilation rates through the mechanism of increasing the building fabric's air tightness, was likely to lead to a significant reduction in IAQ with potential implications for long term public health. The 2014 research was therefore designed to measure the impact on IAQ in contemporary dwellings, where trickle vents in conjunction with intermittent mechanical wet zone extraction, was the sole ventilation technique to be employed.
3.4 The 2014 report (Sharpe, 2014) confirmed that there was minimal occupant interaction with the trickle ventilators (i.e. 63% were always closed and 28% always open in bedrooms). In only 9% of cases did the occupants intervene to make occasional adjustments. In a sub-set of dwellings that were the subject of more detailed monitoring, average bedroom CO2 levels of 1520 ppm during occupied (nighttime) hours were observed. Where windows were open the average bedroom CO2 levels were 972 ppm. With windows closed, the combination of 'trickle ventilators open plus doors open' gave an average of 1021 ppm. 'Trickle ventilators open with doors closed' gave an average of 1571 ppm. All other combinations gave averages of 1550 to 2000 ppm. Ventilation rates and air change rates were estimated from measured CO2 levels, calculated the ventilation rate was less than 8 l/s/p in all dwellings, with 42% of cases having air change rates less than 0.5ach-1. The report concluded that trickle ventilation with occasional wet zone extraction does not provide an effective strategy to protect against poor IAQ.
3.5 This was in line with two previous studies undertaken in Scotland (Sharpe, 2015; Howieson, 2014) that confirmed a significant reduction in air infiltration rates through the building fabric, have had a deleterious effect on IAQ, with indoor CO2 levels in new dwellings monitored at concentrations approaching 5000ppm. These studies provided an evidence base to stimulate a change to the standard that was designed to address - or at least ameliorate - the concerns surrounding poor IAQ, that is likely to be particularly acute in single aspect, small, flatted dwellings with high occupancy densities.
3.6 In 2015 a new requirement was embedded in the Building Standards (Scotland) Regulations, Technical Standards (Domestic), in an attempt to address the issue of poor IAQ in modern air-tight dwellings, that was designed to inform the occupant when IAQ was deteriorating, and it was hoped would stimulate action to increase ventilation rates (opening windows and internal doors):
"The regulation requires CO2 monitoring equipment to be provided in the apartment expected to be the main or principal bedroom in a dwelling where infiltrating air rates are less than 15m3/hr/m2 @ 50 Pa. This should raise occupant awareness of CO2 levels (and therefore other pollutants) present in their homes and of the need for them to take proactive measures to increase the ventilation. Guidance on the operation of the monitoring equipment, including options for improving ventilation when indicated as necessary by the monitor, should be provided to the occupant."
3.7 The standard did not prescribe the specifics of the guidance; however an associated reference (Scottish Gov., 2017) provided the following recommendations for occupants with advice being given using a 7point scale:
- CO2 level - Action
- 0-349ppm - Check monitor is working
- 350-779ppm - Do nothing
- 800-999ppm - No immediate action
- 1000-1199ppm - Partially open trickle ventilators or open door
- 1200-1499ppm - Fully open trickle vents or open door
- 1500-1999ppm - Partially open window
- Over 2000ppm - Open window and door
3.8 Although these recommendations may be considered to lack specificity, the monitor's primary function was to act as an IAQ 'traffic light'. CO2 levels were to be used as a proxy metric to stimulate occupants to take action to increase internal air movement within the dwelling or to introduce external air via adjustable trickle vents or opening windows. These instructions are offered on the presumption that the installed windows have the facility to be held firmly in a partially open position, to ensure that they remain unaffected by capricious wind action.
3.9 The research protocol and methods to be adopted must therefore take into account a variety of confounding variables and be designed to answer the following questions:
1. Has the dwelling been built to the specified air tightness standard i.e. below 15m3/hr/m2@50 Pa?
2. Has the monitor been installed in the recommended location and position?
3. Have the occupants been provided with appropriate guidance?
4. Have the occupants understood the guidance?
5. Have the monitors encouraged behavioural change re. window/door opening?
6. Have these changes in behaviour produced the required improvement in IAQ (i.e. CO2 levels been maintained below the 1000ppm target threshold)?
Background
3.10 In 1992, Perera (1992) put forward the concept of 'build tight- ventilate right'. This was a proposition that dwellings should be designed and constructed to be as tight as practicable and incorporate a 'planned' ventilation strategy. The paper emphasised that a building cannot be too 'air-tight', but it can be under ventilated. This approach built on a BRE publication (Building Research Establishment, 1995) that claimed there was wide acceptance that a whole house ventilation rate of 0.5ach-1 - supplemented by mechanical air extraction during cooking and bathing - was sufficient to dilute indoor pollutant concentrations and suppress relative humidity below 70% - a threshold associated with condensation and mould growth. The view was re-confirmed in 2012, in the 2014 study report commissioned by Building Standards Division (BRE, 2012). Subsequent work by the University of Strathclyde (Howieson, 2014) however highlighted aspects of the testing regime undertaken at the BRE HQ in Watford, which undermined the view that trickle vents alone could ensure 'healthy' IAQ in 'air-tight' dwellings.
3.11 It appears from these studies, that dwellings built to the new prescribed air tightness standard that rely solely on trickle ventilators supplemented with mechanical wet zone extraction, for background ventilation, do not satisfy the requirement of Technical Standard 3.14 that states:
Ventilation should have the capacity to:
- provide outside air to maintain indoor air quality sufficient for human respiration.
- remove excess water vapour from areas where it is produced in sufficient quantities in order to reduce the likelihood of creating conditions that support the germination and growth of mould, harmful bacteria, pathogens and allergens.
- remove pollutants that are a hazard to health from areas where they are produced in significant quantities.
3.12 Reducing ventilation rates to improve energy efficiency and lower carbon emissions, without providing a planned and effective ventilation strategy is likely to result in a more toxic and hazardous indoor environment, with a concurrent and significant negative long term and insidious impact on public health. The observed data from 'real life' conditions, where dwellings have been built to the prescribed Building Standards for air tightness (5m3/m2@50Pa) with trickle ventilation as the sole 'planned' ventilation strategy, produced CO2 levels indicative of poor indoor air quality.
3.13 When considered as a discrete volume, an occupied apartment will require a substantially greater ventilation rate than can be provided solely by trickle ventilators with a free vent area of 12000mm2. Air infiltration rates through trickle vents are likely to be further compounded by occlusion from curtains or blinds and where controllable they are invariably closed due to 'whistling' in high winds (Sharpe, 2015). Whilst it may be argued that elements such as occupants closing vents, or occlusion by curtains are beyond the remit of the building standard regulations (albeit that they are specified as being 'controllable'), these are nevertheless predictable behaviours which require to be addressed, on the same basis as 'safety factors' are applied in structural engineering regulations to account for occasional and/or accidental overloading.
3.14 If the CIBSE recommendation of 8l/s/p to keep CO2 at under 1000ppm (CIBSE, 2005) is applied to an occupied living room designed for 5 persons, 40l/s of ambient air (that equates to circa 150m3/hr) will have to enter, and more crucially, exit the room through the trickle vents. To drive such a flow in a room that has been designed for cross ventilation, will require an air speed of approximately 3.3m/s, equivalent to a pressure differential of 18Pa (Howieson, 2014). Where rooms have a window vent in only one elevation, cross ventilation will not occur. Without a potential exhaust route on an opposite or adjacent wall, it is difficult to conceive how trickle vents could provide anything close to 'healthy' ventilation rates, as the air will have to both enter and exit via the same opening. In still conditions where no pressure differential occurs, there will be little or no transfer and IAQ is therefore likely to deteriorate rapidly.
3.15 A study by Biler (2018) that looked specifically at the efficacy of trickle vents reported on the impact of a variety of design parameters. These were listed as: ventilation capacity, controllability, actuation, thermal insulation, air permeability, water tightness, climatic adaptation, security, and acoustic attenuation. Other important parameters in trickle vent design are positioning, equivalent area and the interaction with the occupants. It is clear from this work that the performance of trickle vents can vary markedly depending on a multiplicity of interacting factors. This undermines the view that a 'one size fits all' regulatory approach will prove adequate for all locations and dwelling typologies.
3.16 There are no specific air quality standards in the UK for residential buildings. A guide by the Chartered Institution of Building Services Engineers (CIBSE, 2005) concentrating on health issues in building services recommends that ventilation rates should never fall below 5 l/s, however, in a major literature review of a range of building types, ventilation rates below 25 l/s/p increased the risk of sick building syndrome, short term sick leave and decreased perceptions of productivity[4]. It is thus highly likely that relatively tight, energy efficient, modern dwellings will not only suffer from poor indoor air quality, but they will also be subject to progressive and cumulative increases in humidity, during the winter months if windows remain closed; an increasingly likely scenario given recent cost inflation in energy supply. Furthermore, diurnal temperature variations – particularly in lightweight construction incorporating polythene vapour barriers – will be greater, increasing overnight internal relative humidity and condensation rates, which will be absorbed by carpets, bedding and soft furnishings; the key habitat of the house dust mite; a species that produces 15 high allergenic proteins in its faecal pellets (Wright, 2009). HDM levels in new timber frame dwellings constructed since 1990 had allergen levels equal to that of the older stock signifying that the new stock has taken only 10 years or so, to develop HDM colonies that have taken over 70 years to develop in the older stock (Howieson, 2005). Howieson maintained that although dwellings have become warmer they have also become more humid allowing HDM to colonise and proliferate. It is this change in the indoor environment (from cold and draughty to warm and humid) that has driven a 6-fold increase in child asthma prevalence that has occurred in Scotland over the last 40 years.
3.17 The move towards higher insulation and greater sealing of houses from accidental and on occasion, fortuitous air leakage and infiltration rates, is projected to exacerbate the problem over the next decade where modern methods of construction such as factory sealed SIP panels are likely to be deployed in greater numbers. Improvements to fabric U-values, has resulted in ventilation now being the major route for heat losses. Increased sealing of buildings to reduce inadvertent air movement invariably leads to low air change rates that will result in:
a) Still and stale internal air
b)Increased concentrations of toxins, Volatile Organic Compounds (VOCs) and off gassing from materials and furnishings
c) Increased humidity resulting in mould growth and ideal conditions for HDM colonization and proliferation
d)Increased susceptibility to pre-disposed health issues of residents such as asthma and viral infections transmitted by aerosol concentrations (Covid-19)
3.18 Ventilation of dwellings and the requirement to do this without increasing energy use is a priority for the house building industry. Current options include natural ventilation, consisting of intermittent mechanical ventilators in kitchen and bathroom and trickle ventilators in the window frames and various forms of mechanical ventilation from continuous extract, to whole house balanced systems with heat recovery options. There appears to be a lack of interest and take up in ventilation systems within the house building industry. This possibly stems from the lack of detailed inclusion in building regulations going back to the early 1990s. Lack of industry research into ventilation strategies during this period, and a reluctance from architects and developers alike to develop planned natural or hybrid ventilation strategies has meant that the Building Standards, de facto become the default position. Given the UK government's planning prediction (Ministry of Housing, Communities and Local Government 2020) that 5 million new dwellings will be required to satisfy demographic changes, it is vital that research into the epidemiological relationships between existing domestic environments, ventilation rates and respiratory health is undertaken to inform the design specification of what amounts to a £500 billion house building programme.
3.19 In domestic environments, recommendations on ventilation are largely driven by the control of humidity levels, as well as pollutants from combustion (e.g., gas cooking hobs) and odours. Guidance can be found in CIBSE Guide A (2015) Table 1.5 and CIBSE TM60: Good Practice in the design of homes (2018) and is generally aligned with or higher than the minimum values recommended in Approved Document F (MHCLG, 2013b) (or equivalent in Scotland and Wales). These include minimum whole dwelling rates and minimum rates in kitchens and wet rooms. The recommended range in Guide A is 0.4 to 1 air changes per hour (ach) in living rooms and bedrooms, with higher extract rates in kitchens and wet rooms. These should also be checked against guidance for the control of HDM, for which 0.5 ach with regular purge ventilation (e.g., extract fans) to provide 1.3 ach to enable dilution of indoor pollutants and the expulsion of moisture build-ups particularly associated with the now common practice of internal clothes drying (Howieson, 2005; Porteous, 2013).
3.20 Exposure to air pollutants can have both acute and chronic health effects, from mild to severe and pollutants may or may not be perceived by occupants (Wargocki, 2002). The likelihood and severity of effects occurring depends on age, pre-existing medical conditions and individual sensitivity. The effects can also include temporary discomfort and annoyance from odours, and from some pollutants can have negative impacts on cognitive performance (Dimitroulopoulou 2015a&b). The UK for instance has seen the market for 'air fresheners' significantly increase over the last 20 years. The primary function of these products is not to freshen but to mask odours, by introducing more pungently odoriferous compounds, some of which contain VOCs.
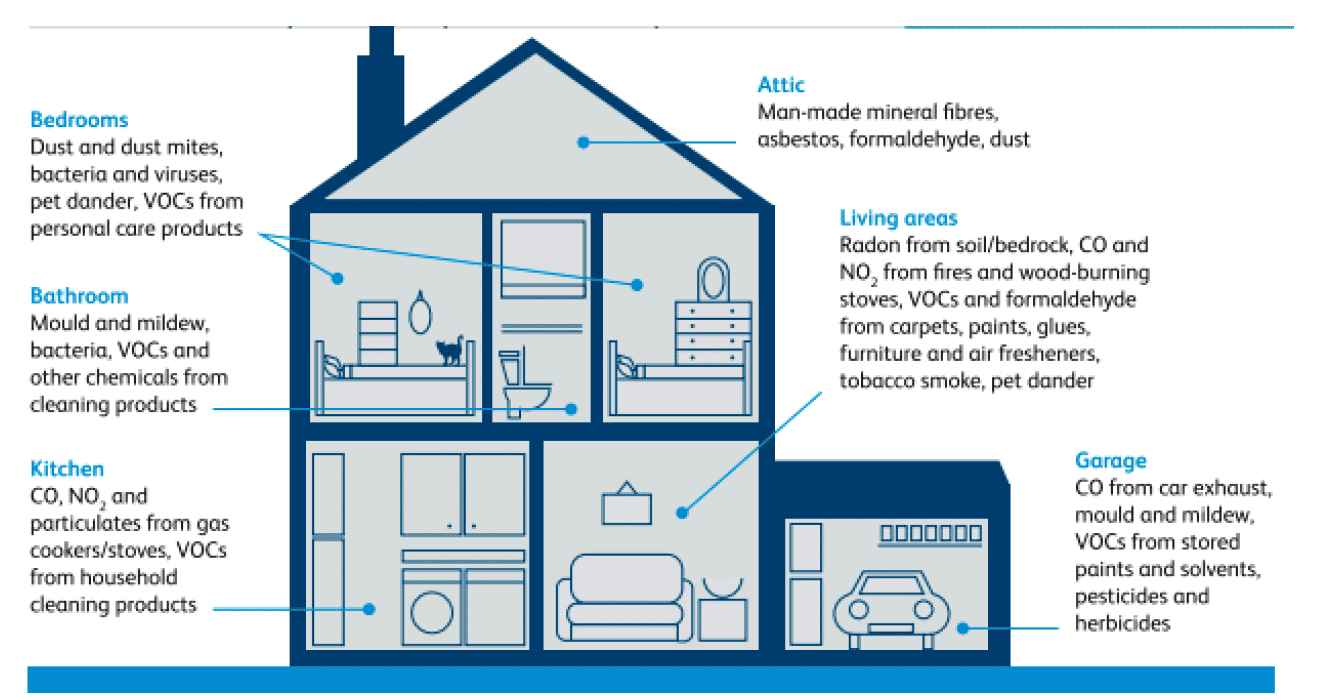
3.21 Indoor air quality is also associated to a large extent with outdoor air pollution. The indoor environment contains many sources of air pollutants from building materials, consumer products, occupants and their activities. Occupants are therefore exposed to a mixture of pollutants (Dimitroulopoulou, 2015; Trantallidi, 2015; EC, 2014; RCP, 2016), as illustrated in Figure 9.1. These compounds can of course act in additive, antagonistic and synergistic combinations. Indoor sources have become more significant as airtightness standards have become more exacting in recent years. Substantial work has been done over the past few decades to assess the health impacts of outdoor air pollutants, and this work has placed increasing emphasis on indoor sources of pollution. Exposure to air pollution has health effects at every stage of life. The symptoms may develop gradually as a result of long term or repeated exposure. Overall, the World Health Organization (WHO) estimates that approximately seven million people worldwide die each year as a result of air pollution exposure from outdoor and indoor sources (one in eight deaths), with a large proportion in developing countries due to indoor combustion. It considers air pollution to be the world's largest single environmental health risk (WHO, 2014b) and has produced exposure guidelines for a large number of pollutants (see table 9.3 Appendix 1). In many countries where smoking bans have been put in place, significant improvements in public health have been measured. The challenge is how best to apply this legal maxim to other ubiquitous indoor toxins.
3.22 In the UK it is estimated that ambient air pollution results in the premature death of between 28000 and 36000 each year, based on the combined effects of particulate and NO2 pollution (COMEAP, 2018). Exposure of the developing foetus and young children is of particular concern (RCP, 201; RCPCH, 2020; Hänninen, 2013). This highlights the significance of outdoor air pollution on the overall health burden, evidenced by indoor levels of pollutants such as particulate matters (PM) being above WHO guidelines (EC, 2004; Mandin, 2017). Overall, the majority of the burden falls on cardiovascular diseases, followed by asthma and lung cancer.
3.23 There is a hierarchy of importance in the range of pollutants exposure. Some pose a known and severe health and even death hazard through short-term exposure (e.g., CO). For some pollutants, long term effects may show up years after exposure has occurred or only after longer repeated periods of exposure (e.g., radon, particulates, NO2). These long term hazards may be respiratory diseases, such as asthma and chronic obstructive pulmonary disease aggravated by pollutant exposure, cardiovascular disease, or lung cancer related to radon exposure. Other pollutants may not be severe and immediate health hazards, but become irritants if concentrations are sufficiently high and/or exposure sufficiently long, with sensitivities depending on individuals (e.g., many VOCs). Others may have limited health effects but are considered useful indicators of indoor air quality. CO2 concentrations are recognised as a good predictor of total VOC (TVOC) exposure.
3.24 Oxides of nitrogen (NOx) and PMs (PM10, PM2.5, and smaller) from combustion processes, are generated from outdoor sources, such as traffic and industrial processes, and by indoor sources such as cooking and fireplaces. NOx includes NO and NO2, both being closely linked with NO2 typically used as a marker for overall levels of associated compounds. There are a wide range of pollutants found in the domestic environment that are generated by sources such as: chemicals used for cleaning, off-gassing from building materials (chipboard flooring etc), ventilation ducts, furnishing (fire retardants), interior finishes (solvent based paints), electrical appliances, radon from soil, heating and combustion appliances, water systems, dampness and mould and external air quality.
3.25 Modern methods of construction such as SIP panels can contain a variety of bonding compounds (glues) that off-gas VOCs. There are thousands of VOCs and many have known health effects. The most common requiring attention in buildings is formaldehyde, a known (IARC Group I) carcinogen, that is emitted from building materials such as laminated wood products, varnishes and glues. The effects of exposure to VOCs include, mucosal irritation in eyes and upper airways, lower respiratory symptoms (coughing), central nervous system (neuropsychological) symptoms (headache), and tiredness. Sources of VOCs include the outdoor air (e.g. benzene and toluene from traffic sources and industrial activities) and indoor sources (e.g. xylene from combustion sources, formaldehyde and hexanal from building materials, d-limonene from cleaning products, acetaldehyde from plants, ripe fruit and consumer fragrances. Indoor VOC levels are therefore normally significantly higher than outdoors. Total VOCs (TVOC) concentrations also vary significantly with the season, affected by ventilation and by variations in off-gassing driven by increases in temperature and humidity (Coward, 2002; Dimitroulopoulou, 2005; Jamieson, 2005; Geiss, 2011; Holøs, 2019). Primary emissions are from building products and normally dominate for a period of a few weeks to months in new and newly renovated buildings. As the materials age, secondary emissions from the reaction of VOCs with other pollutants may increase (Wolkoff and Nielsen, 2001). VOCs from consumer products are a rising source of concern, especially in residential environments (Dimitroulopoulou et al., 2015a/b; Trantallidi et al., 2015; Geiss et al., 2011) but they are also found in non-domestic environments such as workplaces and schools, where sources include cleaning products, equipment (printers) and educational activities (paints, glues, etc.) (Wolkoff, 2013; Mandin et al., 2017; EC, 2014; Geiss et al., 2011).
3.26 In addition to VOCs, occupants are exposed to a number of other components present in the air through outdoor and indoor sources, such as polybrominated diphenyl ethers (PBDEs) that act as flame retardants; in electronic equipment and furnishings, and hormone disrupters such as phthalates from plastic. Knowledge on the health effects of these is still evolving however hormone disrupting compounds (false oestrogens) are now implicated in falling fertility particularly in younger males who have been affected in utero. Other products may not currently be considered pollutants because of a lack of information on their effects, especially those related to long term exposure. Additional compounds may emerge through new industrial and manufacturing processes (e.g. nanoparticles), or through chemical reactions between pollutants forming complex new organic substances, as is known to be the case for ozone reactions with VOCs.
3.27 The role of microbiological contaminants in indoor air is becoming more important as buildings become more airtight. This applies both to the home, where dampness can cause severe infestation, and to buildings with mechanical ventilation and/or cooling systems, which can harbour moulds and bacteria that are now known to have a causal link with lung function (McSharry, 2015). There is growing evidence that building design and occupant behaviour can affect the type and diversity of bacteria found indoors (Kembel et al. 2012). A study by Sharpe et al. (2020) found associations between ventilation provision and use on the presence of Gram-negative bacteria, with increased window opening reducing the likelihood of finding Gram-negative isolates. Covid-19 has also highlighted the role of ventilation rates and their relationship to micro-aerosol concentrations. It is becoming clear from infectivity patterns in various countries, that poorly ventilated indoor spaces play a major role in infection transmission. Poorly ventilated dwellings may very well be proven to be the greatest source of cross-infection (Noorimotlagh, 2021).
3.28 Building occupants are constantly exposed to numerous substances from multiple sources. Most assessments evaluate risks on a substance-by-substance basis and do not consider the combined adverse health effects due to exposure to multiple pollutants. They do not take account for instance of additive, synergistic or antagonistic effects that can occur between various compounds, nor of exposure through routes other than inhalation. These synergistic effects are mostly unknown, but there is growing evidence that such interactions do occur; for example, between radon and tobacco smoking in the causation of lung cancer; between NO2 and formaldehyde in increasing the effects of exposure to allergens such as house dust mites (RCP, 2016), and between particles and ozone (Wolkoff, 2013).
3.29 In most countries there is currently no comprehensive regulatory framework on indoor air quality, with the exception of radon. The default position is therefore to refer to the WHO air quality guidelines as presented in Table 9.1. Appendix A. This approach should help align the project with best practice guidance, provide an element of future-proofing against possible future legislation, as well as reducing future litigation risk. Table 9.1 (Appendix A) covers a selection based on the following rationale: pollutants covered by ambient and indoor air quality guidelines from the WHO (2006a, 2010a) and pollutants covered by EU and UK ambient air quality objectives (OJEU, 2008b; Defra, 2007; TSO, 2010b), which are themselves largely similar to or less stringent than WHO guidelines. Key pollutants that are known to be common in the built environment and to have serious adverse health effects include: asbestos, radon, second-hand ETS, carbon monoxide and mould (RCP, 2016). In urban locations, the main pollutants likely to require attention over and beyond regulatory requirements (e.g. in addition to carbon monoxide and radon regulations) are particulate matters and NOx from outdoor sources, formaldehyde and TVOCs.
The Scottish Dimension
3.30 Five Strategic Objectives were set out in 2008 by the Scottish Parliament outlining the vision for a, 'Wealthier & Fairer, Smarter, Healthier, Safer & Stronger and Greener Scotland'. The Framework would last over 10 years before being updated with the introduction of the National Performance Framework in 2018, that reformulated the original objectives to correspond with the United Nations Sustainable Development Goals as proposed in the 2030 Agenda for Sustainable Development (UN, 2015). This project aims to deliver on these objectives and to meet challenges raised by the Low Carbon Building Standards Strategy for Scotland (Sullivan, 2007) and subsequently enshrined in law by the Climate Change (Scotland) Act, 2009. The initial ambition contained in the Sullivan report was to achieve zero carbon if practical by 2016/17. This however did not turn out to be practical and was revised to meet a target reduction of 34% on 1990 emission rates by 2020 and a more realistic target of an 80% reduction by 2050.
3.31 The Scottish Government also recognises the link between physical environment and health and wellbeing in the implementation plan for, 'Good Places, Better Health – A new approach to environment and health in Scotland, 2008'. Working in partnership with health boards, local authorities, broader community planning partnerships, third sector organisations, community based organisations and communities themselves, the Scottish Government stated aim is to target toxic, infectious, allergic, and physical threats. The demand to reduce CO2 emissions through reduced energy use needs to be balanced with the ambition to promote health and well-being. The intent is to achieve affordable warmth within a healthy environment, free from toxins, volatile organic compounds and house dust mite infestation that are a significant driver for asthma in Scotland, may not be compatible with a carbon neutral development unless the conflict with healthy indoor air quality, can be resolved or at least the conflict optimised.
3.32 Increasing ventilation leads directly to an increase in heat loss and this in many modern dwellings that require to have low U values, for the opaque areas of the building envelope, air changes can now account for up to 80% of the total dwelling's heat loss. The industry has always viewed minimum standards as maximum targets, and it is highly unlikely that they will choose to incorporate measures that may have cost implications that will in turn affect price points and profit margins. History has proven that this challenge will only be met by the design and construction industry, in response to statutory regulation.
3.33 In an attempt to encourage infiltration via the trickle ventilators, by creating a negative pressure in the dwelling, a technique was developed (dMEV – decentralised mechanical extract ventilation) and implemented in a number of Scottish dwellings. A study that surveyed 223 homes (Sharpe 2018) aimed to generate responses from the occupants regarding their knowledge and operation of the fitted ventilation system. A subset of these homes was subsequently monitored to examine the system 'in-use' and identify any confounding variables that may impact on overall performance and efficacy. A further study was undertaken in one dwelling to experiment with different dMEV configurations. The survey reported that although there was good awareness of the presence of ventilation provisions, there was a lack of knowledge regarding how these systems were controlled. Many households did not know how to boost the ventilation rate in the dMEV system, nor did they feel the need to intervene with the controls. The survey also highlighted a lack of engagement with the trickle ventilators situated in the window frames.
3.34 As some of these dwellings were constructed after the 2015 regulation change, the survey was able explore the impact of this change in 21 homes that were reported to have a CO2 monitor installed in their main bedroom. Of these, 19 households stated that they understood the purpose of the CO2 monitor. The responses varied from i) to measure/ monitoring CO2 (16 homes), ii) for health and safety (2 homes), or iii) gas poisoning (1 home). This suggests there may have been some confusion regarding the purpose of the monitor, confusing it with the carbon monoxide detector. The majority of homes with carbon dioxide monitoring equipment stated that they did not receive any guidance on how to use the CO2 monitors (11 homes). Further responses confirmed that the monitors had been ineffective in driving any significant behavioural changes regarding increasing ventilation rates when CO2 levels triggered the red warning light.
3.35 Over 50% of these homes appeared to have poor overnight ventilation (where carbon dioxide levels exceeded 1,000ppm for the majority of the time) in bedrooms. These included the type of the trickle vents, the window coverings, the path between the room and the dMEV (including the door opening or undercut, and the arrangement of the home) and the installation and performance of the system. Dwellings with shorter, more open pathways for air movement had better IAQ. Where the dMEV systems were more remote, IAQ was noticeably poorer.
3.36 Inspection of the monitored homes found a high number of installed dMEV systems (42-52% - depending on location), were sub-optimal (exceeding recommended airflow rates by >15%), or non-compliant with the guidance (17-48%). Flow rates were highly variable. This was due in the main to system setup and commissioning. Given that bedroom doors were often closed (41%) due to occupant preference or fire requirements, the strategy relies on door undercuts, but these were undersized in 20% of properties.
3.37 There were a number of homes (51%) where trickle vents were installed in wet rooms with dMEV systems. Whilst this may improve the efficacy of extract and moisture control in these rooms, this undermines the ability of the system to assist with ventilation in more remote rooms. Whilst dMEV systems in en-suite bathrooms provided the best outcomes for adjacent bedrooms, problems with systems being disabled were encountered in 56% of homes with the predominate problem being reported as acoustic nuisance. The findings would suggest that whilst there are some situations where a dMEV system can assist with the ventilation provision of modern airtight homes, the ability to act as a whole house system is limited, particularly in larger more complex layouts and where ventilation loads are higher.
3.38 Although trickle ventilation provision in habitable rooms did not appear to be a major determinant of carbon dioxide concentrations in the monitored dwellings, these results should be interpreted with caution, given the small sample size and large number of confounding variables identified. It is likely that the impact of reduced area of trickle ventilation was overshadowed by other key components such as air flow pathways, pressure differentials, dMEV extract rates etc. As such, the system as a whole requires careful design, taking into account the house layout, air movement routes (including undercuts and pass vents), the nature of the mechanical system and greater consideration of rooms that are more remote.
Contemporary research findings
3.39 Indoor air is comprised of a complex mix of both indoor and outdoor sources of pollutants. Ventilation should act to dilute, disperse and remove indoor pollutants while limiting the ingress of outdoor pollutants into the internal environment. This balancing act is further complicated by the fact that, for both a building designer and occupant, strategies for managing good IAQ must compete with the need to provide thermal comfort, avoiding overheating and noise pollution, economic costs, and to meet energy use and carbon reduction targets.
3.40 Despite most dwellings having to conform to the standards laid down in the building regulations there are many additional variables that can influence the complex interactions between the building fabric, internal layouts, windows type, occupant behaviour and air movement. Significant differences have been observed between apartments and houses (Langer, 2013) ventilation systems, (Järnström, 2006; Tuomainen, 2001; Yoshimo, 2006; Yang, 2020) ventilation rates, (Langer, 201s3 and 2016, Godish, 1996; Kaunelienė, 2016; Guyot, 2018) or dwellings with gas cookers (Raw, 2004) or emissions associated with the storage of paints and cleaning materials within garages (Langer, 2016). These studies have highlighted the influence upon IAQ of occupancy and human activity (Logue, 2011; Ai, 2015), the presence of indoor sources of pollutants (Raw, 2004; Yoshimo, 2006; Jones, 2000) and ventilation rates (Langer, 2013, 2016; Godish, 1996; Dimitroulopoulou, 2016; Deng 2020). Seasonal variations have also been identified and may be associated with occupant ventilation behaviour, outdoor conditions, ventilation rates (Langer, 2016; Aubin, 2011) or varying emission rates from building products (Haghighat, 1998; Wolkoff, 1998).
3.41 Recent studies have examined IAQ in both conventional and low-energy dwellings in a number of countries (Yang, 2020; Logue, 2011). Few comparisons have been made within the UK context, where the most significant study of 867 homes occurred between 1997-1999 (Raw, 2004). As low-energy and ventilation practices have moved on significantly in the subsequent 20 years, the implications of a shift towards, airtight dwellings upon IAQ needs to be better understood, both in respect to the relationship with outdoor air and the need to control emissions inside dwellings (Yu 2011, 2012).
3.42 A more recent UK Government survey (HM Government 2019) of 10 new homes indicated high concentrations of total volatile organic compounds (TVOCs), formaldehyde and carbon dioxide (CO2 ), but only included 7-day passive sampling of one apartment dwelling and did not capture seasonality. Despite advances in measurement technologies, a recent review of 'Passivhaus' studies indicated very few studies included physical IAQ measurements beyond CO2, (Moreno-Rangel, 2020) with just one UK based study (McGill, 2016) capturing formaldehyde concentrations. This indicates a lack of comprehensive UK based IAQ studies on low-energy dwellings with little or no data on flatted dwellings.
3.43 The recent IEA-EBC Annex 68, 'Indoor Air Quality Design and Control in Low Energy Residential Buildings', that has proposed a set of IAQ metrics, identified key pollutants from previous studies and developed guidelines for the design and operational strategy of domestic dwellings (Rode 2019). This work has included setting target exposure limit values (ELVs) corresponding to recognised concentration thresholds, above which exposure potentially presents a risk to health. This allows an assessment of the measured concentrations against their respective health risks, providing a clearer comparison across pollutants. Defining appropriate ELVs is not straightforward, varying between regions, exposure periods and evolving health risks. The study aligns itself with the ELV values set in IEA Annex 68 (Abadie 2017). There is therefore a further compounding variable to take into account, where dwellings are located close to major road junctions where the external air is heavily polluted with the outputs from internal combustion engines or in the vicinity of industrial processes, off-gassing specific pollutants from flues and smoke stacks.
3.44 The London Air Quality Network stations reported annual mean concentrations of both roadside and urban background as: PM2.5(13.2 μg/m3 – 12.2 μg/m3), PM10 (23.7 μg/m3 – 21.1 μg/m3) and roadside NO2 (50.9 μg/m3). These levels are well above the World Health Organisation (WHO 2006) limits (PM2.5 - 10 μg/m3, PM10 - 20 μg/m3). Short-term, 24hour, limits for background PM2.5 are breached 23 times annually. Annual mean urban background NO2 (31.9 μg/m3) is reported at three-quarters of the WHO limit (40 μg/m3), with significant seasonality, dropping from around 35 μg/m3 in the heating season to 25 μg/m3 in the summer months.
3.45 Criteria for pollutant inclusion is based upon both the health risk posed and the likely levels to be encountered in a residential setting. Under IEA-EBC Annex 68, (Abadie 2017) reviewed several studies that had aimed to create priority indices and metrics for residential buildings. The key indicators were listed as: Particulates PM2.5-10, Carbon monoxide, NO2, TVOC, Ozone, Formaldehyde. Of the VOCs the most common that affect health are, Benzene, Naphthalene, Trochloroethylene, Tolene, Styrene, d-limonene and alpha-Pinene.. Radon and PAHs both feature as key pollutants identified by the WHO (WHO 2010) whilst sulphur dioxide maybe a significant ambient source in some locations. Finally, IEA Annex 68 further included Acrolein and mould within its full scope (Abadie 2019).
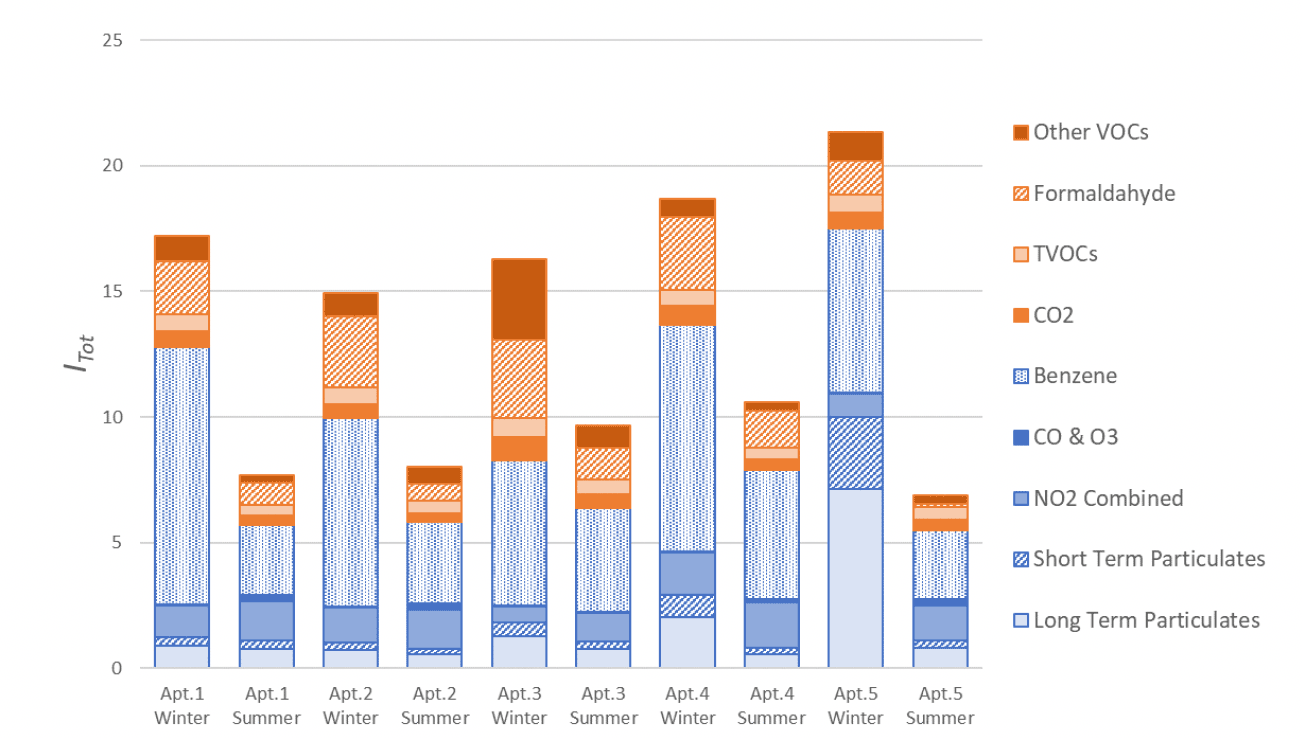
3.46 Stamp (2021) has recently undertaken longitudinal indoor air quality monitoring in five low-energy London apartments. 16 key pollutants were monitored using continuous and diffusive methods across all seasons. The results indicate strong seasonal variations driven by increased natural ventilation rates over the summer period. A combined metric for indoor and outdoor pollutants (Itot), suggests the IAQ in the winter (Itot=17.7) is more than twice as bad as that seen in the summer (Itot=8.6). Formaldehyde concentrations were lower in the non-heating season, indicating increased ventilation rates more than offset increased off-gassing. Increased summertime ventilation rates were observed to increase the proportion of outdoor pollutants entering the internal environment. This resulted in higher indoor concentrations of NO2 in the summer than the winter, despite significant reductions in outdoor concentrations.
3.47 These results demonstrate the impact of ventilation practices upon IAQ, the influence of occupant actions and the complex relationship ventilation rates play in balancing indoor and outdoor sources of air pollution. Following this, strong seasonal patterns can then be observed within CO2 concentrations, with mean summertime concentrations significantly below those during the heating season and only marginally above external levels. The indication here is that there is a significant increase in window opening and natural ventilation during the summer to provide additional cooling and air movement, a strategy to combat the rising internal temperatures. Conversely, across the heating season CO2 concentrations approach 1000 ppm, indicating that significantly lower ventilation rates are achieved when background MVHR is operating alone during the winter. This may then lead to a higher build-up of internal contaminants across the heating season. Across all pollutants, (excluding CO2 ) differences in ventilation practices affect the I/O ratio that is significantly higher in the non-heating season. The median I/O ratio increases from the winter to the summer from 0.32 to 0.70 for PM2.5, 0.50 to 1.42 for PM10 and 0.55 to 0.98 for continuously measured NO2 and 0.39 to 0.85 for passively measured NO2. This last result helps explain the unexpectedly higher indoor NO2 levels seen in the summer, with increased ventilation rates increasing the proportion of ambient NO2 entering the indoor environment. Therefore, whilst increased ventilation rates act to dilute many internal pollutants, this is somewhat offset by the increased exposure to NO2 from the ambient air. Although not measured in this survey it is likely that SOx will be found in similar concentrations to oxides of nitrogen.
3.48 Strong seasonal differences in ventilation practices were seen, with increased natural ventilation doubling the average ventilation rate from 0.7h-1 in the heating season to 1.6h-1 in the summer. Similar seasonal effects were observed in indoor CO2 concentrations.
3.49 The study points at the need for improved MVHR filtration for dwellings in polluted urban environments. This should include improved filtration of fine particulates and further consideration of measures to reduce or control NO2. This points to the importance of adopting measures to control indoor sources and remove or filter out, black carbon particulate matter and oxides of nitrogen and sulphur. The study concluded that the impact of window opening behaviour must be more holistically considered, with mechanisms to inform occupants of the impact of their actions upon IAQ. The scope of any feedback mechanisms must not therefore be restricted to CO2 as the sole proxy for IAQ.
3.50 Wargocki, (2016) claimed that people in the developed world spend between 85-90% of their time indoors. Of this, most is spent in homes. To minimize health risks from pollutants occurring in homes, exposures should be controlled. The most effective way to achieve this is to control sources of pollutants and to reduce emissions. This strategy is however difficult to control as occupants will bring with them many potential sources of indoor pollutants. Exposure can therefore only be controlled by providing sufficient, ventilation air to dilute and expel any contaminants. The paper concludes that there are very few studies on this issue and many of them suffer from deficient experimental design, as well as a lack of proper characterisation of actual exposures occurring indoors. Newly installed mechanical ventilation systems were observed to improve health conditions. In homes with existing ventilation systems however, this positive effect was less evident, probably due to poor performance of the system (ventilation rates inadequate and/or poor maintenance). The author called for better research in which exposures are characterised (for example measuring the pollutants used by the WHO Guidelines). Exposures should also be controlled using different ventilation methods for comparison. Future studies should advance the understanding of how ventilation systems could be operated to achieve optimal performance. This is one of the key aims of Annex 86, to improve the energy efficiency of indoor air quality management strategies and to improve their acceptability, installation quality, control and long term reliability (see www.annex86.iea-ebc.org). Moreover, these data would create further input and support to the guidelines for ventilation based on health developed currently in the framework of the HealthVent project (www.healthvent.eu).
3.51 Kinnane (2016) recognised that optimising the conflict between energy efficiency and IAQ is proving to be challenging in many European countries. This study assesses the efficacy of passive ventilation strategies designed to comply with building regulations and imposed after housing energy-efficiency retrofits. In particular, it focuses on the provision of ventilation using background through-wall vents, which remains a common strategy in a number of European countries, where vent sizes are related to floor area that are prescribed in the building regulations. A case study based on social housing typologies reported that occupants were decidedly unhappy with through-wall vents with many being blocked to limit perceived draughts and heat loss. A wide range of effective air change rates are observed when vents are sized without reference to building airtightness, and significant energy penalties result for the leakier homes.
Summary
3.52 Optimising the potential trade-offs between energy efficiency and IAQ particularly in small single aspect family flats, may prove to be an intractable problem unless a properly working and well-maintained mechanical ventilation system is used.
3.53 Recent published research highlights the challenge between diluting internal sources of pollution whilst avoiding ingress of external sources. Opening windows to dilute and expel indoor pollutants in urban locations is likely to result in an increase in internal concentrations of PM10 as well as the ingress of oxides of nitrogen, sulphur and benzene (e.g. locations near busy roads, etc.).
3.54 The findings demonstrate the impact of ventilation practices on IAQ and the complex role ventilation plays in balancing indoor and outdoor sources of air pollution. Assessing and managing the risk of ingress of external pollutants therefore will be critical when designing a solution, particularly concerning the application of CO2 sensors as a proxy indicator of IAQ. If testing against a range of IAQ parameters can be established, they can form the basis of performance specifications that architects, engineers and the volume house builders will have to meet both in theory and practice (similar to blow door testing), if they are to be granted a building warrant and have a completion certificate accepted by local authority verifiers.
Contact
Email: buildingstandards@gov.scot