Building standards - ventilation guidance: research
Research to investigate whether changes made to the building standards guidance in 2015 (standard 3.14) have resulted in better occupant interaction with the dwellings natural ventilation components and improved levels of indoor air quality within the dwelling.
Part of
5. Long term monitoring study
Aims and objectives
5.1. The specific aim of the long term monitoring component of this study is to investigate what effects the new regulations have had on actual conditions in homes. By doing so, it will be possible to compare the effectiveness of the introduction of CO2 sensors across different construction and ventilation provisions and over varying weather conditions as well as real-world compliance and performance.
Homes selection and description
5.2. The household survey as per WP2 identified 57 households willing to participate in long term monitoring. Homes with CO2 monitors and flats were prioritised as part of the selection process.
5.3. Out of 39 households willing to participate in the long term monitoring, only 19 claimed to have CO2 monitors installed in the bedrooms, which constituted a potential challenge to obtain 20 case studies for the long term monitoring. To overcome this challenge, further household surveys were arranged to developments where the presence of CO2 monitors had been confirmed by the housing association. A total of 26 new addresses were surveyed face to face obtaining further 18 households willing to participate.
5.4. Households were contacted to (a) confirm CO2 monitor presence, (b) identify the house typology and (c) explain the mechanics of the long term monitoring. In 18 homes, occupants confirmed their willingness to continue with the study.
5.5. The first round of home visits for long term monitoring were arranged for 18 homes in total, however monitoring was set up only in 13 homes because of last minute cancellations in 5 homes (2 homes drop off due to Covid illness, 1 wrong address, 2 absent at the door and unable to contact) The home visits took place between 01/12/2021 and 10/12/2021, with 2 to 3 hours' time slots per home.
5.6. After restrictions were lifted and face to face interviews resumed, a second round of visits took place between 31/01/2022 and 04/02/2022. Out of the 7 visits booked, 4 households cancelled at the door (2 uninterested at the door, 1 absent at the door and unable to contact, 1 was unavailable due to Covid illness) and setup took place in 3 homes, adding up to a total of 16 homes. Table 5.1 sums up the homes visit efforts.
5.7. To sum up, out of the 57 homes willing to participate and 36 of them having CO2 monitors present. Survey and monitoring set up was performed in 16 homes. From those 16 homes, 4 homes were not provided with CO2 monitors. After consultation with BSD, it was agreed that a small number of these would be included in the study as a comparison.
| Number of homes' visits scheduled | Number of homes' surveys cancelled before installation | Number of homes' surveys and monitoring set up performed | |
|---|---|---|---|
| Round I (01/12/2021-10/12/2021) | 18 | 5 | 13 |
| Round II (31/01/2022 - 04/02/2022) | 7 | 4 | 3 |
| Total homes surveyed | 16 |
| Home ID | Carbon dioxide (CO2 ) monitor | Postcode | Property Type | Dwelling Type | Total floor area (m²) | Air Tightness (design) | Air Tightness (tested) | Mechanical Ventilation |
|---|---|---|---|---|---|---|---|---|
| 1 (ex RR983) | No | G32 7BS | Flat | Mid-floor flat | 76 | 0.4 | MVHR | |
| 2 (ex RR1211) | yes | G43 1FF | Flat | Ground-floor flat | 69 | 4 | dMEV | |
| 3 (ex RR991) | No | G32 7BS | Flat | Mid-floor flat | 55 | 4 | dMEV | |
| 4 (ex RR1628) | No | G78 2BF | House | End-terrace house | 74 | 4.5 | dMEV | |
| 5 (ex RR25) | Yes | EH11 4FF | House | Mid-terrace house | 76 | 2.5 | dMEV | |
| 6 (ex RR575) | Yes | EH42 1ZT | Flat | Ground-floor flat | 71 | 4 | dMEV | |
| 7 (ex RR619) | Yes | EH5 1RW | Flat | Ground-floor flat | 74 | 5 | dMEV | |
| 8 (ex RR846) | No | EH7 5FQ | Flat | Mid-floor flat | 64 | 5 | dMEV | |
| 9 (ex RR12) | Yes | EH11 3US | Flat | Mid-floor flat | 72 | 4.5 | dMEV | |
| 10 (ex RR914) | Yes | G31 1AR | Flat | Ground-floor flat | 65 | 4 | dMEV | |
| 11 (ex RR1560) | Yes | G73 2DS | Flat | Mid-floor flat | 51 | 4 | dMEV | |
| 12 (ex RR1386) | Yes | G53 6ER | House | Semi-detached house | 95 | 4 | dMEV | |
| 13 (ex RR1351) | Yes | G53 6EH | House | Semi-detached house | 95 | 4 | dMEV | |
| 14 | Yes | G46 8AZ | House | Semi-detached house | 96 | 4.5 | dMEV | |
| 15 | Yes | ML5 3AY | Flat | Mid-floor flat | 52 | 5 | dMEV | |
| 16 | Yes | G46 8AZ | Flat | Ground-floor flat | 81 | 4.5 | dMEV |
Description of monitoring set up and survey process
5.8. The survey process consisted of a series of 6 steps.
STEP 1 – Consent. Before beginning with any form of data collection, and in line with the ethical procedure put in place by the University of Strathclyde, researchers obtained signed consent from occupants.
STEP 2 – Walk-through. Then an initial walk-through with the occupants was performed to identify (a) the positioning of trickle vents (when manually adjustable), (b) the mechanical system and status (i.e. fan speed dial), (c) the floor plan layout, (d) any occlusion of openings and window conditions, (e) where the sensors will be installed, in agreement with the occupant and at the same time in a position that allows for reliable data collection (away from sources of heat, solar gains, windows etc.).
STEP 3 – Occupant Questionnaire. Questionnaires were completed by each household, capturing information on the following:
- household information
- trickle vents awareness and use in winter
- windows and door interaction in winter
- mechanical ventilation awareness and use
- advice on ventilation received
- CO2 monitors advice and interaction
- a general overall perception of the indoor environment
STEP 4 – Environmental Monitoring installation. Environmental monitoring equipment was installed during the same site visit in each bedroom and one living area. Temperature, relative humidity and carbon dioxide levels were monitored simultaneously at 15-minute intervals.
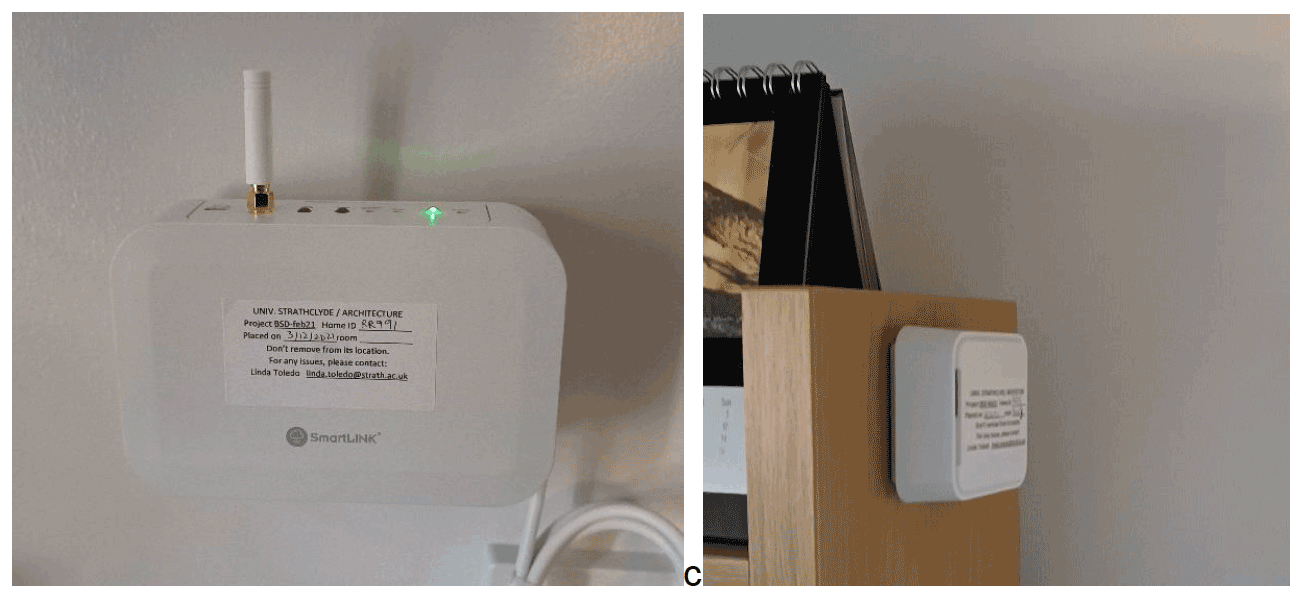
The equipment (provided by the company Aico Ltd) consisted of a SmartLINK gateway Ei1000G and HomeLINK Environmental Sensors Ei1025. These two products send readings from the sensors to an online HomeLINK dashboard. First, the desired location of the gateway was tested for a strong signal. Once confirmed, sensors were placed in the rooms using non-marking fixing tape. Each piece of equipment was labelled with the house code, installation date and room (see figures below).

STEP 5 – Ventilation survey. A ventilation survey was performed by testing the airflow measurements of the mechanical ventilation systems with the use of an air capture hood, SwemaFlow 126. Testing was performed in all outlets. The test was performed twice to improve the reliability. First, outlets were tested in trickle mode and then in boost mode.
STEP 6 – Dimensional Survey and Photos. After a quick draft of the home layout, the researchers recorded the dimensions of rooms, trickle vents and door undercuts. Where available, photos of the trickle vent stamp indicating equivalent area were taken, and measurements of the trickle vent length were recorded.
In 8 homes dMEV systems were found to be turned off from the isolators because of noise, draughts, costs of running. On such occasions, systems were turned on for the purpose of testing. Researchers also explained the purpose for them to be turned on and suggested occupants to leave the isolator on the ON position.
5.9. The results of the long term environmental monitoring, household questionnaire, building survey and ventilation audit were used to establish whether occupants use of the CO2 monitor had any impact on their awareness and use of ventilation, and whether this resulted in improved air quality.
Ventilation system test results
5.10. Results of measured ventilation flow rates of dMEV systems in kitchens and bathrooms are reported in table 5.4. It should be noted that a large portion of dMEV systems, especially those in kitchens, were not compliant with governmental recommendations.
| Minimum continuous extraction rates | Minimum boost extraction rates | |
|---|---|---|
| Kitchen | 6 l/s (22 m3/hr) | 13 l/s (47 m3/hr) |
| Utility room | 4 l/s (14 m3/hr) | 8 l/s (29 m3/hr) |
| Bathroom or Shower room (with or without a WC) | 4 l/s (14 m3/hr) | 8 l/s (29 m3/hr) |
| Toilet | 3 l/s (11 m3/hr) | 6 l/s (22 m3/hr) |
| Designated Drying Area | 4 l/s (14 m3/hr) | 8 l/s (29 m3/hr) |
The ventilation audit found bedroom trickle vent sizes varied considerably between homes. The trickle vents sizes found during the survey (see table 5.4).
| House ID | dMEV test | main bedroom conditions | |||||||||
|---|---|---|---|---|---|---|---|---|---|---|---|
| Kitchen | Bathroom | ||||||||||
| trickle mode (ref. 6 l/s) | boost mode (ref. 13 l/s) | trickle mode (ref. 4 l/s) | boost mode (ref. 8 l/s) | trickle vent EA | trickle vent % of opening | door under cut | night occupancy (A-adult, C-child) | window position at night | door position at night | curtains and blinds at night | |
| 1 | 14.3 | 18.6 | 3.2 | 12.3 | only tilted windows | - | - | 2A | Open | Open | Closed |
| 2 | 4.8 | 9.8 | 2.6 | 4.5 | 2300 mm2 x 2 units | 100% | 5 mm | 2A | Closed | Open | Closed |
| 3 | 7.8 | N/A | 6.9 | 10.5 | 5000 mm2 x 1 unit | 100% | 4 mm | 1A | Closed | Closed | Open |
| 4 | 5.3 | 11.5 | 3 | 5.6 | 4200 mm2 x 2 units | 50% | 4 mm | 1A | Closed | Open | Closed |
| 5 | 0 | 3.4 | 4.1 | 6.7 | 2500 mm2 x 1 unit | 100% | 2 mm | 2A | Closed | Closed | Closed |
| 6 | 2.2 | 2.6 | 6.4 | 7.9 | 2500 mm2 x 3 units | 66% | 10 mm | 1A | Closed | Closed | - |
| 7 | 0 | 0 | 7.2 | 6.4 | 5000 mm2 x 1 unit | 100% | 18 mm | 1A | Closed | Closed | Closed |
| 8 | 7.4 | 10.9 | 7.7 | 10.7 | only tilted windows | - | 19 mm | 2A | Closed | Closed | Closed |
| 9 | 2 | 3.7 | 4.5 | 9 | 2500 mm2 x 1 unit | 100% | 19 mm | 2A | Closed | Open | Closed |
| 10 | 5.8 | 15.5 | 3.8 | 8.8 | 5000 mm2 x 1 unit | 100% | 9 mm | 1A | Closed | Closed | Closed |
| 11 | 3 | 4.9 | 2.2 | 4 | 3200 mm2 x 1 unit | 0% | 4 mm | 1A | Closed | Open | Closed |
| 12 | 8.6 | 11.8 | 6.6 | 19.8 | 3200 mm2 x 1 unit | 0% | 4 mm | 2A | Closed | Open | Closed |
| 13 | 6.7 | 13.4 | 4.7 | 18.9 | 3200 mm2 x 1 unit | 0% | 4 mm | 2A | Closed | Closed | Closed |
| 14* | 5.5 | 15.2 | 0 | 7.7 | 4200 mm2 x 2 units | 50% | 8 mm | 2A 1C | Closed | Open | Closed |
| 15 | 6.5 | 11.9 | inaccessible | 9600 mm2 x 1 unit | 0% | 20 mm | 1A | Closed | Open | Open | |
| 16 | 2.8 | 4.9 | inaccessible | 4200 mm2 x 2 units | 100% | 16 mm | 1A | Open | Open | Closed | |
* bed 2 used as master bedroom
Seasonal analysis
5.11. The complete long term data can be found in Annex C.
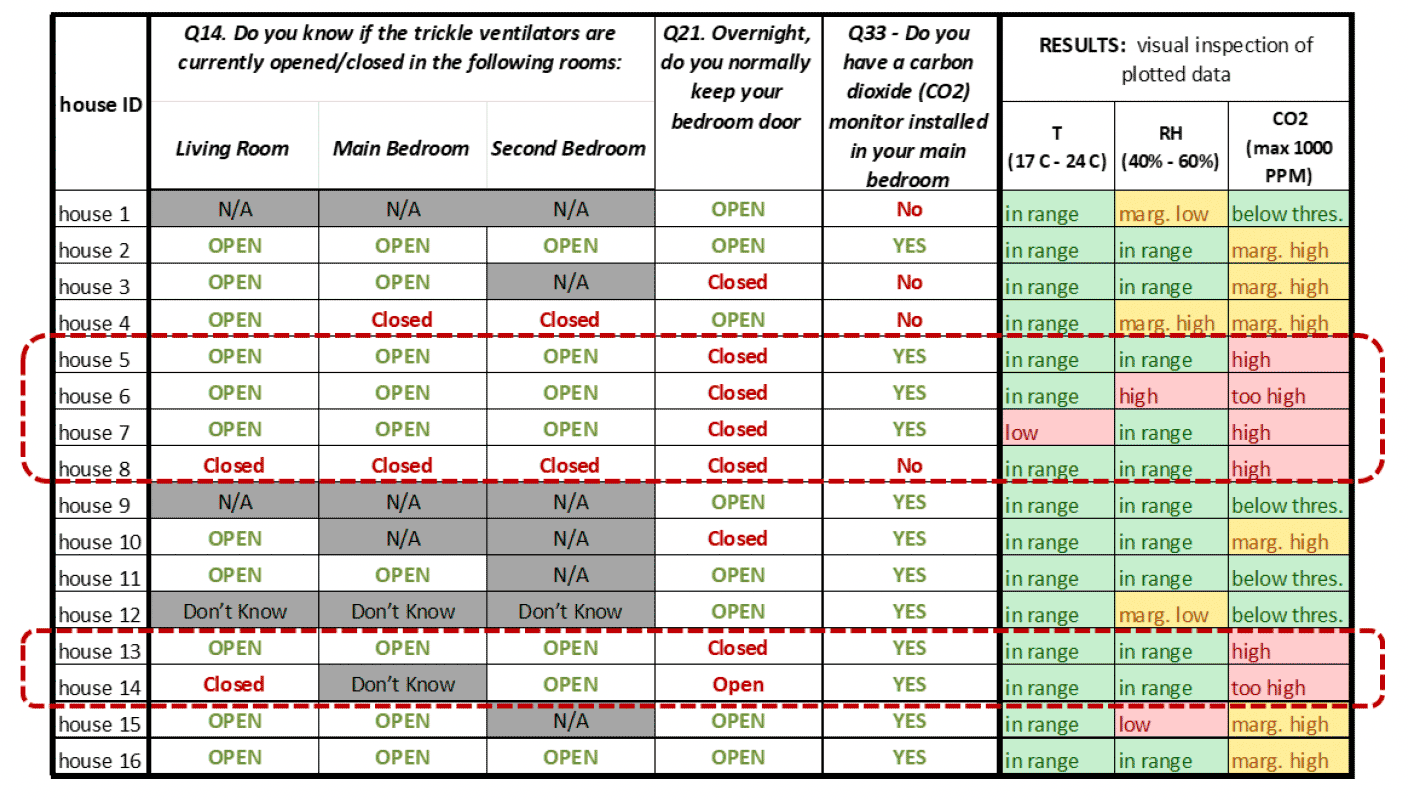
5.12. The seasonal report issued on 13 April 2022 showed various homes at medium and high risk of poor IAQ (see Table 5.5).
Seasonal results
5.13. Seasonal analysis was performed, examining the average night-time temperature, relative humidity and CO2 levels in bedrooms during three different months, representative of winter (Feb 2022), spring (Apr 2022) and summer (Jul 2022) seasons.
Carbon dioxide concentrations
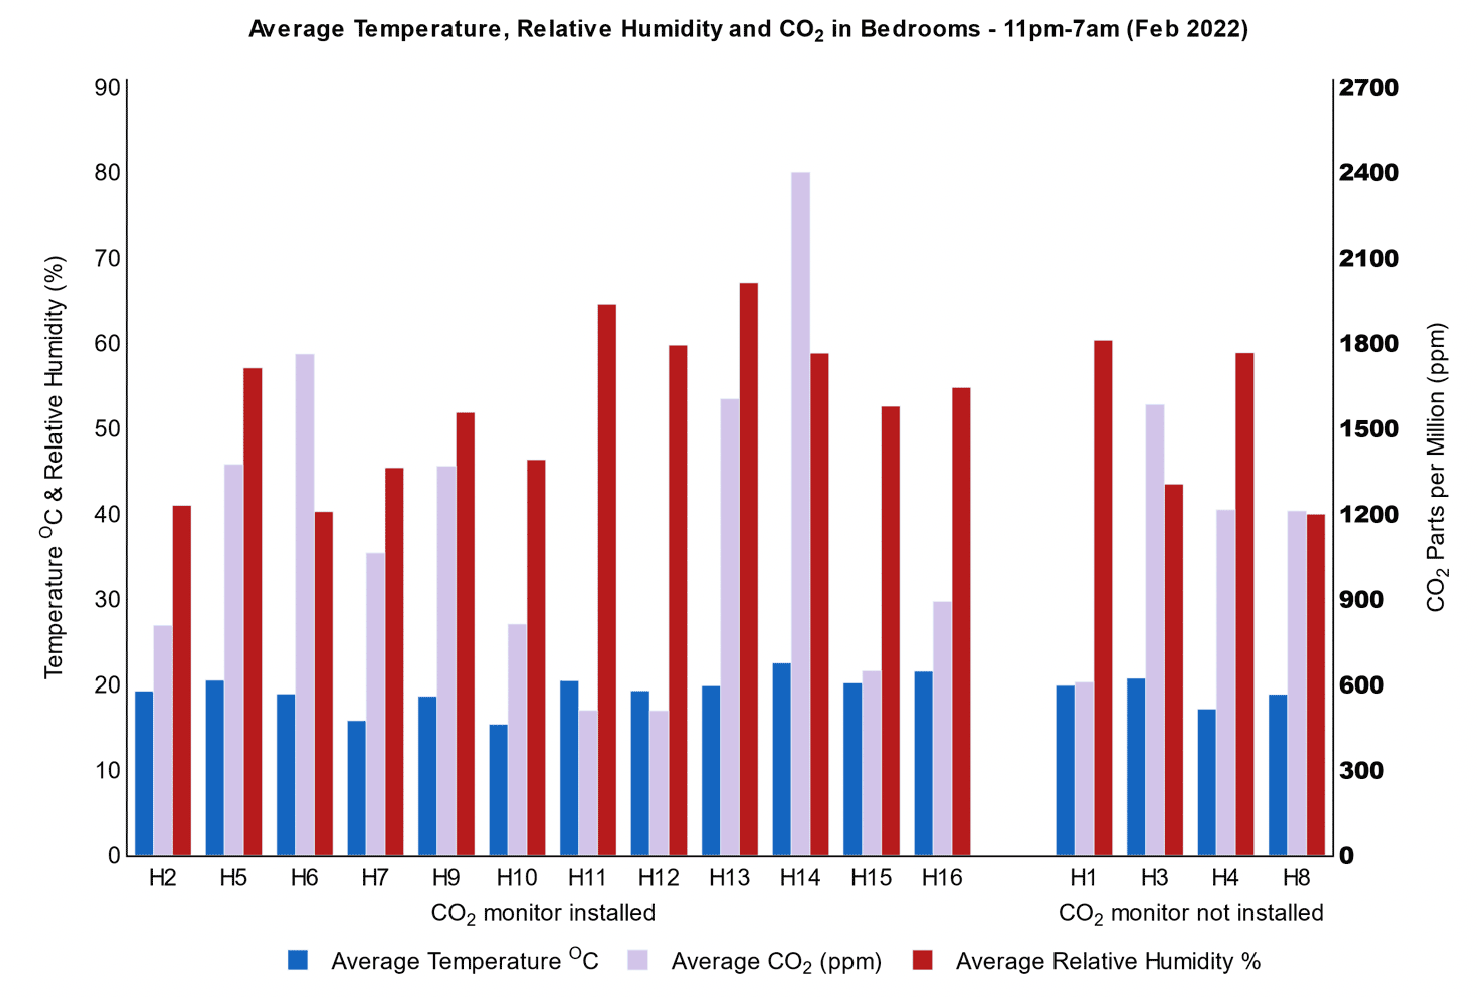
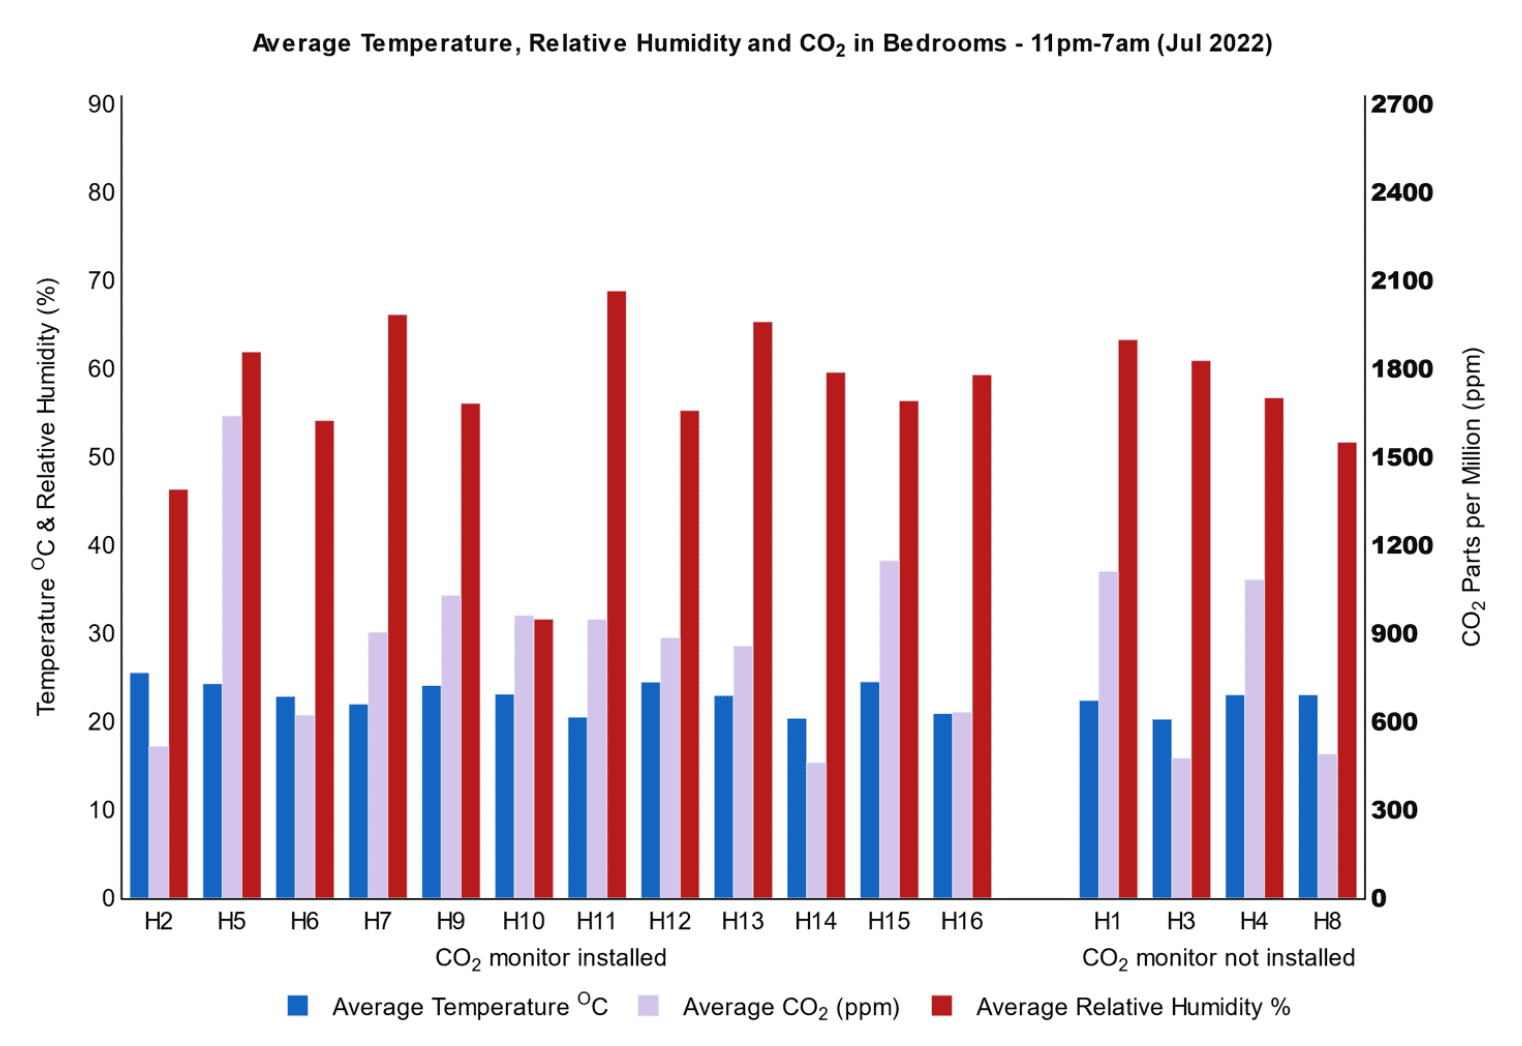
5.14. With respect to CO2 concentrations, in general, living rooms tended to perform better than bedrooms. The highest CO2 concentrations levels are found in bedrooms at night. This trend is stable throughout the three periods examined, i.e. winter (February 2022), spring (April 2022) and summer (2022). The next paragraphs examine in detail these periods. See figures 5.6, 5.7 and 5.8, showing monthly average values for all homes monitored. On the left-hand side are the 12 homes with CO2 monitor installed in bedrooms and on the right-hand side are the 4 homes that were not provided with CO2 monitors.
Winter
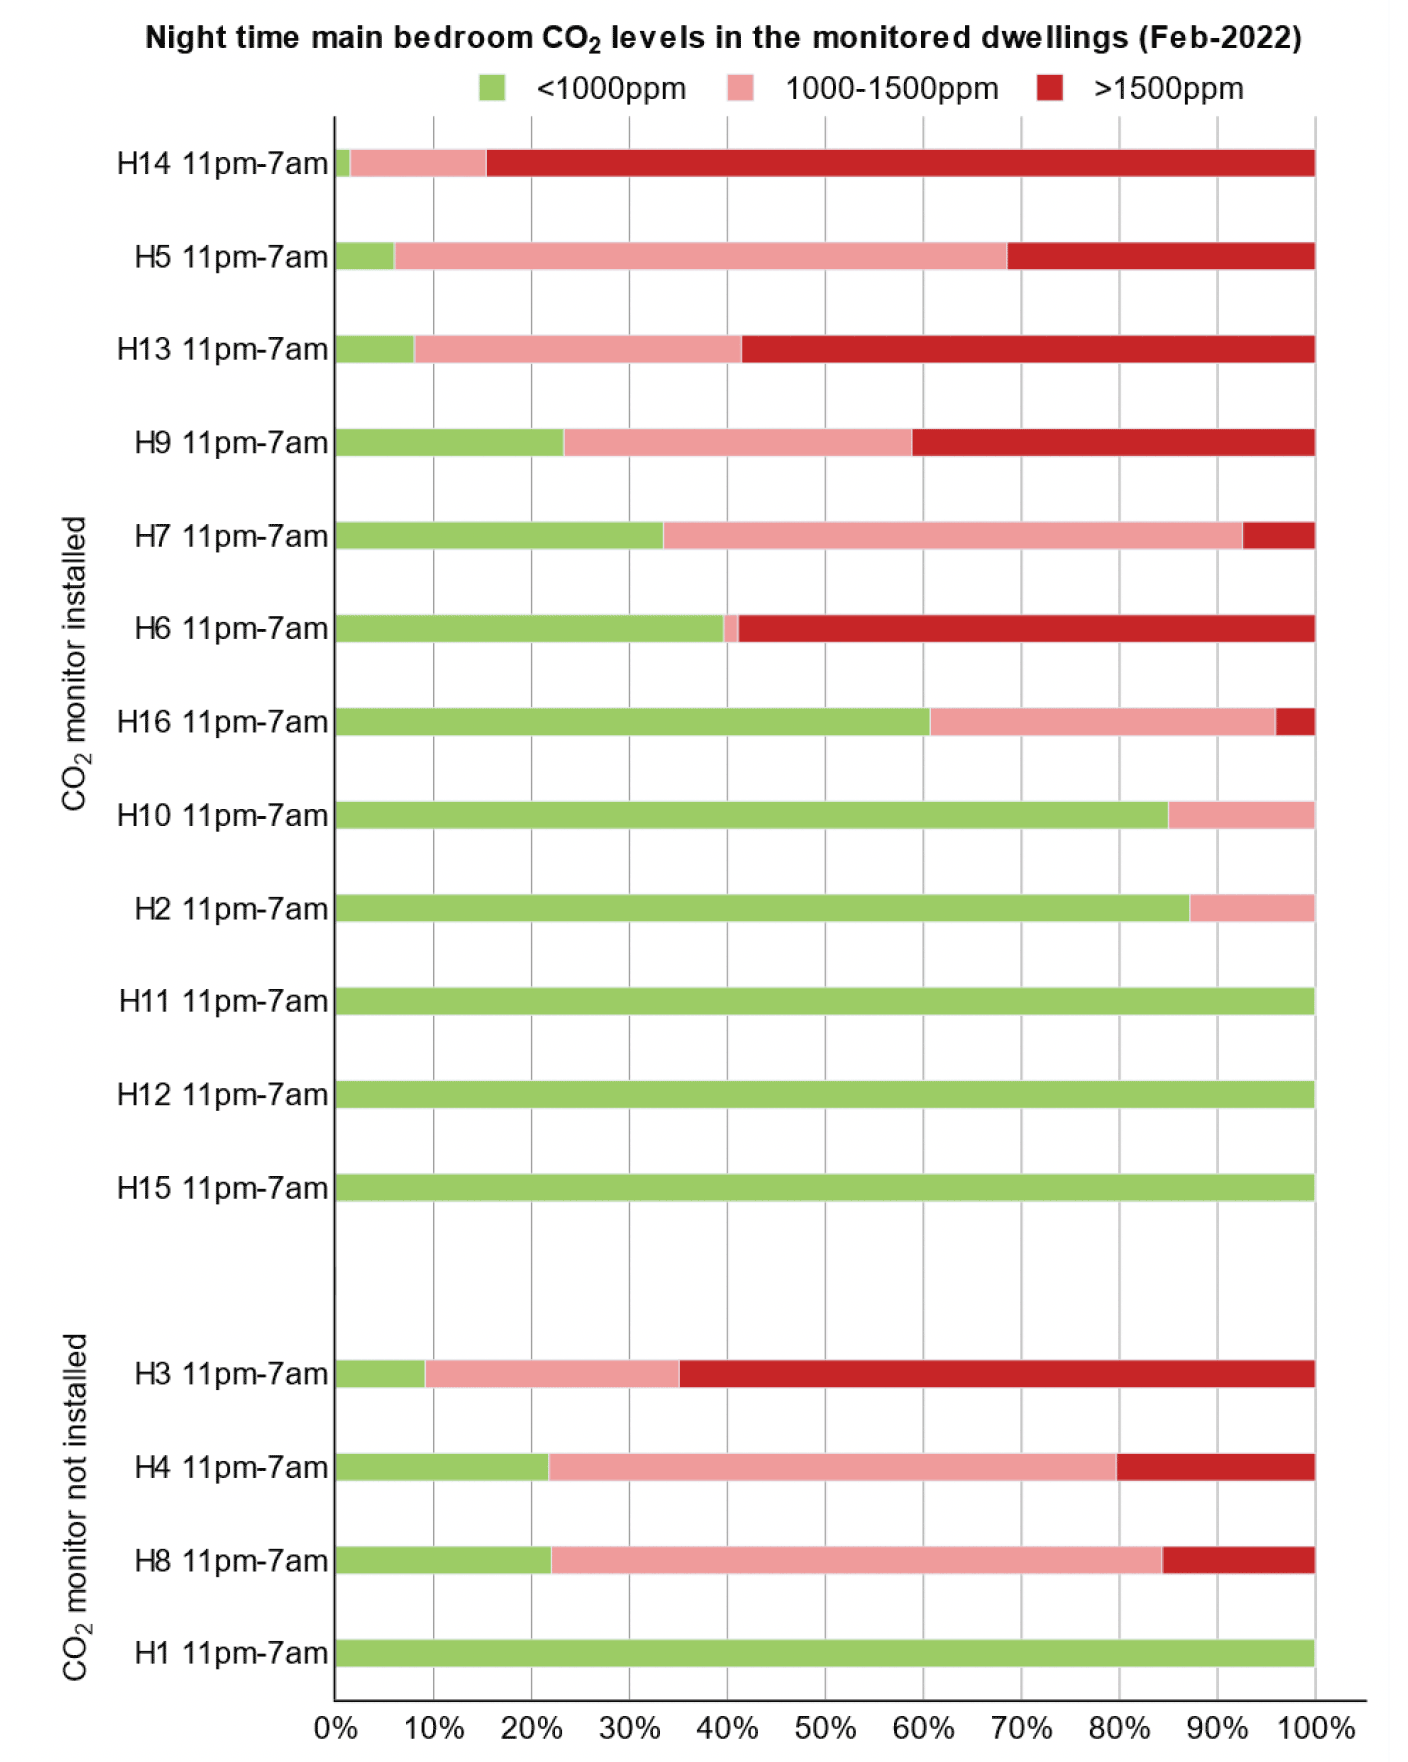
5.15. In figure 5.6 and figure 5.9 it can be noticed that half of homes with CO2 monitors in bedroom exceed the 1000 PPM. In decrescent order of concentrations, homes with CO2 levels above 1500 PPM are H14[8] with over 80% of the time above 1500 PPM followed by H13, H6 and H3 with over 50% of the time above 1500 PPM.
5.16. In the case of H14 and H13, both cases their households have children and adults keep the main bedroom closed at night. H6 is a main bedroom occupied by one teenager, while the adult occupied bedroom 2.
5.17. For the same period, 3 out of the 4 homes with no CO2 monitor had average night-time CO2 concentration levels above 1000 ppm, with highest levels found in H3, followed by H4 and H8. H3 on the other hand is a one person flat in a converted church. At the time of the survey, the occupant of flat H3[9] had expressed his concern due to cold discomfort in the bedroom, so it assumed a certain reluctancy from the occupant to open the windows.
Spring
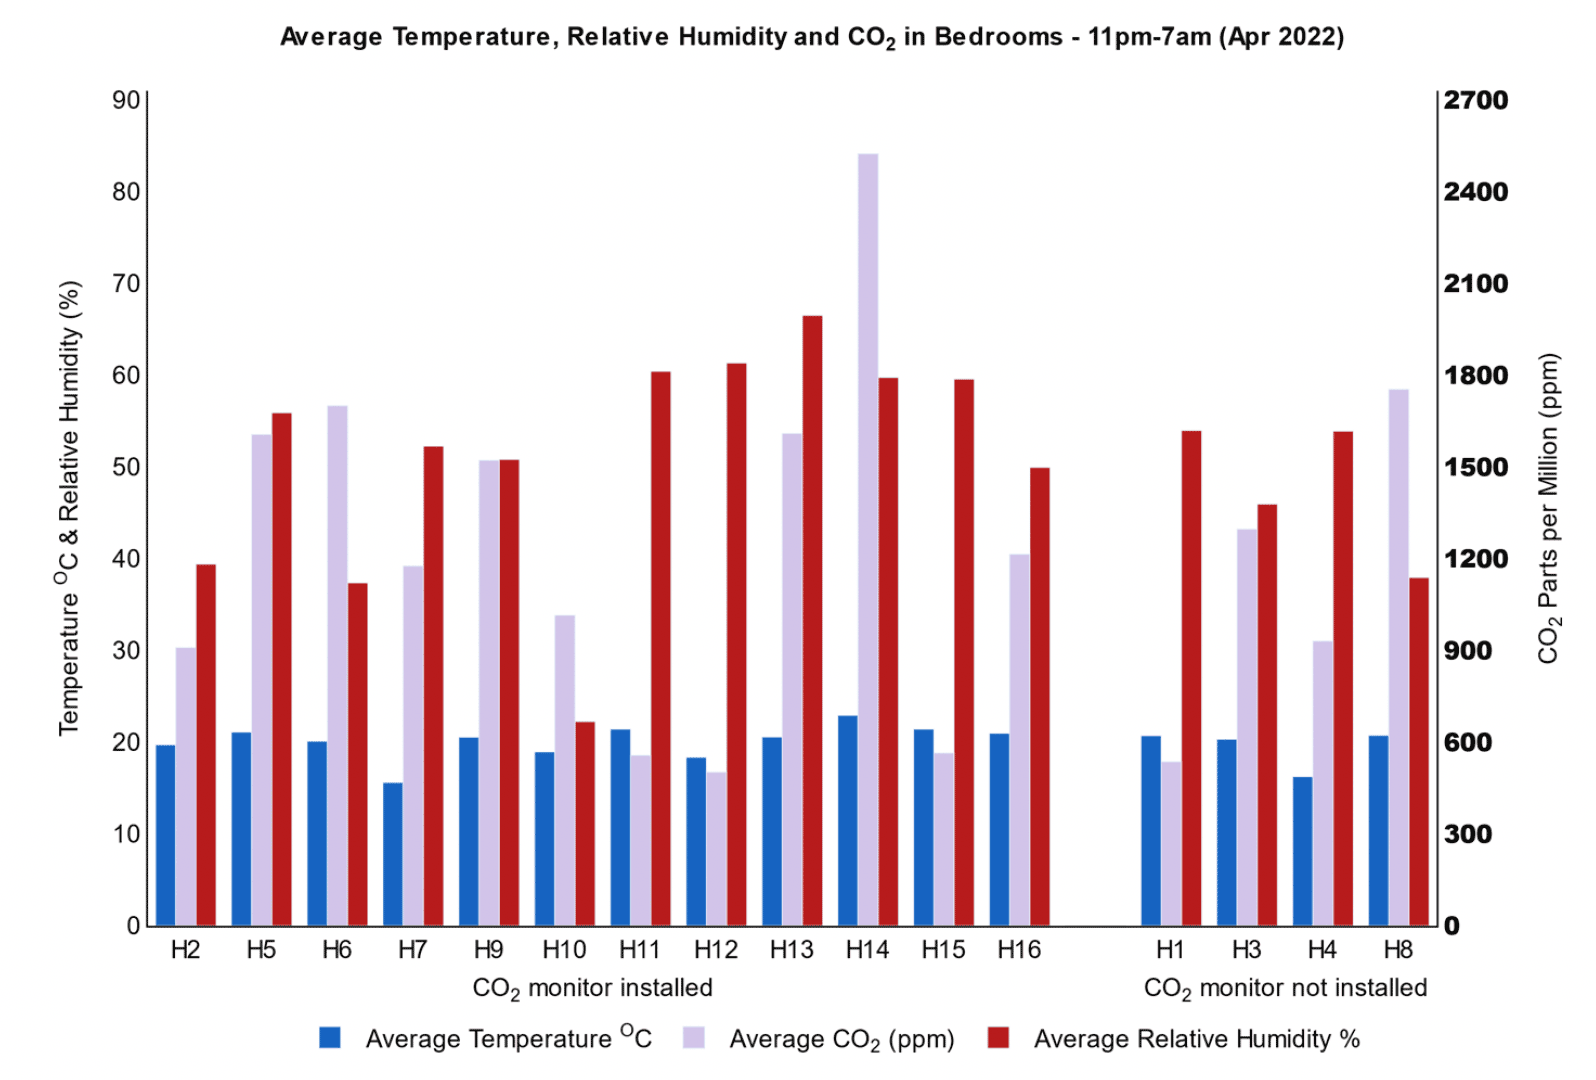
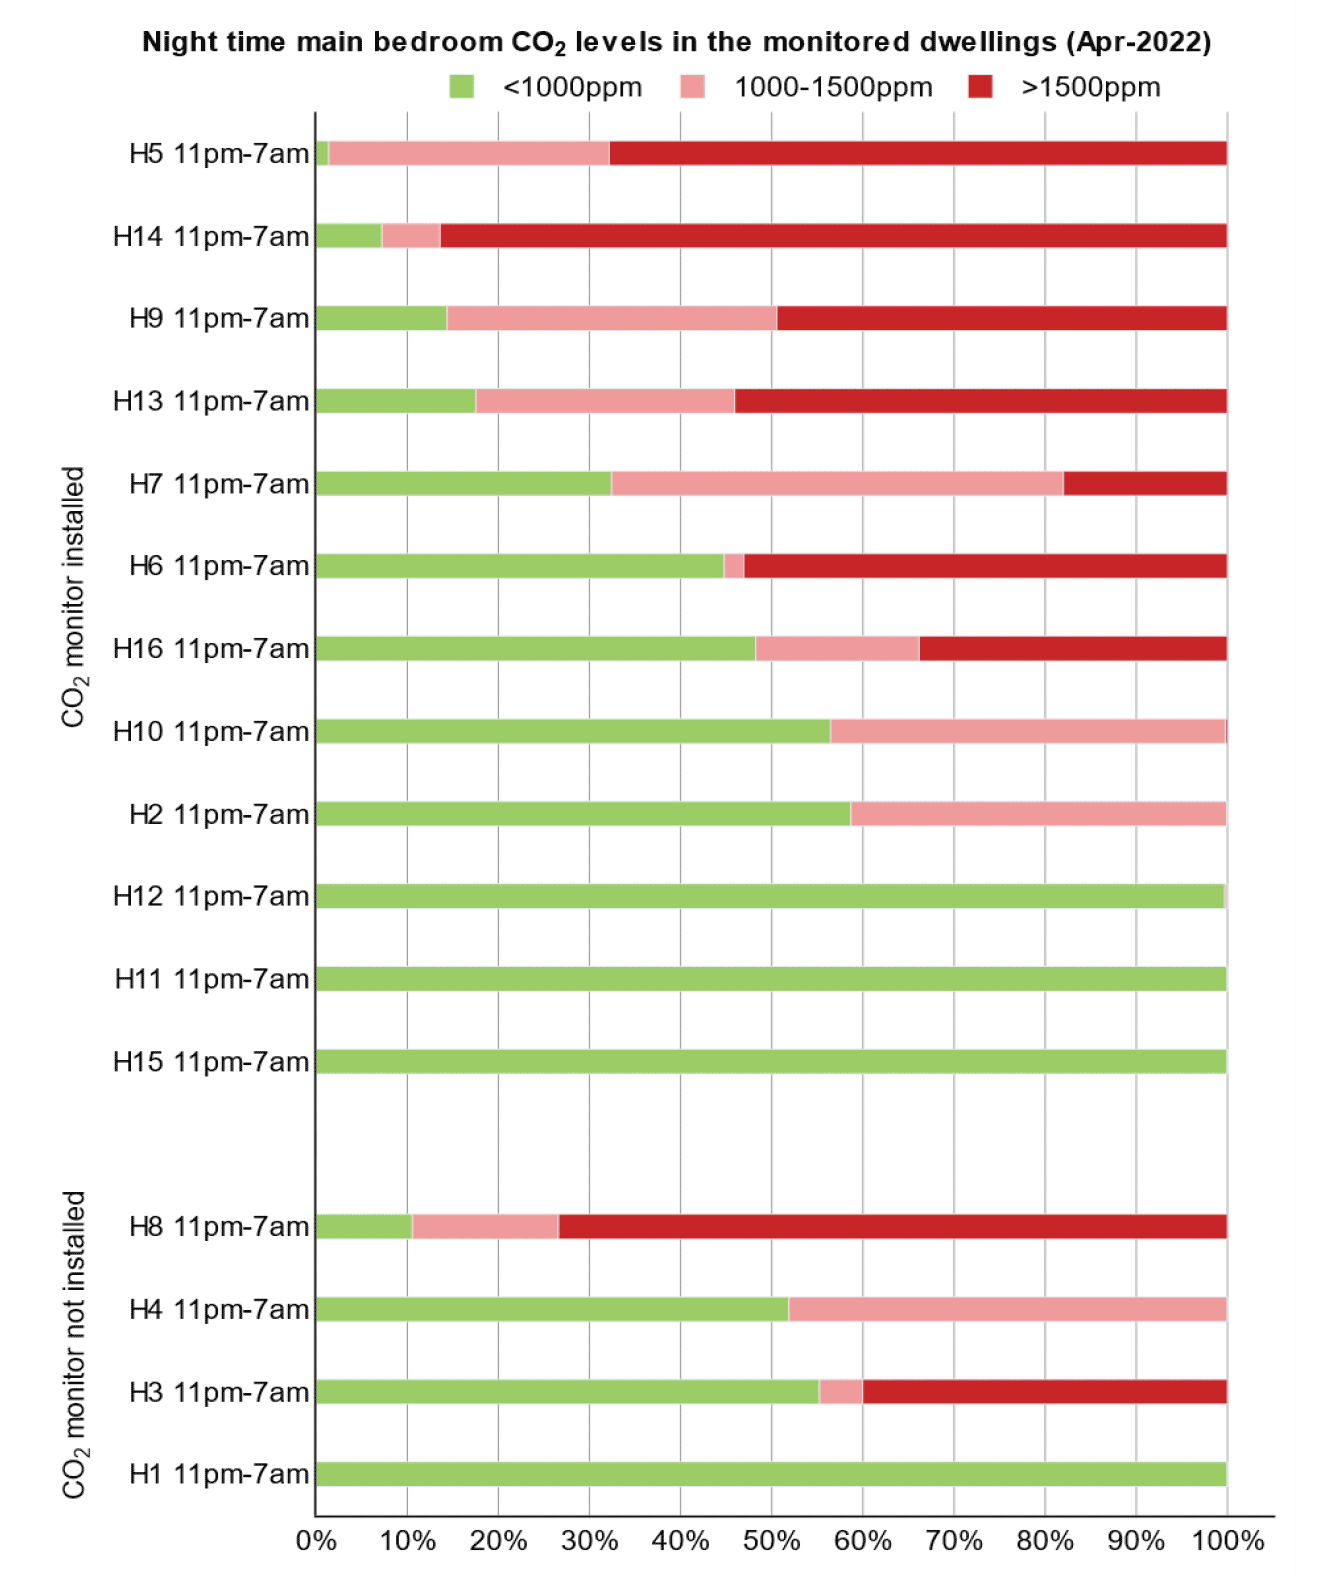
5.18. During Spring (figure 5.7 and figure 5.10), overall bedrooms and living rooms CO2 levels were generally higher in spring compared to winter in most homes. This may be indication of a concurring phenomenon besides window-trickle vent opening
5.19. In decreasing order of concentrations, bedroom night-time CO2 levels exceeded 1,500ppm for more than 85% of the time in H14 (family with new-born). This figure is similar to winter CO2 concentrations.
5.20. Bedroom night-time CO2 levels in H5[10] (couple) exceeded 1,500 ppm for 60% of the time. This figure greater that winter CO2 concentrations (over 30% of the time exceeding 1,500ppm).
5.21. In H8[11], CO2 concentration levels in the main bedroom exceeded 1,500ppm for over 70% of the time during Spring (a noticeable increase from 15% during Winter).
Summer
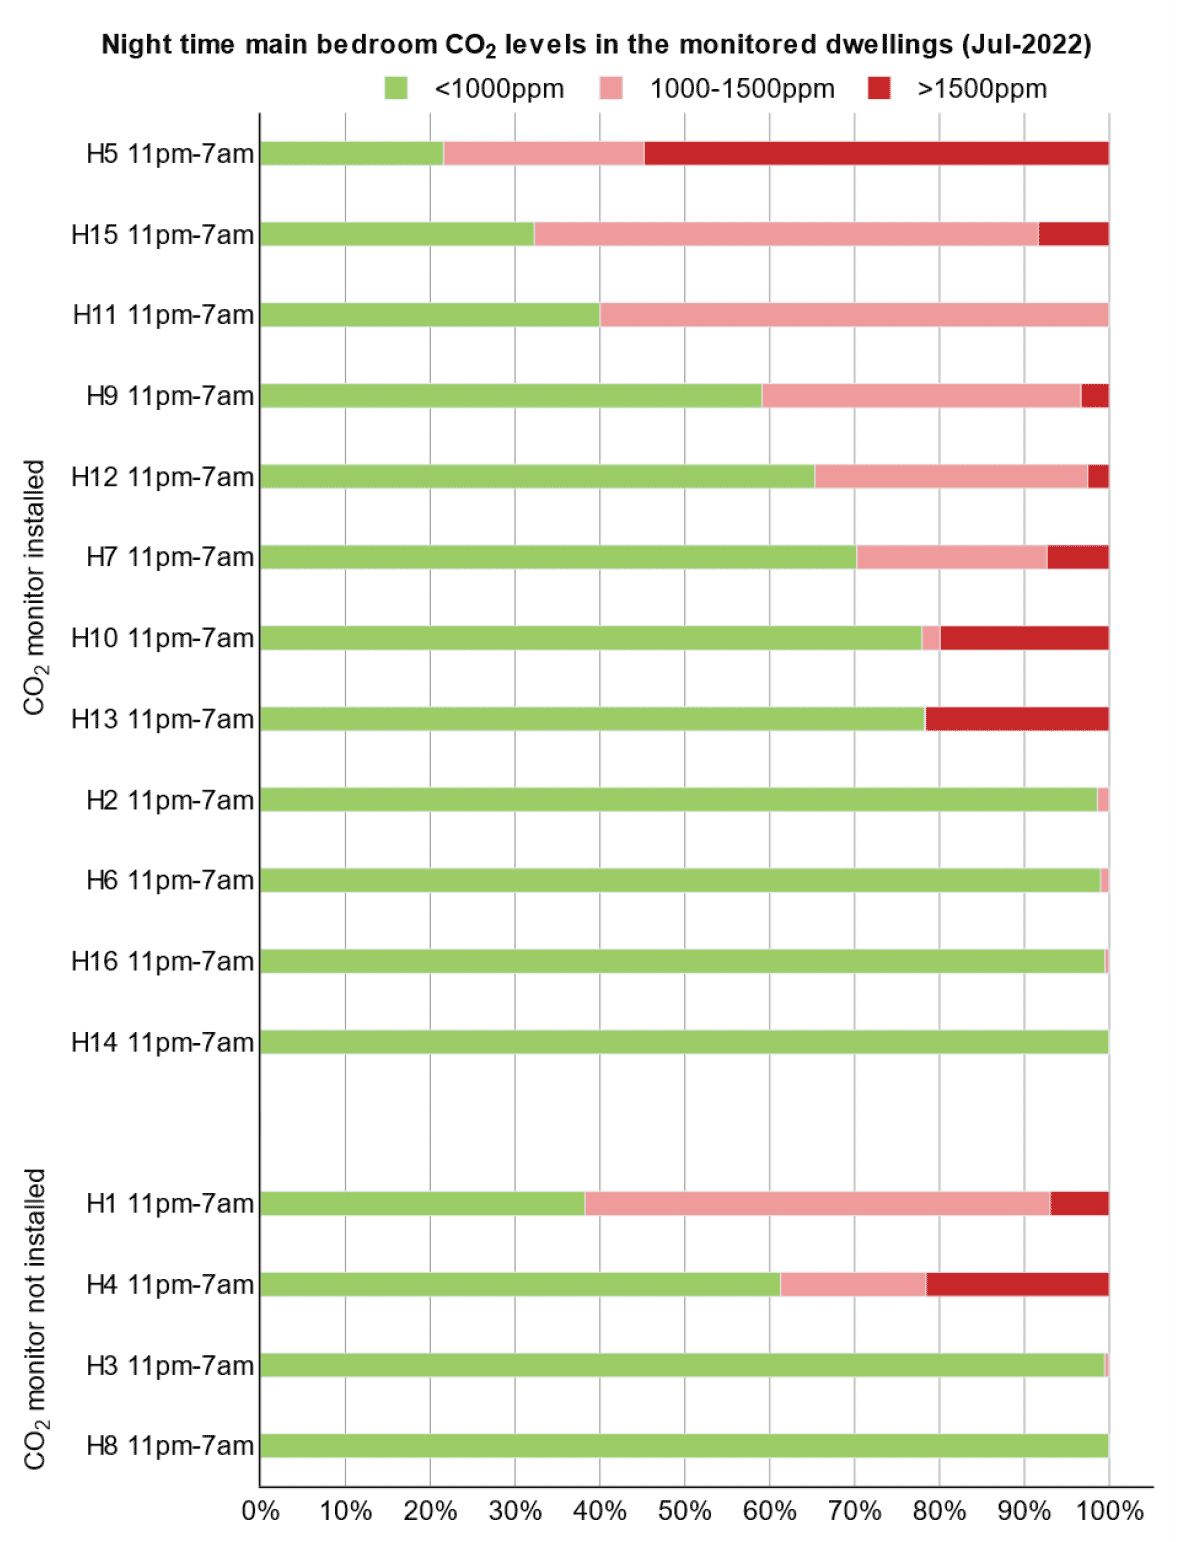
5.22. During summer (see figure 5.8 and figure 5.11), bedroom CO2 levels at night decreased as expected during this season. Interestingly, most homes still show averages of CO2 above 1000 PPM. In addition, night-time bedroom CO2 levels in H5 were above 1500 PPM for over 50% of the time, despite the occupant reportedly sleeping with the bedroom door open.
5.23. Another interesting finding was that in H1[12] (Passivhaus), while performance in winter and spring was optimal, CO2 levels in summer exceeded 1000 ppm for over 60% of the time. A possible explanation may be related to occupant's behaviour to keep heat out during this season.[13]
Relative Humidity
5.24. With regards to Relative Humidity in bedrooms overnight, all homes were found to be on average within a healthy range (40-60%) throughout spring, summer and winter periods. The exception is observed in H10[14] where the average levels of RH drop closed to 20% in April and 30% in July.
Temperature
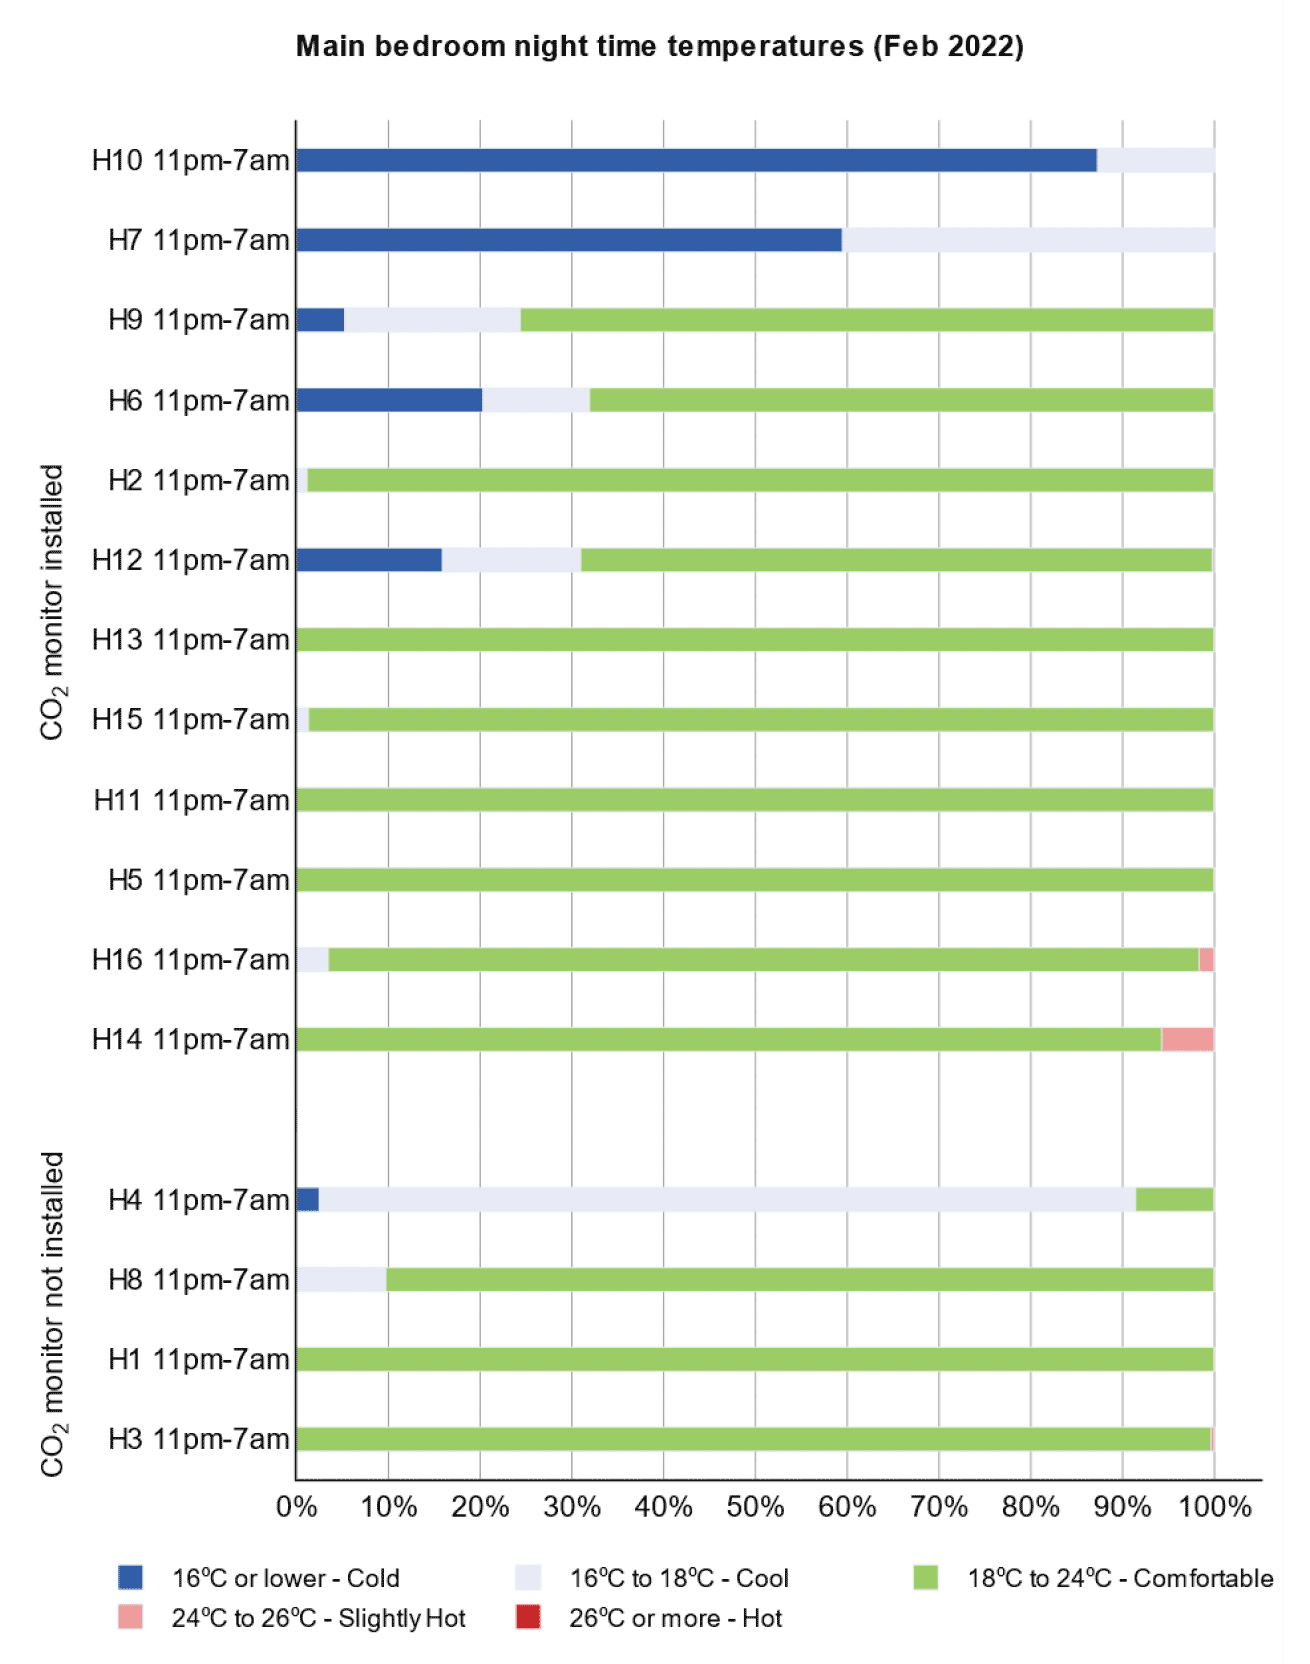
5.25. During winter, cold temperatures were found in some homes, especially in bedrooms at night (see figure 5.6 and figure 5.12). In H7[15], living room temperatures were below 16°C for 80 % of the time. At the time of the survey the occupant complained of the flat being draughty and with a heating system control difficult to manage.
5.26. The low temperatures recorded in winter in H7 correlate with the low CO2 concentrations recorded at the same time, suggesting high levels of (unwanted) air changes. A similar situation of low temperatures was found in H12[16], though in this case, the occupant overventilated due to concern regarding mould in the loft. The loft was not accessed for obvious health and safety reasons. Tenant from H12 pointed to the researchers at one home in the same development that had installed extra vent in the loft on their own initiative since the developer has not come to remedy this issue. Two monitored homes were affected by proliferous mould growing in the loft, which are H12 and H13.
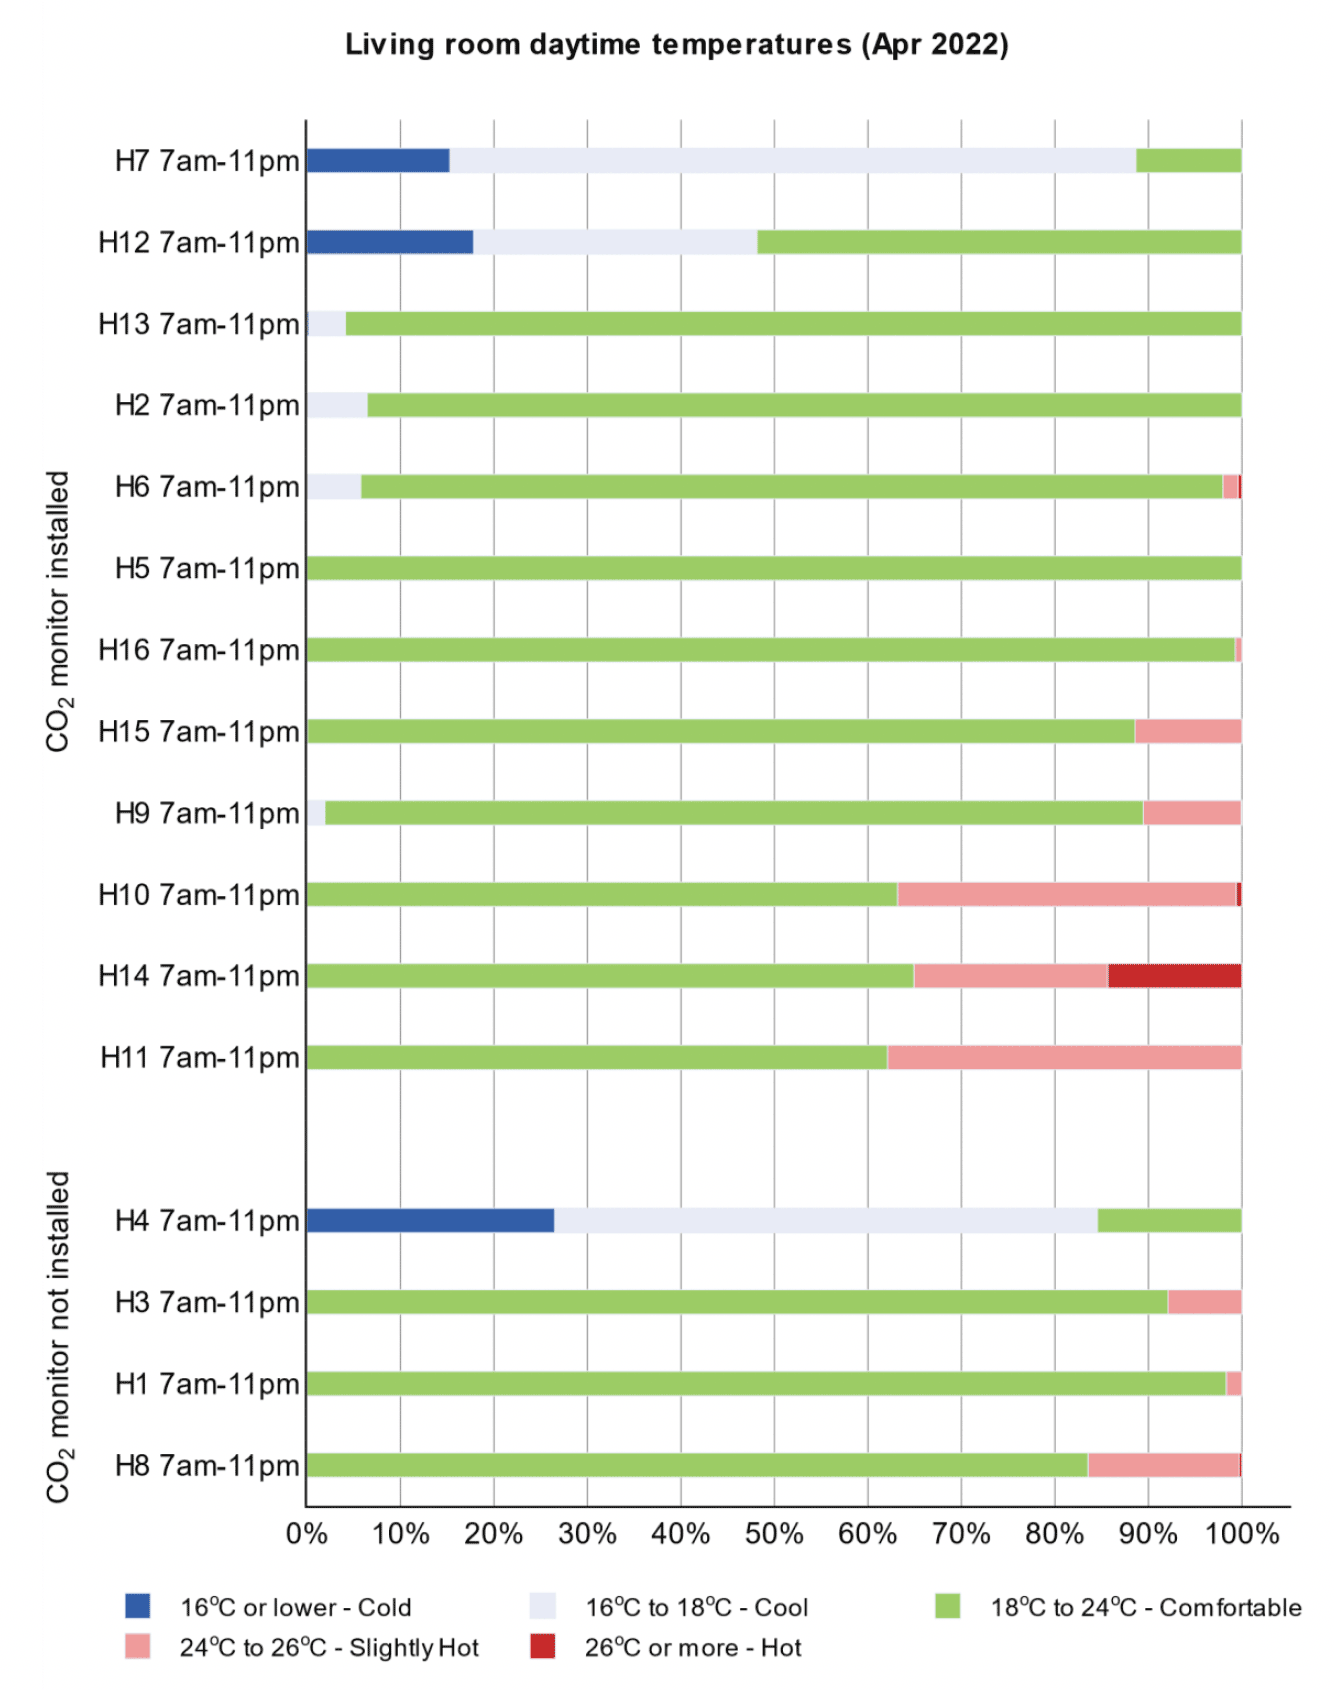
5.27. Indoor temperatures during spring were higher than winter, as expected (see figure 5.13). H10, H11 and H14 recorded more than 30% of time between 24-26°C and H14 exceeded 26°C for 15% of the daytime in the living room.
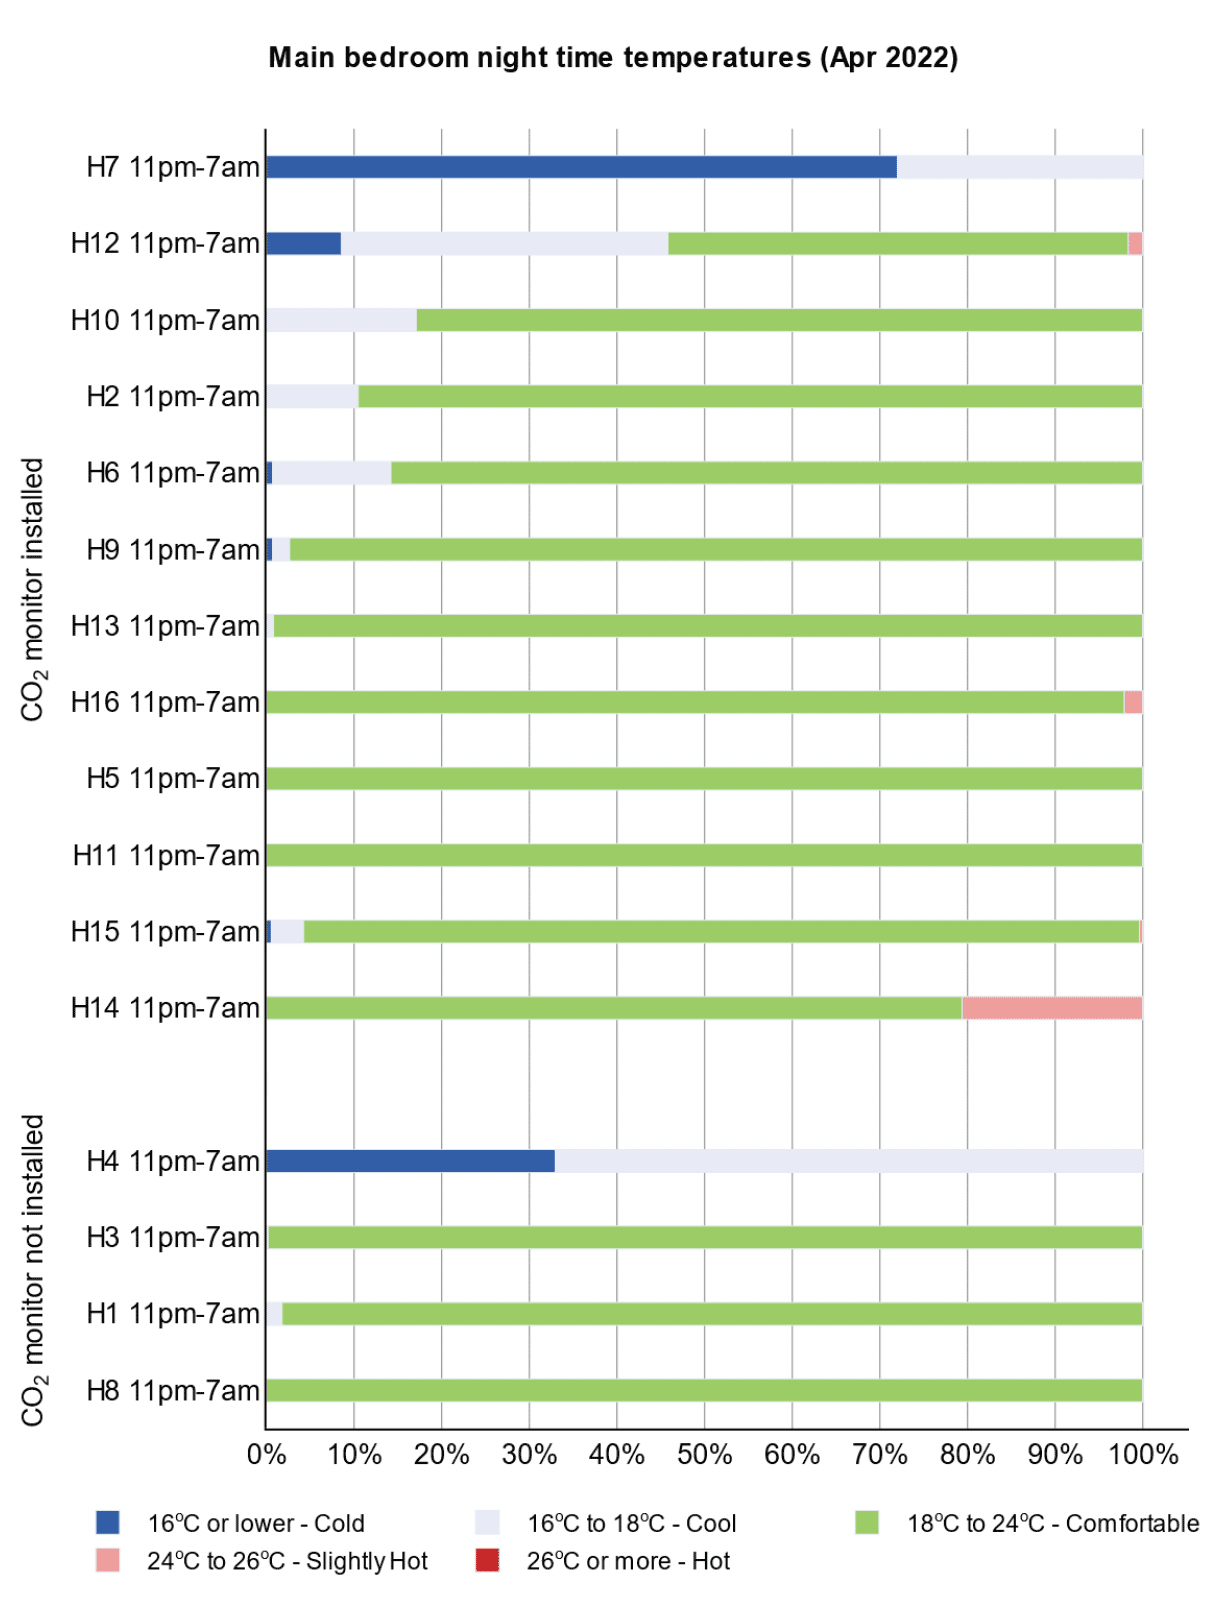
5.28. Cold temperatures were still observed in H7 during spring, with temperatures at 16 °C or lower for 70% of the time in the main bedroom at nighttime (see figure 5.14).
5.29. During the summer period, the UK experienced the most intense heat wave. During summer 2022, the UK experienced 2 heatwaves, in July and in August. The July heatwave reached the UK on 18th and 19th July [17] [source: 2022_03_july_heatwave (metoffice.gov.uk)]. On 19th July, a new record high temperature for Scotland of 34.8°C was recorded at Charterhall in the Scottish Borders, with temperatures in southern and eastern Scotland exceeding 30°C on the 18th and 19th July. The August heatwave in Scotland was not as intense, with temperatures reaching 28°C on the 13th and 14th August. [18] Importantly, during both heatwaves, air quality deteriorated across much of the UK, with the highest ground-level ozone concentrations observed in rural locations and furthest south. Although not experiencing the highest temperatures, Scotland did not escape the deterioration in air quality with significantly elevated ground-level ozone across South-East Scotland. [19]
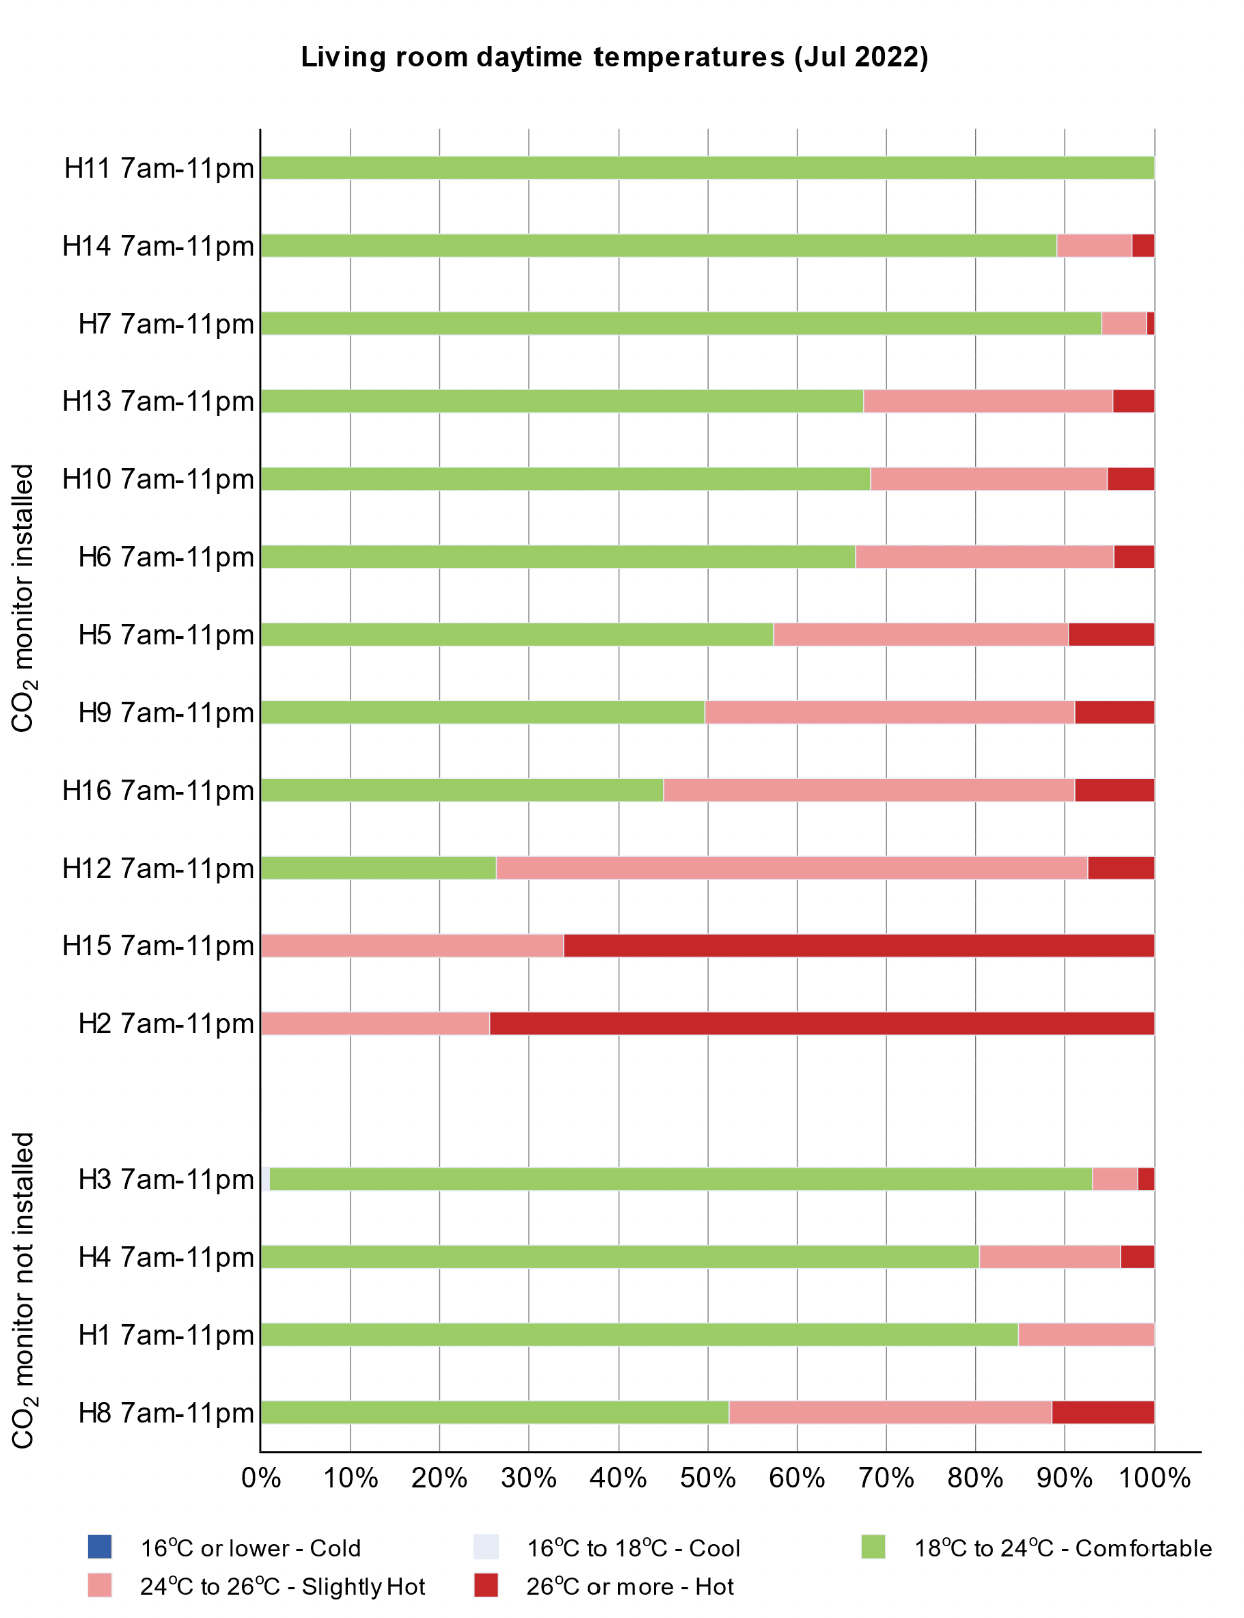
5.30. Generally, temperatures were mostly found to be high, and higher in the living rooms when compared to bedrooms (day and night). See figures 5.15 and 5.16.
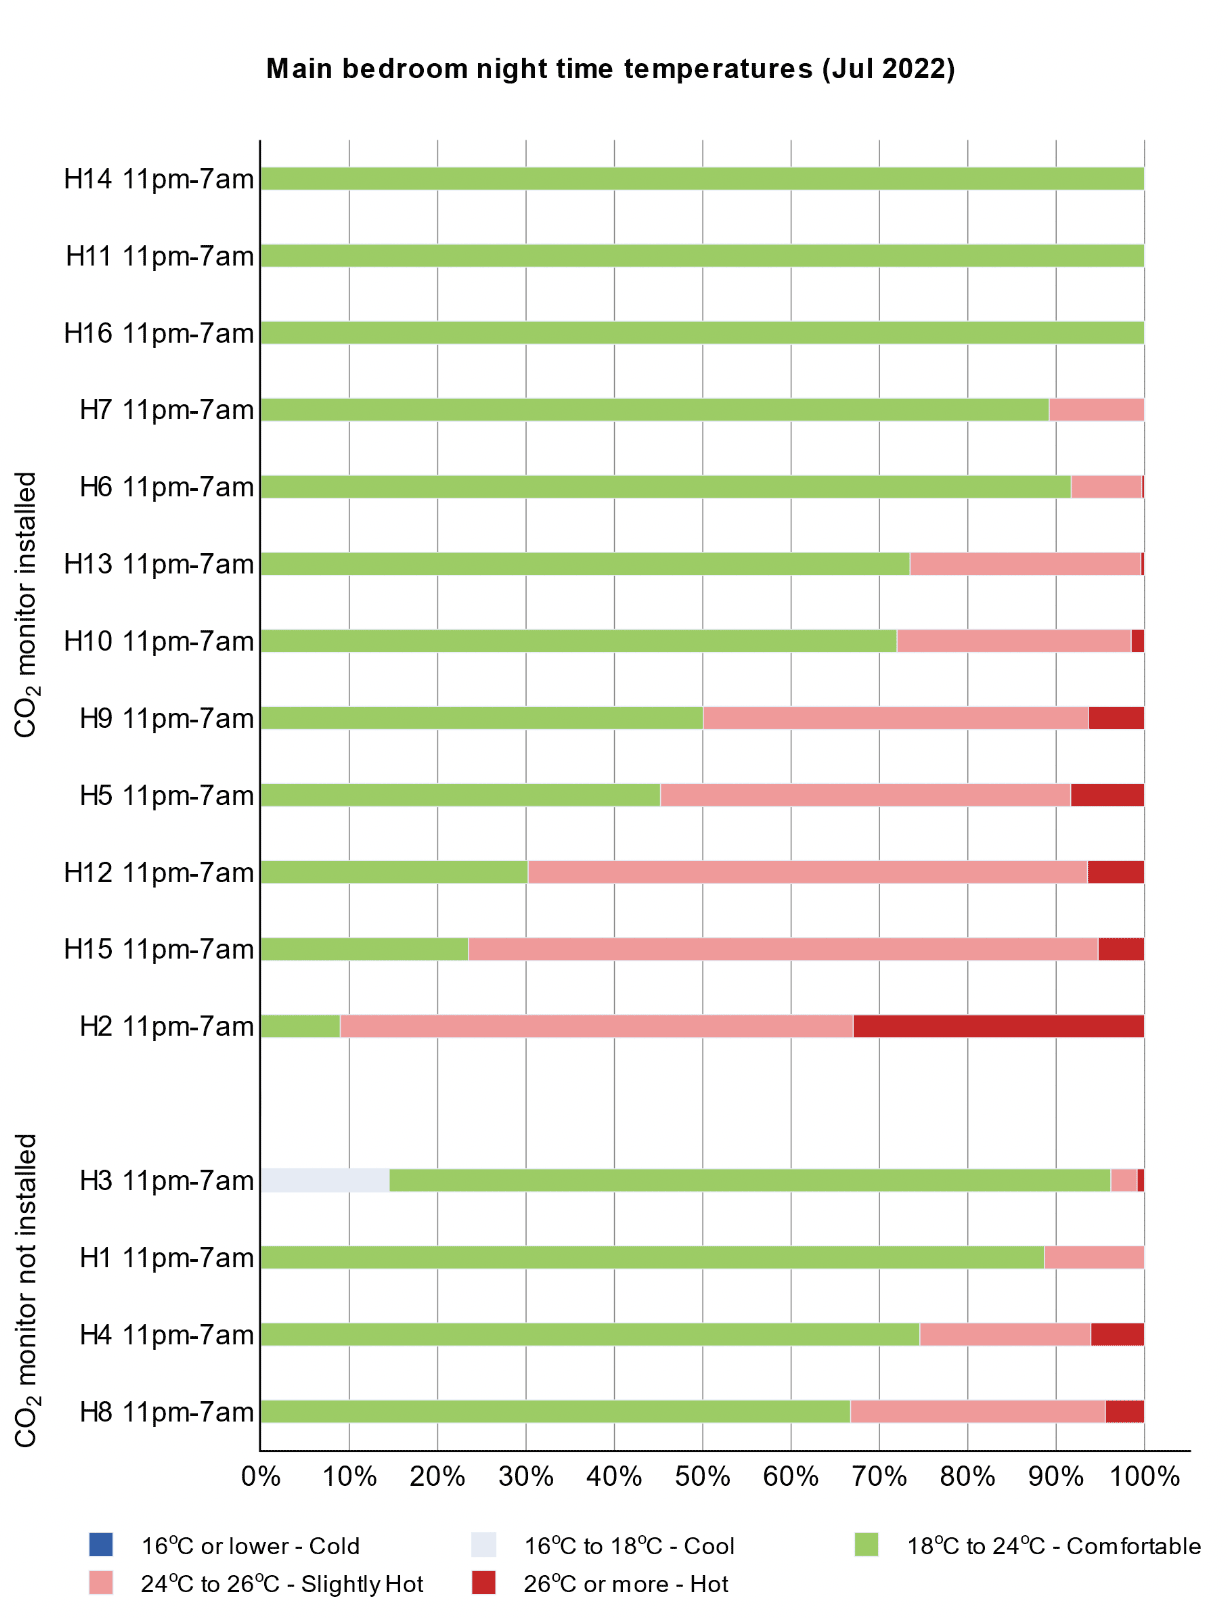
5.31. The measurement data found three homes to be overheating. In H2, living room temperatures exceeded 26°C for more than 70% of the time and in H15 for more than 60% of the time. Living room temperatures in both homes were consistently between 24°C and 26°C. This is worrisome since both homes are occupied by vulnerable people. H12 also showed high temperatures but mostly in the range of 24-26°C. The low CO2 concentrations recorded for that same period suggest that all 3 cases (H2, H15 and H12) opened windows to a great extent.
5.32. In bedrooms, overheating assessment against TM59-criterion-2[20] showed overheating on 8 homes out of 16. Further investigation is required to establish the main cause of overheating in these homes (i.e. whether due to layout and orientation, or other sources of uncontrolled heat gains).
5.33. In H2, bedroom night-time temperatures were between 24-26°C for over 90% of the time, with levels exceeding 26°C for over 30% of the time. Similarly, H15 and H2 recorded bedroom night-time temperatures between 24-26°C for over 70% of the time. The CO2 concentrations recorded in H2 for that same period suggest the room was adequately ventilated (the flat can perform cross ventilation) despite being a ground floor.
5.34. It is worth noting the results of H3. This is a converted church flat where the resident complained that the bedroom was too cold. During winter and spring, CO2 values were high, indicating poor ventilation. During summer H3 is the only home showing nighttime temperatures between 16-18°C in the bedroom at night. Looking at the CO2 levels for the same period, there is indication that the occupant provided ventilation throughout the night.
Summary
5.35. The ventilation audit performed in 16 homes show that ventilation design is not adequately provided. The ventilation audit performed in 16 homes found that dMEVs extraction rates below government recommendation (13 homes), insufficient door undercuts (9 homes), unclear labelling of dMEV switches(6 homes), dMEV systems turned off (8 homes), and lack of ventilation advice (12 homes)[21]. Householders reported several concerns with the dMEV system, including noise, draughts, and costs of running. Some of these concerns were evidenced, in particular noise and draughts.
5.36. From the results of CO2 concentrations in both living rooms and bedrooms in winter, spring, and summer it can be concluded that not all homes with CO2 monitors installed maintain indoor concentrations below 1000 ppm. Long term monitoring (WP3) began in Winter 2022 on 16 homes. Seasonal analysis took place and data analysis during winter and spring evidenced 6 homes with indication of poor indoor air quality throughout the dwelling, despite the presence of CO2 monitors in some of the bedrooms.
5.37. In terms of measured air quality throughout the 3 seasons, of the homes that were provided with CO2 monitors (12 out of 16), the results of peak CO2 concentrations in both living rooms and bedrooms in winter, spring were above 1000 ppm (see WP3-Chapter 5). Whilst it may be concluded that not all homes with CO2 monitors installed maintain indoor concentrations below 1000 ppm, the underlying causes of this were driven more by the poor ventilation implementation and poor ventilation compliance.
5.38. For temperatures, it was found that during July 2022, several homes suffer excessively high temperatures. In H2, living room temperatures exceeded 26°C for more than 70% of the time and in H15 for more than 60% of the time. This is worrisome since both homes are occupied by vulnerable people. The low CO2 concentrations recorded for that same period suggest that both homes (H2 and H15) opened windows to a great extent. In bedrooms, overheating assessment against TM59-criterion-2[22] showed overheating on 8 homes out of 16.
5.39. Whilst there is evidence that occupants use CO2 monitors to take actions, for bedrooms this would be reactive (i.e. in the morning) and less likely to affects overnight conditions. Nevertheless, some of the households with CO2 monitors (such as H2) did interact with the monitors various times a day.
5.40. Given that the homes surveyed were built to a higher standard of air tightness, the requirement of CO2 monitors is further justified and needed.
Contact
Email: buildingstandards@gov.scot