Recorded Crime in Scotland, 2020-2021
Statistics on crimes and offences recorded and cleared up by the police in Scotland, split by crime or offence group and by local authority. This bulletin also includes a new chapter which presents an estimate of how many cyber-crimes were recorded in Scotland during 2019-20 and 2020-21.
2. Main Findings: Recorded Crimes and Offences in Scotland
Total Recorded Crime
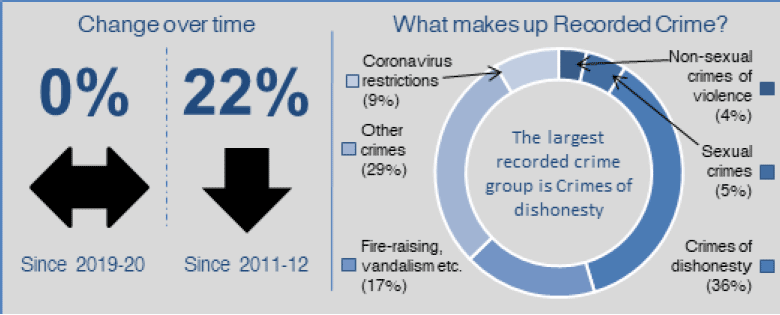
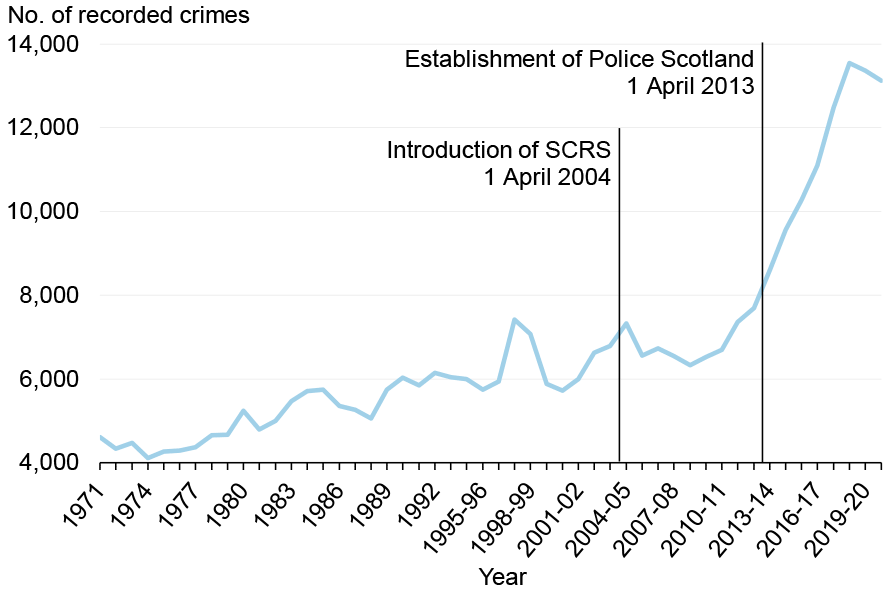
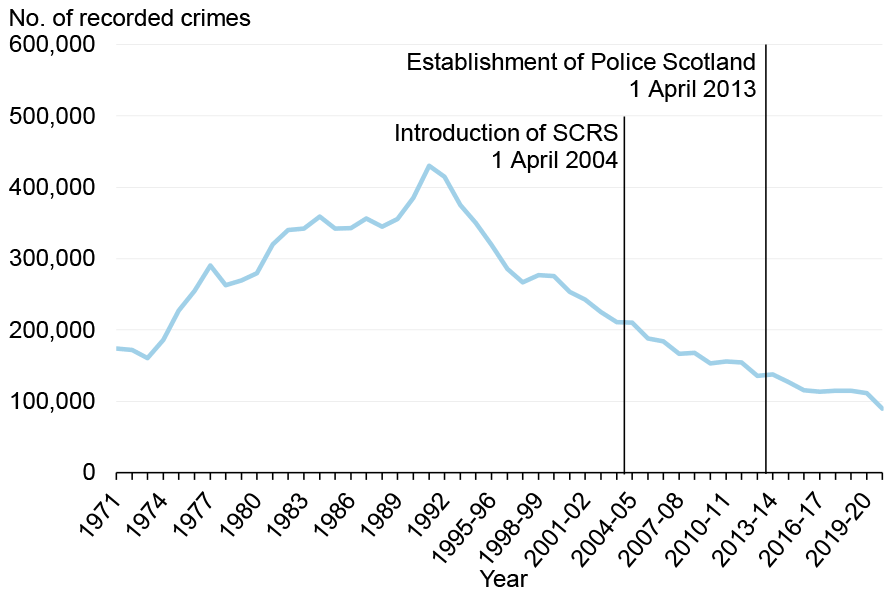
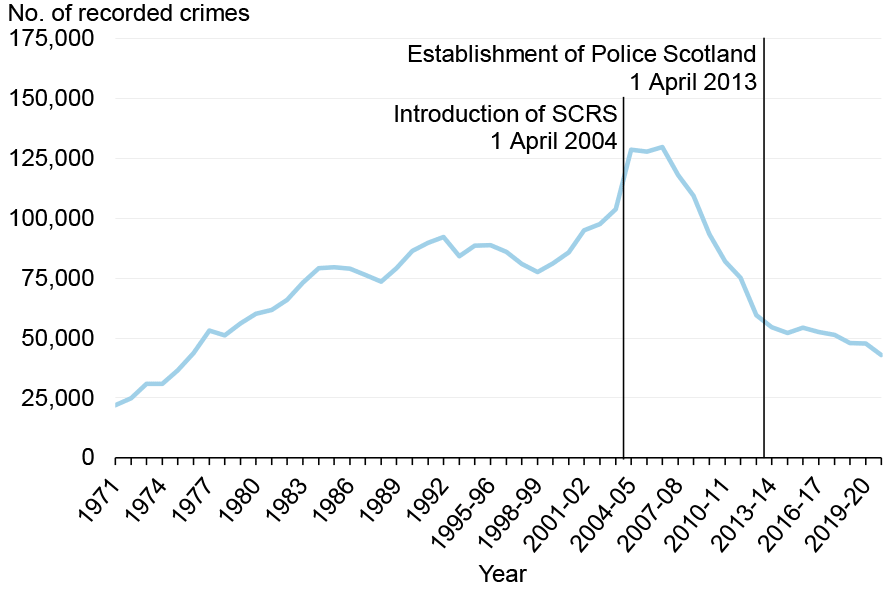
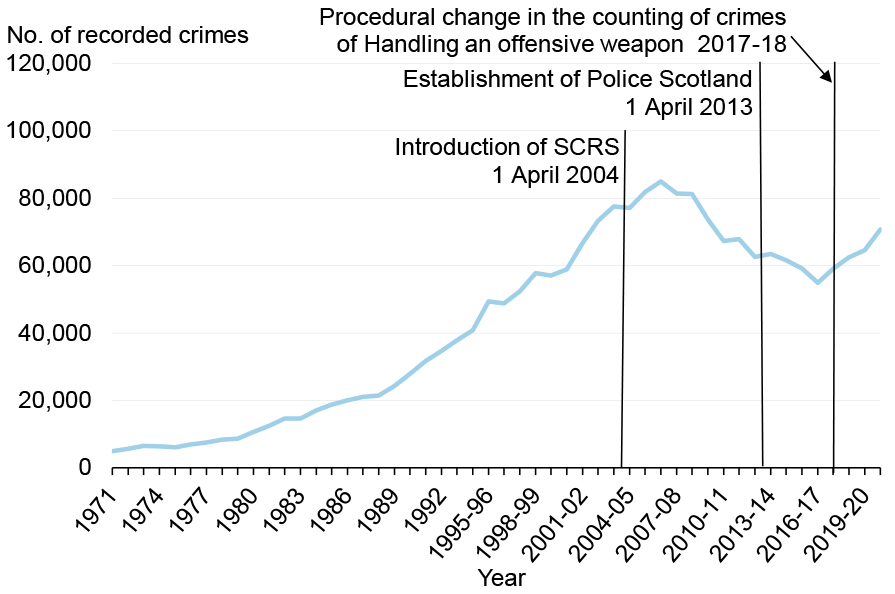
The recording of crime remains at one of the lowest levels seen since 1974. The total number of crimes recorded by the police in Scotland in 2020-21 was 246,511. This is 5 crimes (or less than 1%) lower than the level recorded in 2019-20 (Chart 1 and Table 1).
Over the past ten years, total recorded crime in Scotland has decreased by 22%, though has remained very stable since 2017-18. This is set against a generally decreasing trend in recorded crime over the longer term, from a peak in 1991 when crime reached a record high of 572,921.
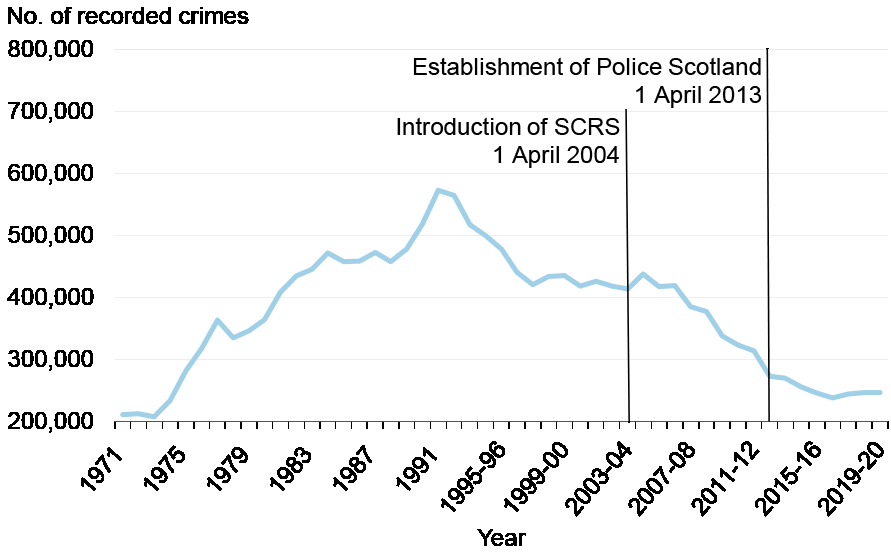
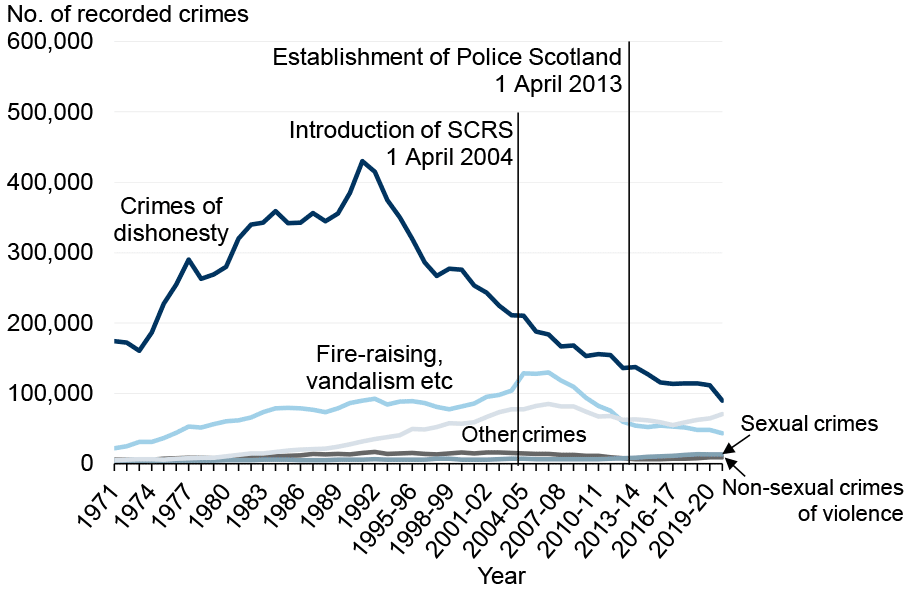
Chart 2 shows the number of recorded crimes in each of the five crime groups since 1971 and gives an indication of the scale of each crime group. Crimes of dishonesty are the largest group, accounting for 36% of all recorded crime in 2020-21. This was followed by Other crimes (29%), Fire-raising, vandalism etc. (17%), Sexual crimes (5%) and Non-sexual crimes of violence (4%). Crimes relating to coronavirus restrictions (not shown in the chart as only commenced in 2019-20) accounted for 9% of all recorded crime in 2020-21. These individual groups will be discussed in more detail in the sections which follow.
Local Authority analysis
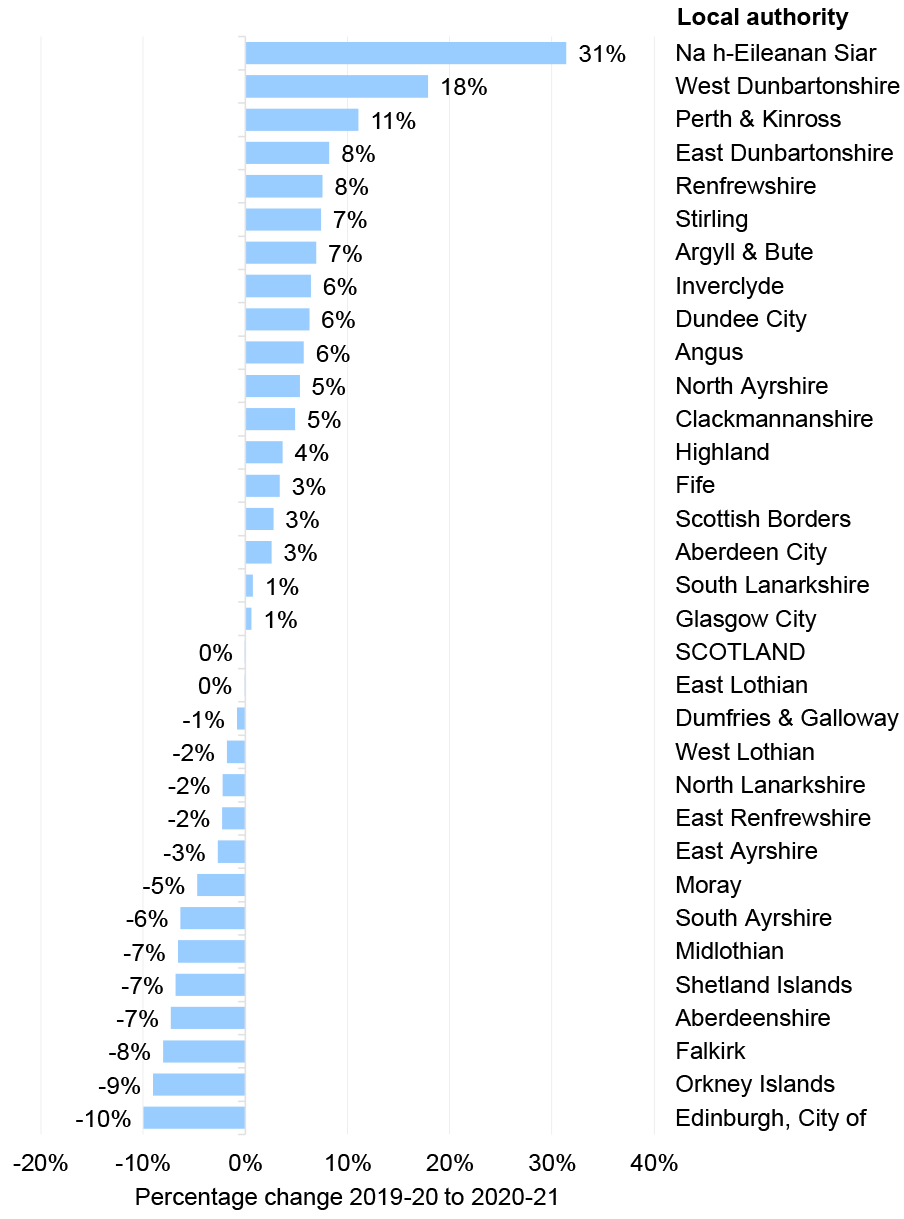
Eighteen local authorities showed an increase in total recorded crime between 2019-20 and 2020-21. One showed very little change, with the remaining thirteen showing a decrease from the previous year (Chart 3).
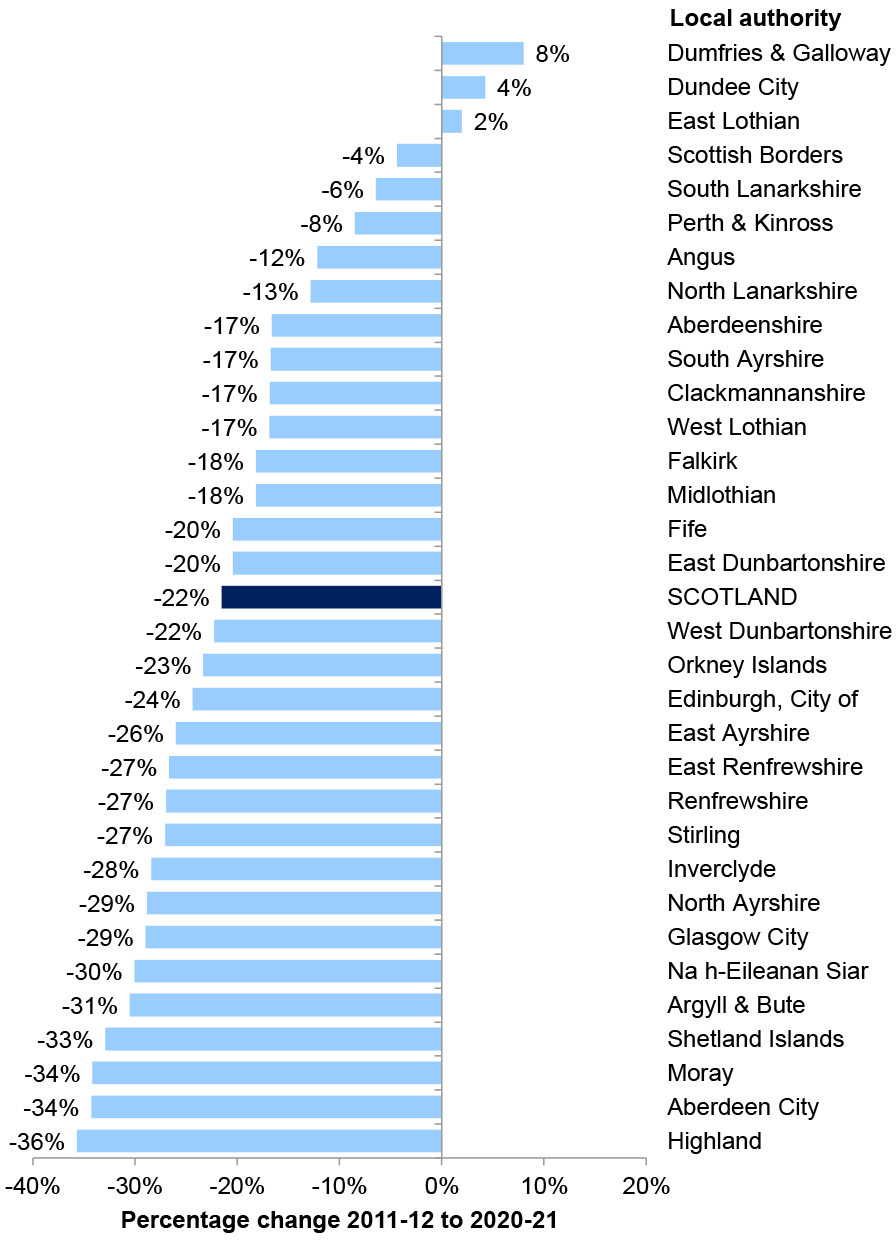
Notwithstanding that year-on-year figures can vary across local authorities, the long term trend of decreasing crime is broadly the same across Scotland. Chart 4 shows that since 2011-12, twenty nine out of thirty two local authorities have seen a reduction in recorded crime. The other three (Dumfries and Galloway, Dundee City and East Lothian) have seen an increase.
In 2020-21 the largest number of crimes recorded were in Glasgow City (see Table 5), which includes 12% of Scotland’s population but accounted for 18% of all recorded crime in Scotland. It should be noted that Glasgow’s daily population will be higher than its resident population as people travel into the city from surrounding local authority areas for work, leisure and other purposes. Crimes are recorded in terms of where they occur and not the home residency of the victim (where the two places are different locations). The comparison described above for overall crime levels should be viewed in this context – which will also likely apply to Scotland’s other city based local authorities.
Further explanation of these trends is set out in the following sections for each crime group. Please note that further local authority level data for Tables 1-4 can be accessed online via dropdown menus in the excel spreadsheet (see ‘Supporting files’ at the top right hand side of the webpage): Recorded Crime in Scotland, 2020-21
Crime rate per 10,000 population
There were 451 recorded crimes per 10,000 population in 2020-21, with two of Scotland’s city based areas recording the highest rates; Dundee City (688 per 10,000 population) and Glasgow City (682 per 10,000 population). This was followed by West Dunbartonshire (632 per 10,000 population), reflecting a high rate of Coronavirus restrictions crimes per 10,000 population (see Table 4 in ‘Supporting files’).
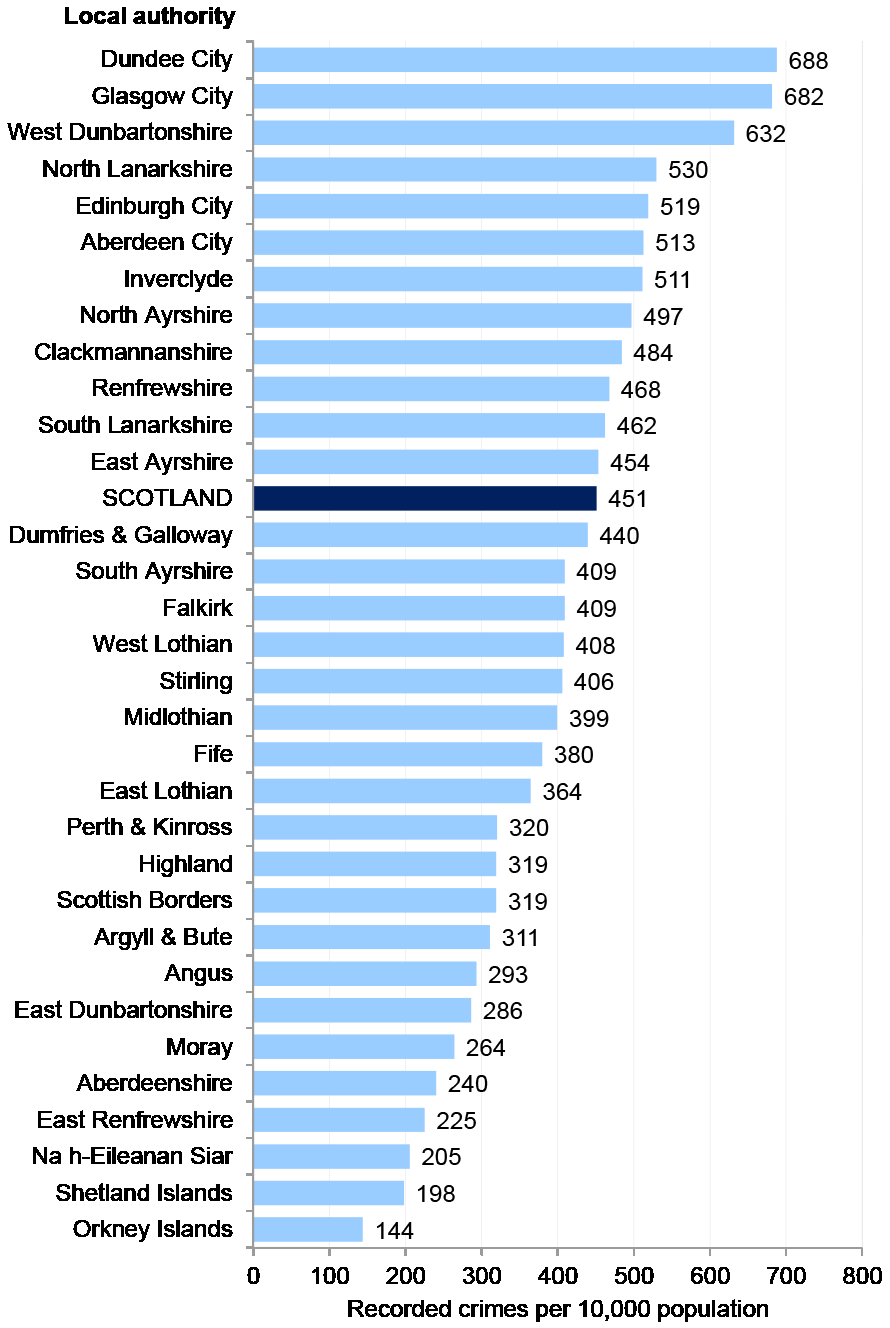
1 Population estimates are as at mid-year 2019 from the National Records of Scotland (Mid-Year Population Estimates | National Records of Scotland (nrscotland.gov.uk)).
Data considerations
As well as the new crimes being recorded under (i) the Coronavirus restrictions legislation and (ii) as a result of a procedural change to the recording of international crime (referred to above in the Background to this bulletin), previous legislative changes and changes to recording will have some effect on the longer term time series.
Domestic Abuse (Scotland) Act 2018
The Domestic Abuse (Scotland) Act 2018 came into force on 1st April 2019. The Act created a new offence of abusive behaviour as a course of conduct towards a partner or ex-partner. Prior to the 1st April 2019, any criminal act which formed part of a domestic abuse incident (such as a Common assault or Threatening or abusive behaviour) was included within the statistics under the relevant crime or offence. Where there is evidence of a course of conduct, new crime codes of Domestic abuse (Scotland) Act 2018 (against a male or female victim) have been created. In general, existing common law and statutory offences will continue to be recorded where appropriate, in addition to the new crimes. There are some limited exceptions (in particular Threatening and abusive behaviour), which will no longer be recorded when occurring as part of a course of conduct for Domestic Abuse. However these exceptions all relate to activity in Group 6 Miscellaneous Offences and therefore this change does not create a discontinuity within the total recorded crime figure for Scotland (which is based on Groups 1 to 5).
Changes in 2017-18 to the recording of handling offensive weapons
Changes in recorded crime from 2017-18 should be treated with some caution due to the addition of newly recorded crimes of handling an offensive weapon. Further information on this procedural change and its impact on the statistics is available in the chapter on Group 5 - Other crimes. This change will have an impact on the comparability of recorded crime statistics for all years prior to 2017-18. However the impact will be smaller for earlier years (for example comparisons with 2011-12) when set against the long term changes in total crime recorded by the police and other legislative and procedural changes made to the recording of crime during this period.
Data validation
HMICS Crime Audit 2020: Background
This bulletin reports on the number of crimes and offences recorded by the police in Scotland. In 2020, Her Majesty’s Inspectorate of Constabulary in Scotland (HMICS) published an audit which assessed the extent to which police recording practices complied with the Scottish Crime Recording Standard and Counting Rules: https://www.hmics.scot/publications/crime-audit-2020.
This audit found no systemic data quality issues around the recording of crimes and offences, with the resulting report stating that ‘Police Scotland’s compliance with the Scottish Crime Recording Standard and Counting Rules is generally good at over 90%’. 91.4% of incidents were closed correctly[1] and 90.8% of crime was counted and classified correctly.
For a more detailed discussion of the results of the audit and its relation to recorded crime, please see the User Guide: Recorded crime in Scotland: user guide - gov.scot (www.gov.scot)
Group 1 – Non-sexual Crimes of Violence
Number of Non-sexual crimes of violence recorded in 2020-21
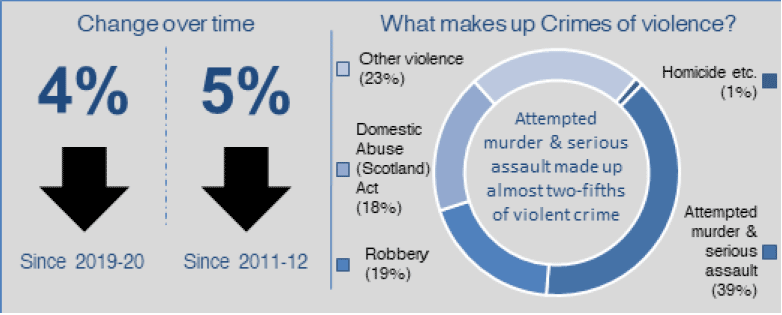
Non-sexual crimes of violence account for 4% of all crimes recorded in Scotland in 2020-21. Between 2019-20 and 2020-21, the number of Non-sexual crimes of violence recorded by the police in Scotland decreased by 4%, from 9,316 to 8,972.
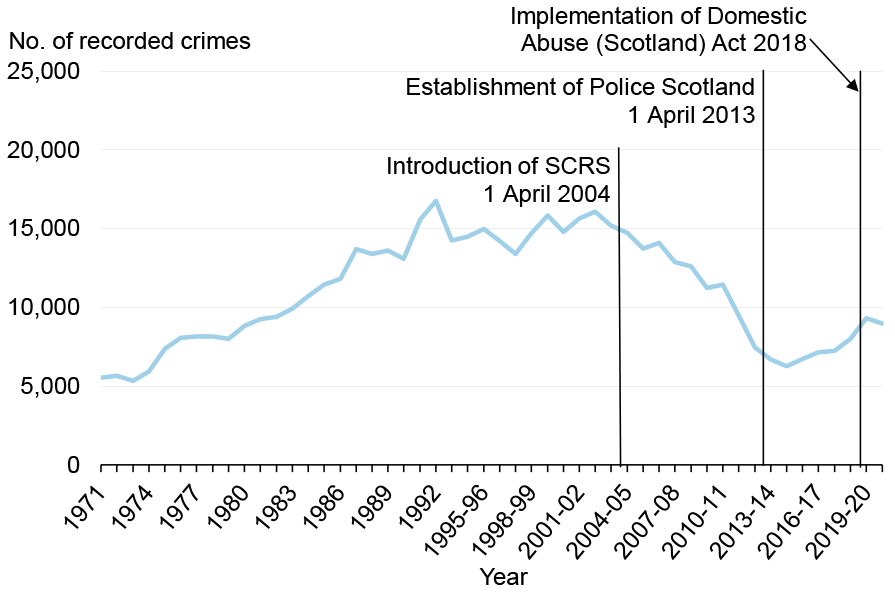
Chart 6 below shows the number of Non-sexual crimes of violence from 1971 onwards. Levels of violent crime increased for a long period, before entering a downward trend in 2002-03. Until 2020-21 there have been more recent increases, although the 2019-20 increase was due to new crimes being recorded under the Domestic Abuse (Scotland) Act 2018 following its enactment on the 1st April 2019. There has been a 41% reduction in Non-sexual crimes of violence since 2002-03.
1 Crimes recorded for the present crime groups are not available prior to 1971.
In 2020-21, the national rate of recorded Non-sexual crimes of violence decreased from 17 to 16 crimes per 10,000 population (see Tables 4 and 7).
Chart 7 shows the five categories within Non-sexual crimes of violence over the last ten years, and gives an indication of the trend and scale of each category. In 2020-21, the volume of recorded crimes of Attempted murder and serious assault made up 39% of all Non-sexual crimes of violence. Crimes of Robbery and Other violence accounted for 19% and 23% respectively. Crimes under the Domestic Abuse (Scotland) Act 2018 accounted for 18% of the total number of Non-sexual crimes of violence. Homicide etc. continues to contribute a very small proportion (1%) to the total.
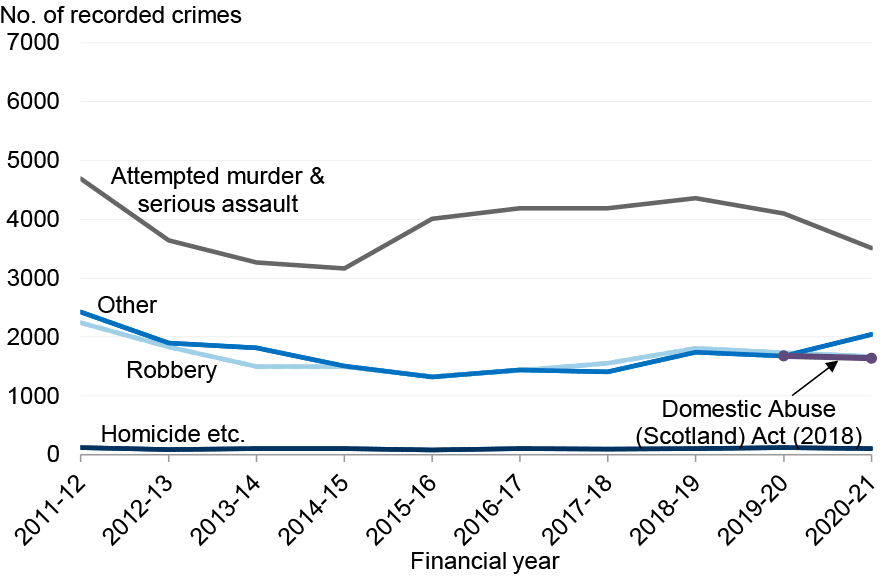
Attempted murder & serious assault
Attempted murder and serious assault is the largest category in Group 1, accounting for 39% of all Non-sexual crimes of violence. This category experienced a decrease of 14% between 2019-20 and 2020-21. Over the ten year period from 2011-12 to 2020-21, this category has seen a decrease of 25%. These crimes fell between 2011-12 and 2014-15, before rising sharply in 2015-16 and then more gradually in the years that followed, until the decrease over the past two years. At least part of the increase in 2015-16 has been attributed by Police Scotland to the introduction of enhanced guidance for recording serious assault in January 2015.
For the definition of Serious assault and the distinction between Serious assault and Common assault please see Paragraph 7.17 within Annex 1.
We earlier published the findings of a separate study into Attempted murder & serious assault. Further information is available via the following link: https://www.gov.scot/publications/recorded-crime-scotland-attempted-murder-serious-assault-2008-09-2017-18/
Data Comparisons: Emergency Hospital Admissions as a result of Assault
As highlighted above, there has been a 25% decrease in the number of attempted murders and serious assaults recorded by the police between 2011-12 and 2019-20, from 4,693 to 3,511. Another source of statistics on assault is Public Health Scotland’s annual publication on hospital admissions due to unintentional injuries. This includes the number of emergency hospital admissions for assault.
The latest figures (2019-20) are available at: Unintentional injuries - Hospital Admissions: Year ending 31 March 2020 - Public Health Scotland
It is not possible to make direct comparisons between the two sources for various reasons (for example not all who attend hospital with assault injuries will report what has happened to the police). However, as these sources both generally relate to how Scotland’s emergency services respond to the most serious types of assault, it would be anticipated that both should show similar trends over time.
There were 2,280 emergency hospital admissions as a result of assault in 2019-20, of which 541 were due to assault with a sharp object and 1,750 were other assaults[2]. This represents 48% fall in the total number of emergency admissions due to assault since 2011-12, including a 42% reduction in the number of emergency admissions due to assault with a sharp object. This comparison confirms that the reduction in police recorded crimes of attempted murder and serious assault over the past 10 years has also been broadly reflected in statistics for emergency admissions to hospital. Whilst the reduction in hospital admissions appears to be larger than that for recorded crime, the change in guidance for crimes classed as serious assaults in 2015 may have had an impact on these figures.
Robbery
Robbery accounted for 19% of Non-sexual crimes of violence. Over the ten year period from 2011-12 to 2020-21, this category has seen a decrease of 25%. Following increases between 2016-17 and 2018-19, there have been decreases for the past two years.
We earlier published the findings of a separate study into Robbery. Further information is available via the following link: https://www.gov.scot/publications/recorded-crime-scotland-robbery-2008-09-2017-18/
Homicide etc.:
As well as Murder and Culpable homicide (common law), the Homicide etc. category included in this bulletin contains the crimes of:
- Causing death by dangerous driving;
- Causing death by careless driving when under influence of drink or drugs;
- Causing death by careless driving;
- Illegal driver involved in fatal accident; and
- Corporate homicide.
Homicide etc. accounted for 1% of Non-sexual crimes of violence. This category decreased by 17% from 121 crimes in 2019-20 to 100 crimes in 2020-21. Most categories experienced a decrease, however the biggest contributor was in driving related homicides, which fell by 16 crimes (from 55 to 39).
Data comparisons: Homicide
A separate Homicide in Scotland bulletin is produced by the Scottish Government which contains more detailed information on the crimes of Murder and Culpable homicide (common law). This bulletin presents characteristics of victims and accused, such as age and gender, as well as the circumstances of the homicide. We therefore recommend that users interested in Homicide statistics should refer directly to the Homicide in Scotland bulletin series, which can be accessed at: https://www.gov.scot/collections/homicide-in-scotland-statistics/.
The next Homicide in Scotland statistical bulletin will contain data for 2020-21 and will be published on October 26th 2021.
Domestic Abuse (Scotland) Act 2018
There were 1,641 crimes recorded under the Domestic Abuse (Scotland) Act 2018 in 2020-21, the second year this legislation has been in place. Of those crimes, 94% (or 1,545) involved a female victim and 6% (or 96) had a male victim, the same proportions as the previous year.
It should be noted that crimes under the Domestic Abuse (Scotland) Act relate to a course of conduct only and therefore do not include all crimes relating to domestic abuse. For more information on separate analysis of domestic abuse incidents reported to the police, please the separate Domestic abuse: statistics recorded by the police in Scotland Official Statistics bulletin. This is produced by the Scottish Government and contains details of domestic abuse incidents and crimes recorded by Police Scotland, including characteristics of victims and perpetrators, such as their age and gender.
The next Domestic abuse recorded by the police in Scotland bulletin will contain data for 2020-21 and will be published in November 2021.
Data validation: Domestic Abuse
The HMICS Crime Audit 2020 examined 3,150 incidents relating to domestic abuse, 1,001 of which resulted in a crime record. HMICS found that the compliance was good overall, as:
- 94.6% of domestic abuse incidents were closed correctly, which is a higher compliance rate than the other categories examined.
- 92.6% of domestic abuse crime records were counted and classified correctly.
- 95.2% of domestic abuse crimes were recorded within 72 hours of the incident being reported to the police, with ten of the thirteen divisions achieving over 95% compliance.
The full findings and analysis from this audit can be found in the HMICS Crime Audit 2020 publication: HMICS | Crime Audit 2020
Other non-sexual violence
The Other violence category includes crimes such as Cruelty to & unnatural treatment of children, Threats & extortion and Abduction, which together account for 87% of the crimes within this category. More detail is provided in the User Guide.
Crimes recorded as Other violence account for 23% of Non-sexual crimes of violence. Over the ten year period from 2011-12 to 2020-21 this category has seen a decrease of 16%, however there was an increase of 22% from 1,679 in 2019-20 to 2,047 in 2020-21.
This increase was primarily due to a rise in crimes of Threats & extortion, over three-quarters of which were estimated to be cyber-crimes in 2020-21 (further information on this change is available in the Cyber-crime Chapter).
Group 2 – Sexual Crimes
Number of Sexual crimes recorded in 2020-21
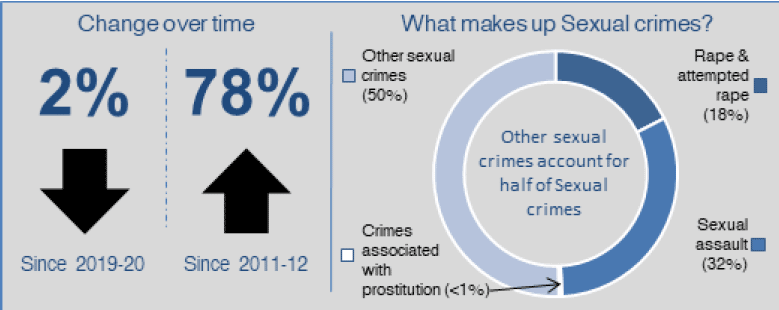
Sexual crimes account for 5% of all crimes recorded in Scotland in 2020-21. The number of Sexual crimes recorded by the police in Scotland decreased by 2% from 13,364 in 2019-20 to 13,131 in 2020-21.
Chart 8 below shows the number of Sexual crimes from 1971 onwards. Sexual crimes have been on a long-term upward trend since 1974, with some fluctuations. Prior to the small decrease in 2019-20, there had been increases each year since 2008-09.
The national rate of recorded Sexual crimes remained at 24 crimes per 10,000 population in 2020-21 (see Tables 4 and 7).
1 Crimes recorded for the present crime groups are not available prior to 1971.
Whilst the specific age of the victim cannot generally be determined from the data supplied by Police Scotland, many of the sexual crime codes used by the police to record crime make it clear when the victim was aged under 18 (for example, Sexual assault of older male child (13-15 years))[3]. By adding up all these crime codes, we know that at least 39% of the 13,131 sexual crimes recorded in 2020-21 by the police related to a victim under the age of 18. This proportion is similar to recent years.
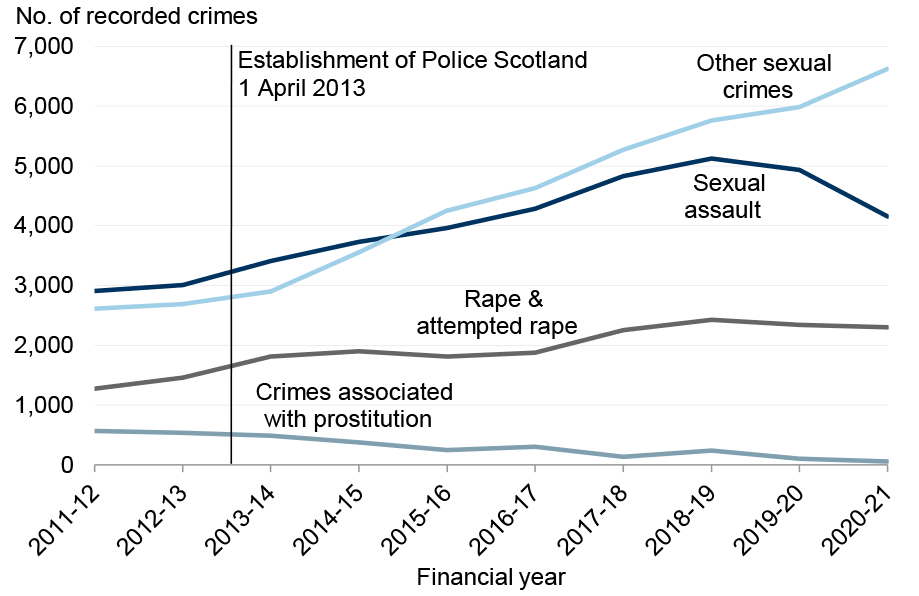
Chart 9 shows the four categories within Sexual crimes over the last ten years, and gives an indication of the trend and scale of each category. In 2020-21, Other sexual crimes made up 50% of all Sexual crimes. Sexual assault and Rape and attempted rape accounted for 32% and 18% respectively of sexual crimes. At less than 1%, Crimes associated with prostitution continue to represent a very small proportion of the total.
The number of recorded crimes in the Other sexual crimes and Sexual assault categories have changed markedly over time. They almost converged after 2010, which coincides with the implementation of the Sexual Offences (Scotland) Act 2009. They both increased during the years that followed, with Other sexual crimes overtaking Sexual assault as the largest category. Information on the impact of the Sexual Offences (Scotland) Act 2009 is available under ‘Data Considerations’ below.
Table A1 contains more detailed breakdowns for Sexual crimes.
Sexual assault
Sexual assault accounted for 32% of Sexual crimes in 2020-21. This category was on an upward trend since 2011-12, having increased by 76% between then and 2018-19. Sexual assaults then fell in both of the latest years, including a 16% decrease from 4,936 in 2019-20 to 4,154 in 2020-21.
Rape & attempted rape
Rape & attempted rape accounted for 18% of Sexual crimes. Similar to Sexual assault, after an upward trend from 2011-12 to 2018-19, there have been decreases over the past two years, including a 2% decrease from 2,343 in 2019-20 to 2,298 in 2020-21.
Crimes associated with prostitution
Crimes associated with prostitution account for less than 1% of Sexual crimes. Over the ten year period from 2011-12 to 2020-21, these crimes have seen a large fall of 90%, including a 45% decrease since 2019-20. This year’s figure (56 crimes) is the lowest over the last ten years.
Almost half (48%) of the crimes recorded in 2020-21 were in the Glasgow City area, with a further 21% recorded in Aberdeen City.
Other sexual crimes
The Other sexual crimes category includes crimes such as Communicating indecently; Taking, possessing and distributing indecent photos of children; Sexual exposure, Public indecency and Causing to view sexual images or activity. From 2017-18 onwards it also includes Disclosing or threatening to disclose an intimate image.
The implementation of the Abusive Behaviour and Sexual Harm (Scotland) Act 2016 has had an impact on any comparisons with data prior to 2017-18. The Act led to new crimes of Disclosing or threatening to disclose an intimate image being recorded from 2017-18 onwards, with 780 being recorded in 2020-21 (this is part of an increasing trend). As such, part of the increase in Other sexual crimes since 2016-17 is due to this legislative change. Further information is available in the ‘Data Considerations’ section below.
Other sexual crimes are the largest category in Group 2, accounting for 50% of Sexual crimes. This category has been on an upward trend for some time, with crimes increasing by 154% since 2011-12 (from 2,612 to 6,623), including an 11% increase from 5,984 in 2019-20.
We earlier published the findings of a research project into Other sexual crimes, which suggests that cyber enabled Other sexual crimes (i.e. where the internet has been used as a means to commit the crime) contributed around half to the total growth in all recorded Sexual crimes between 2013-14 and 2016-17. Further information is available via the following link: https://www.gov.scot/publications/recorded-crime-scotland-sexual-crimes-2013-14-2016-17/
More recently, the number of Other Sexual Crimes that are cyber-crimes has continued to grow. An estimated 66% of this category were cyber-crimes in 2020-21, compared to 54% in 2019-20 (further information on this change is available in the Cyber-crime Chapter).
Data considerations
A number of legislative and procedural changes should be kept in mind when reviewing trends in sexual crime over the longer term.
Sexual Offences (Scotland) Act 2009
The implementation of the Sexual Offences (Scotland) Act 2009 on 1st December 2010 resulted in a number of changes to the recording of sexual crimes, including a redistribution of Group 2 crimes among the subcategories and a widened definition of rape. A number of crimes which may have been recorded as Breach of the peace prior to the implementation of the Act would also not have shown up as sexual crimes before December 2010. Comparisons with data prior to 2010-11 for these categories should therefore be treated with caution.
Taking, distribution etc. indecent photos of children
In 2010-11, incidents of Taking, distribution etc. indecent photos of children were transferred from Group 6 Miscellaneous offences to Group 2 Sexual crimes and back-revised to 2009-10. Whilst these crimes represent a small proportion of sexual crimes (5% of all Group 2 Sexual crimes in 2020-21), it has resulted in a small discontinuity in the time series for any analysis that spans 2009-10.
Communications Act (2003) Sexual
In 2017-18, Communications Act 2003 (Sexual) offences were transferred from Group 6 Miscellaneous offences to Group 2 Sexual crimes.
This change involved reclassifying some activity from an offence group to a crime group, and so resulted in a small increase in total recorded crime, with 354 recorded in 2020-21. Statistics for 2016-17 were back-revised within the 2017-18 bulletin, to ensure time series continuity was not affected. There will be some discontinuity for earlier years as Communications Act 2003 offences with a sexual element were not separately identifiable within the statistics until 2016-17.
Abusive Behaviour and Sexual Harm (Scotland) Act 2016
Finally, the implementation of the Abusive Behaviour and Sexual Harm (Scotland) Act 2016 on 3rd July 2017 resulted in new crimes of Disclosing or threatening to disclose an intimate image being recorded. This has contributed to the increase in Other sexual crimes. Whilst some of these cases may have been recorded as a different crime or offence had they occurred prior to the Act, it is likely the majority of them would not have been classified as a Sexual crime. The enactment of this legislation also extended the criminal law to criminalise certain conduct that previously may not have been illegal.
There were 780 crimes of Disclosing or threatening to disclose an intimate image in 2020-21.
Historical (non-recent) reporting
In addition to the legislative and procedural changes outlined above, the issue of historical reporting of sexual crime also continues to play a role in the latest statistics. Further information from Police Scotland suggests that just over a quarter (26%) of sexual crimes in 2020-21 were recorded at least one year after they occurred and that this figure is similar to the previous year. Furthermore, as discussed below the use of specific codes to record sexual crime also highlights where these cases are historical.
Table A1 reports 905 crimes of Lewd and libidinous practices in 2020-21. These crimes should all relate to offences which occurred prior to the implementation of the Sexual Offences (Scotland) Act 2009 on 1 December 2010, as the Act replaced Lewd and libidinous practices with specific sexual assault crimes. As a result, we know that these are historical (non-recent) offences. Similarly, there were 211 crimes of Sexual assault committed prior to 1 December 2010.
Data comparisons
This segment includes information that should be considered to widen contextual understanding of the data provided on Group 2 - Sexual crimes. Detail is provided on limited comparisons with recorded crime in England & Wales and Northern Ireland. Further detail on the type of information available from the SCJS on sexual crime is also included.
Comparisons with England & Wales and Northern Ireland
While recorded crime in Scotland is not directly comparable with England & Wales or Northern Ireland due to differences in legislation and counting rules, there are some tentative signs that the previous long-term upward trend for sexual crimes across the UK may be slowing down. Over the past two years, sexual crimes recorded by police in England & Wales[4] have decreased and this year in Northern Ireland[5] sexual crime decreased for the first time since 2011/12. This compares to a 2% decrease in Scotland, although the pandemic may have had an impact on this year’s figures.
Scottish Crime and Justice Survey (SCJS)
Detailed information on the victims of sexual crime is not collected in the main SCJS survey. Information on sensitive topics is collected through a number of additional self-completion sections. Some of these sections include information on sexual crime; for example, the self-completion elements of the 2018-19 and 2019-20 surveys included questions on sexual victimisation, stalking and harassment, and partner abuse. The findings are included in the 2019-20 SCJS Main Findings report.
Group 3 – Crimes of Dishonesty
Number of Crimes of dishonesty recorded in 2020-21
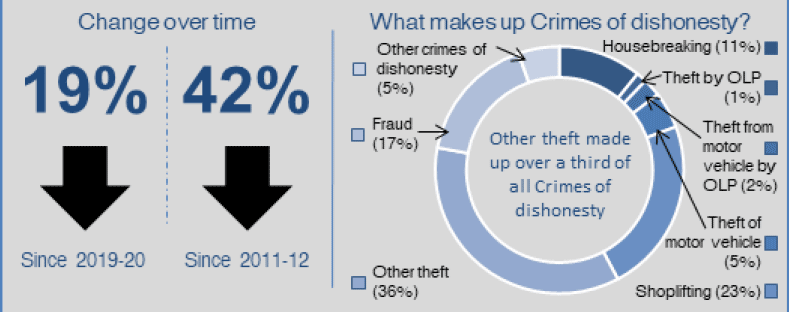
Crimes of dishonesty accounted for over a third (36%) of all crime recorded in Scotland in 2020-21. Between 2019-20 and 2020-21, the number of Crimes of dishonesty recorded by the police in Scotland decreased by 19%, from 111,409 to 89,731.
Chart 10 below shows the number of Crimes of dishonesty from 1971 onwards. Crimes of dishonesty increased for a long period between 1971 and 1991. Since then there has been a long-term decreasing trend, with a decrease of 79% between 1991 and 2020-21. These crimes are at their lowest level since 1971, the first year for which comparable crime groups are available.
1 Crimes recorded for the present crime groups are not available prior to 1971.
The national rate of recorded Crimes of dishonesty fell from 204 to 164 per 10,000 population in 2020-21 (see Tables 4 and 7).
Chart 11 shows the four largest categories within Crimes of dishonesty over the last ten years, and gives an indication of the trend and scale of each category. Other theft has consistently been the biggest contributor to Crimes of dishonesty, although this is experiencing a downward trend. Other theft and Housebreaking fell by 52% and 60% respectively between 2011-12 and 2020-21. Shoplifting also fell, by 31%, although this is likely to have been heavily influenced by the pandemic related restrictions. Fraud is the only category to have experienced an increase over the past ten years (up 69% since 2011-12). While not displayed in Chart 11, the numbers of Theft by opening a lockfast place (OLP), Theft from a motor vehicle by OLP and Theft of a motor vehicle have decreased over the ten years from 2011-12 to 2020-21 (Table 1).
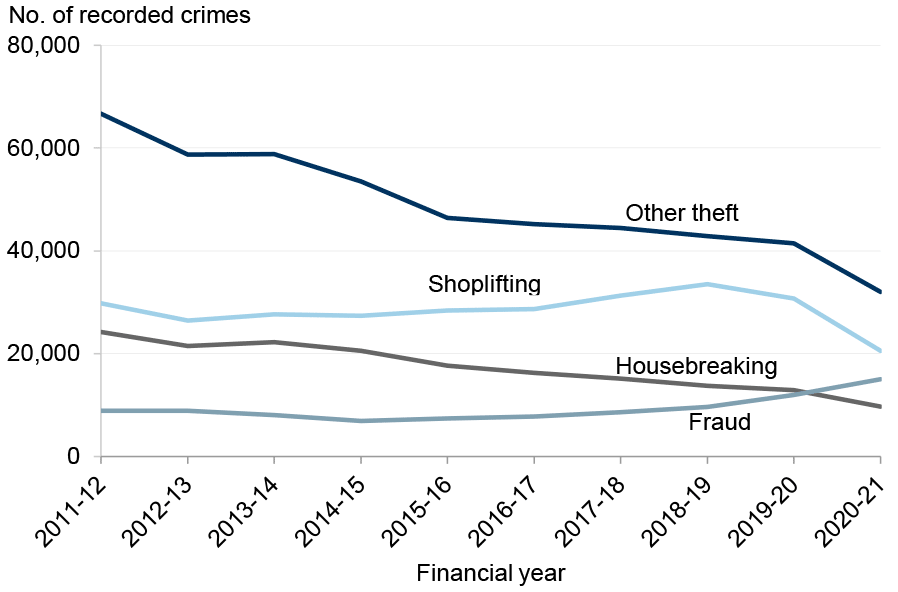
Other theft
Other theft consists of Theft of pedal cycles, Theft from a motor vehicle not elsewhere classified and Theft not elsewhere classified (excl. motor vehicles).
This category is the largest in Crimes of dishonesty, accounting for 36% of these crimes. Over the ten year period from 2011-12 to 2020-21, Other theft has seen a decrease of 52%, including a 23% decrease from 41,421 in 2019-20 to 32,017 in 2020-21.
Shoplifting
Shoplifting accounted for 23% of Crimes of dishonesty. Shoplifting decreased by 33% from 30,688 in 2019-20 to 20,557 in 2020-21. This follows an increasing trend since 2014-15 and is likely to be mainly due to the pandemic related restrictions. The number of Shopliftings recorded in 2020-21 was 31% lower than in 2011-12.
Housebreaking
Housebreaking accounted for 11% of Crimes of dishonesty. Over the ten year period from 2011-12 to 2020-21 this crime group has decreased by 60%, including a 25% decrease from 12,903 in 2019-20 to 9,706 in 2020-21.
Fraud
Crimes of Fraud account for 17% of Crimes of dishonesty. After a relatively stable period between 2010-11 and 2013-14 and a decrease in 2014-15, crimes of fraud experienced an upward trend since 2014-15. Crimes of fraud increased by 69% since 2011-12, including a 26% increase between 2019-20 and 2020-21.
This latest increase was due to a rise in the number of Frauds that were cyber-crimes, estimated to be over half (57%) of all recorded Fraud in 2020-21. Further information on this change is available in the Cyber-crime Chapter.
Theft from a motor vehicle by opening a lockfast place (OLP)
Theft from a motor vehicle by OLP accounted for 2% of Crimes of dishonesty. Over the ten year period from 2011-12 to 2020-21 this crime has seen a large decrease of 77%, including a 29% decrease from 2,982 in 2019-20 to 2,108 in 2020-21.
Theft of a motor vehicle
Theft of a motor vehicle accounted for 5% of Crimes of dishonesty. Over the ten year period from 2011-12 to 2020-21 this crime has seen a decrease of 39%, including a decrease of 14% or 691 crimes from 5,002 crimes in 2019-20 to 4,311 crimes in 2020-21.
Other crimes of dishonesty
Other crimes of dishonesty includes Reset, Corruption, Embezzlement and other crimes of forgery which are not classified elsewhere.
Other crimes of dishonesty account for 5% of total Crimes of dishonesty. Over the ten year period from 2011-12 to 2020-21 this crime has seen a decrease of 8%, however there was a 1% increase from 4,746 in 2019-20 to 4,794 in 2020-21.
Theft by opening a lockfast place (OLP)
Theft by opening a lockfast place (OLP) accounted for 1% of Crimes of dishonesty in 2020-21. Over the ten year period from 2011-12 to 2020-21, this crime has seen a decrease of 66%, and there has been a large decrease of 30% from 1,728 in 2019-20 to 1,207 in 2020-21.
Group 4 – Fire-raising, Vandalism etc.
Number of crimes of Fire-raising, vandalism etc. recorded in 2020-21:
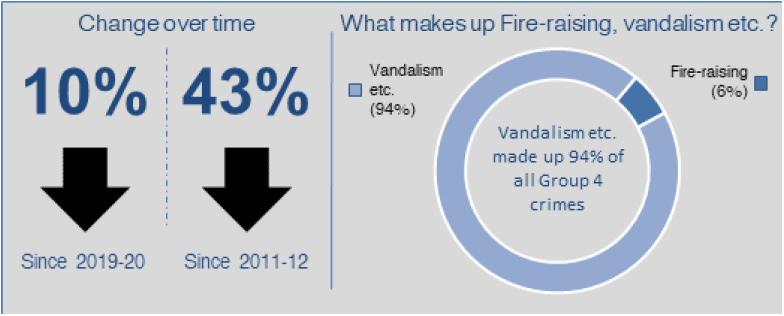
Fire-raising, vandalism etc. accounted for 17% of all crime recorded in Scotland in 2020-21. Between 2019-20 and 2020-21, the number of crimes of Fire-raising, vandalism etc. recorded by the police in Scotland decreased by 10%, from 47,731 to 42,964. The recording of these crimes is at the lowest level seen since 1975.
Chart 12 shows the number of crimes of Fire-raising, vandalism etc. from 1971 onwards. Levels of Fire-raising, vandalism etc. increased for a long period, but there was a sharp downward trend since they peaked in 2006-07, including a 43% fall since 2011-12.
The national rate of recorded crimes of Fire-raising, vandalism etc. fell from 87 to 79 crimes per 10,000 population in 2020-21.
Due to the difference in scale of recorded crimes of Vandalism etc. and Fire-raising, Charts 13 and 14 show these two categories separately to better highlight the similar downward trends they have followed over the last ten years.
1 Crimes recorded for the present crime groups are not available prior to 1971.
Vandalism etc.
Vandalism etc. accounted for 94% of crimes of Fire-raising, vandalism etc. These crimes have decreased by 10% from 45,074 in 2019-20 to 40,384 in 2020-21. The longer term trend has also been downwards, with the number of crimes recorded decreasing by 43% between 2011-12 and 2020-21.
The Vandalism etc. category includes crimes recorded under the Computer Misuse Act 1990. There were 72 such crimes recorded in 2020-21, up from 21 in 2019-20. Further information on this change is available in the Cyber-crime Chapter.
Fire-raising
Fire-raising accounted for 6% of crimes of Fire-raising, vandalism etc. These crimes have decreased by 3% from 2,657 in 2019-20 to 2,580 in 2020-21. Fire-raising has decreased by nearly a third (31%) over the ten year period from 2011-12 to 2020-21.
Data comparisons: Fire-raising
Another source of statistics on fires in Scotland is an annual publication covering the number of fires attended by the Scottish Fire and Rescue Service (SFRS). The latest figures (for 2019-20) are available at: http://www.firescotland.gov.uk/about-us/fire-and-rescue-statistics.aspx.
It is not possible to make direct comparisons between the two sources, as many fires are caused accidentally rather than as a result of a crime, and the police are not called to all deliberate fires. Furthermore, not all police recorded crimes of fire-raising may result in the attendance of the SFRS. However as these sources both relate to how Scotland’s emergency services respond to fires, it would be anticipated that both should show similar trends over time.
A total of 24,472 fires were attended by the SFRS in 2019-20, down 9% on the previous year. Over half (58%) were started deliberately.
Between 2010-11 and 2019-20, there has been a 37% fall in the total number of fires attended and a 45% decrease in the number of deliberate fires. This comparison suggests that the overall reduction in police recorded crimes of fire-raising over the past 10 years has also been broadly reflected in statistics for the SFRS.
Group 5 – Other crimes
Number of Other crimes recorded in 2020-21
Other crimes account for 29% of all crimes recorded in Scotland in 2020-21. Between 2019-20 and 2020-21, the number of Other crimes recorded by the police increased by 10%, from 64,589 to 70,737.
Chart 15 below shows the number of Other crimes from 1971 onwards. After increasing for a long period up to 2006-07, they decreased until 2016-17, before rising again. It should be noted that over a third (36%) of the overall increase in Other crimes from 54,946 in 2016-17 to 70,737 in 2020-21 is due to a procedural change in the recording of crimes of handling an offensive weapon (see later in this section for further information).
1 Crimes recorded for the present crime groups are not available prior to 1971.
The national rate of recorded Other crimes increased from 118 to 129 crimes per 10,000 population in 2020-21 (see Tables 4 and 7).
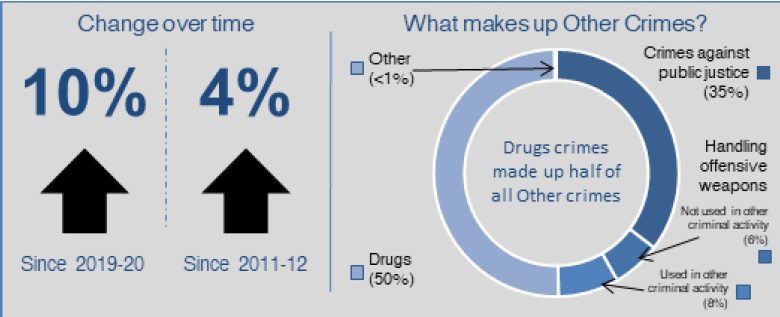
Chart 16 shows the four categories within Other crimes over the last ten years, and gives an indication of the trend and scale of each category. Drugs crimes have consistently been the biggest contributor, accounting for 50% in 2020-21. A further 35% were Crimes against public justice and 14% were crimes of Handling offensive weapons.
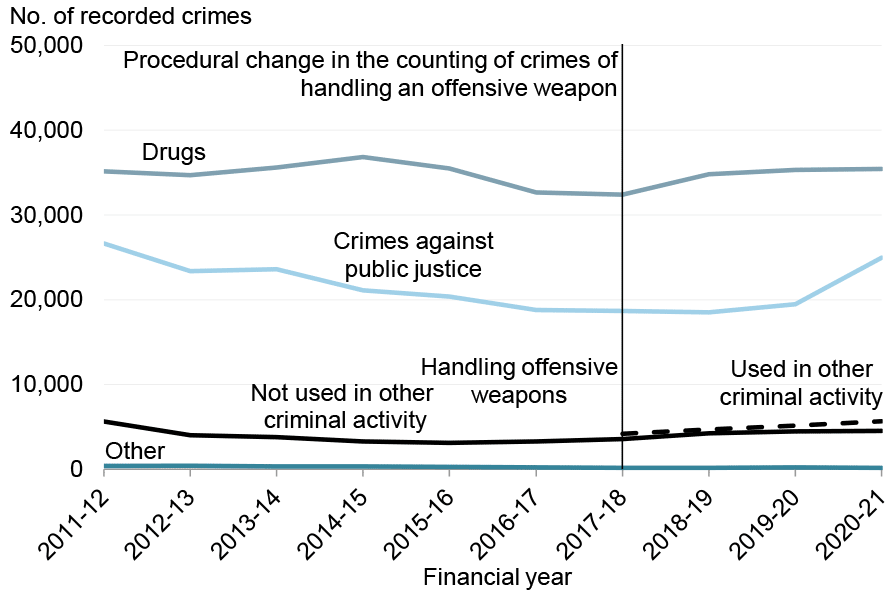
* There was a procedural change to the counting of crimes of Handling an offensive weapon in 2017-18. As such the significant rise in the total number of recorded crimes of Handling an offensive weapon shown for that year, does not represent a real increase in these crimes.
Drugs
Drug crimes account for 50% of Other crimes. Over the ten year period from 2011-12 to 2020-21 this crime has increased by 1%, including a small increase from 35,303 crimes in 2019-20 to 35,410 in 2020-21.
Most of these crimes (86%) are for drug possession, where the quantity of drugs seized is small enough to be considered for personal use (as opposed to crimes of drug supply).
Crimes against public justice
Crimes against public justice account for 35% of Other crimes and include Bail offences, Resisting arrest and General attempts to pervert the course of justice. Over the ten year period from 2011-12 to 2020-21 this crime has decreased by 6%, although there was an increase of 29% from 19,441 in 2019-20 to 24,985 in 2020-21. This increase is likely to be due to circumstances caused by the coronavirus (COVID-19) pandemic and the resulting actions to limit social contact. This led to greater numbers of individuals on bail for longer periods of time than in previous years (due to trial delays and backlogs in the court system).
Handling offensive weapons
In 2017-18 the Scottish Crime Recording Board made a procedural change to how some crimes of handling an offensive weapon were recorded. This has had an impact on the comparability of the recorded crime statistics before and after this point.
Prior to 2017-18, statistics on handling offensive weapons in public places only include incidents where the perpetrator did not commit further crimes with the weapon. If they had, the specific crime of handling an offensive weapon was considered an aggravation of the crime it was used to commit (for example an aggravated assault) and would not have been included in the statistics.
From the 1st April 2017, crimes of handling offensive weapons in public places are no longer treated as an aggravation where they are used to commit other crimes or offences against a person. As such both the crime of handling an offensive weapon in a public place and any crime or offence committed with it are now both included in the statistics. This change was made to improve consistency between the recording of these crimes and the criminal law.
As a result of this amendment to recording practice, crimes of handling an offensive weapon have been substantially higher since 2017-18. This does not represent a real increase in recorded crime, and this change will continue to have an impact on the comparability of recorded crime statistics for all years prior to 2017-18.
Not used in other crimes or offences
From 2017-18 onwards, crimes of Handling an offensive weapon in Scotland can be counted in two different ways. The first is to use the pre-existing statistics, where the offensive weapon hasn’t been used to commit another crime or offence against a person in a public place. These crimes account for 6% of Other crimes in 2020-21.
Over the ten year period from 2011-12 to 2020-21 this category decreased by 20%. However, there was a 1% increase from 4,484 in 2019-20 to 4,524 in 2020-21, the fifth year-on-year increase following a prolonged decrease in these crimes.
In 2020-21, 123 crimes of handling an offensive weapon (not used) occurred within a prison and a further 74 occurred within a school. This compares to 89 occurring in a prison and 146 occurring in a school in 2019-20.
Used in other crimes or offences
In addition to the above measure, figures are also available for where the offensive weapon was used to commit another crime or offence against a person in a public place. These crimes account for 8% of Other crimes in 2020-21. There was a 10% increase from 5,160 in 2019-20 to 5,660 in 2020-21.
In 2020-21, 81 crimes of handling an offensive weapon (used) occurred within a prison and a further 36 occurred within a school. This compares to 62 occurring in a prison and 61 occurring in a school in 2019-20.
In June 2018 a report was published that presented more detailed information on the handling of offensive weapons within public places in Scotland. This included findings on the characteristics of these cases, based on a random sample of 1,500 crimes recorded by the police for the first six months (April to September) of 2013 and 2017.
More information can be found by accessing the ‘Recorded Crime in Scotland: Handling Offensive Weapons’ publication:
https://www.gov.scot/publications/recorded-crime-scotland-handling-offensive-weapons/
Other
The Other category within Other crimes includes Treason; Conspiracy; Explosive offences; Wrecking, piracy and hijacking; and Crimes against public order.
This category accounted for less than 1% of Other crimes in 2020-21. Over the past 10 years this type of crime decreased by 59%, including a 21% decrease from 201 in 2019-20 to 158 in 2020-21.
Coronavirus restrictions crimes
The enactment of legislation such as the Coronavirus Act 2020 and Health Protection (Coronavirus) (Restrictions) (Scotland) Regulations 2020 (implemented on 25th March and 27th March 2020 respectively) has led to new and additional crimes being recorded within these statistics. For example, where someone, who had left the place they were living during lockdown, did not have a reasonable excuse for this when asked by a police officer, and failed to comply with police advice or instruction to return there. Further legislation in respect of local travel restrictions came in to force on 2 November 2020.
Given the rapid pace of these changes, Police Scotland have used a bespoke data collection to capture information on the number of new crimes recorded under Coronavirus related legislation.
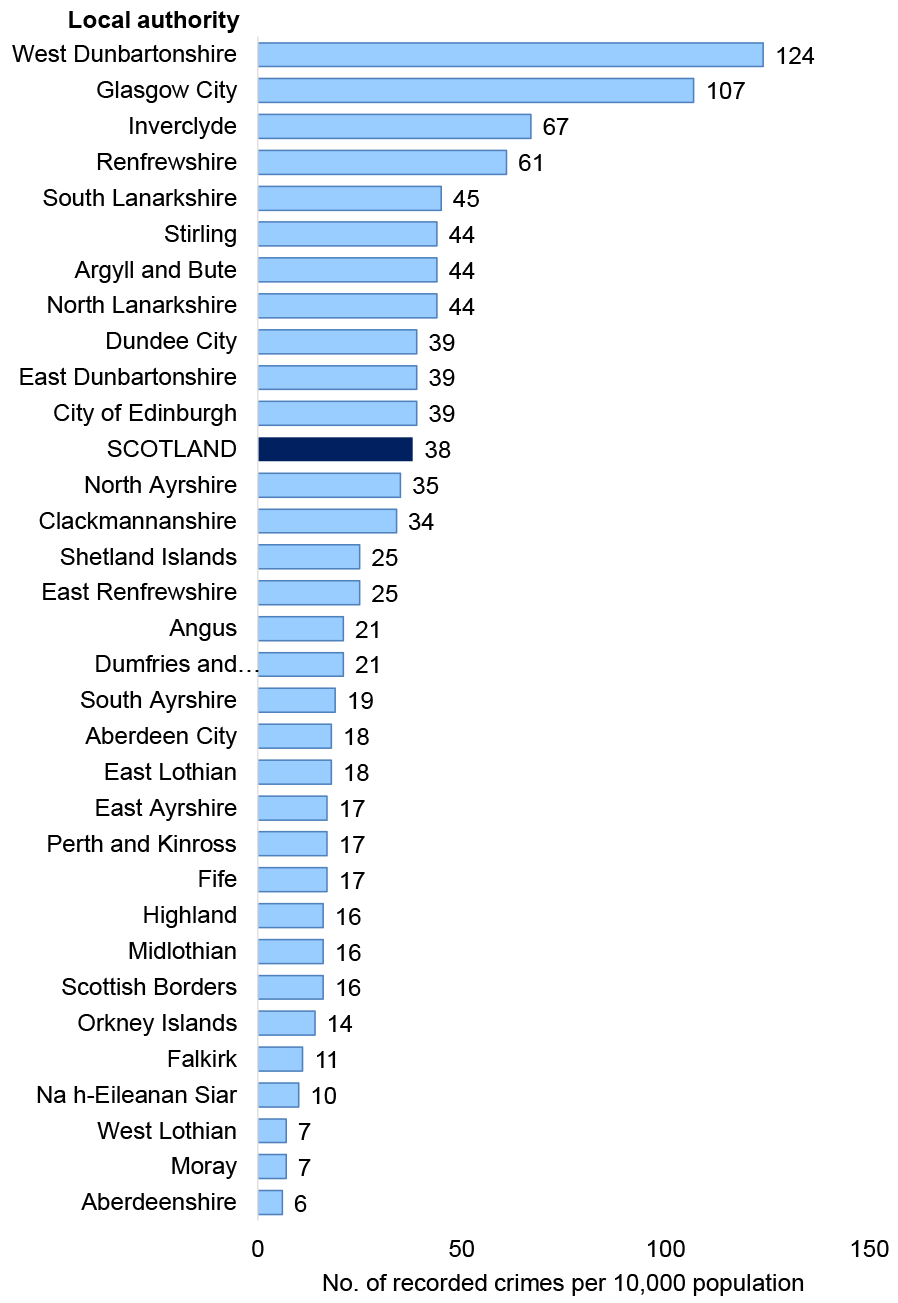
Whilst many incidents will have been dealt with by police without the need for enforcement, 20,976 Coronavirus restrictions crimes were recorded in 2020-21, accounting for 9% of all crime recorded in Scotland this year. This compares to 107 equivalent crimes recorded towards the end of 2019-20.
The national rate of recorded Coronavirus restriction crimes was 38 per 10,000 population in 2020-21. However this varied from 124 per 10,000 population in West Dunbartonshire and 107 per 10,000 population in Glasgow City to 6 per 10,000 population in Aberdeenshire and 7 per 10,000 population in Moray and West Lothian (Chart 17). It should be noted that crimes are recorded in terms of where they occur and not the home residency of the perpetrator (where the two places are different locations).
Total Recorded Offences
Total number of offences recorded in 2020-21:
Due to anomalies in the data for Motor vehicle offences, statistics for total recorded offences by the police are only comparable from 2013-14 onwards. Further detail on these anomalies can be found later in this section and in Annex 2.
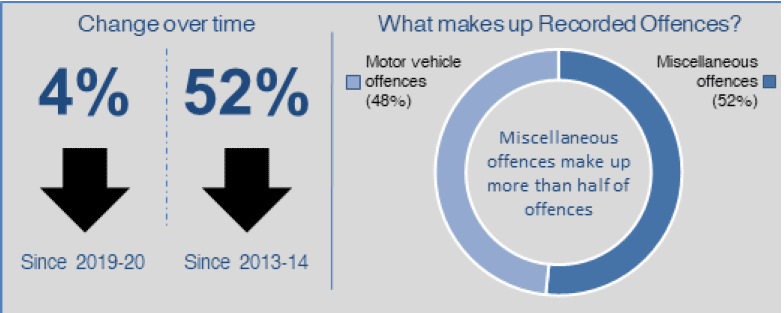
The total number of offences recorded has fallen by around a half since 2013-14, including a 4% decrease from 250,662 in 2019-20 to 240,174 in 2020-21 (Table 2).
Miscellaneous offences and Motor vehicle offences account for fairly equal proportions of total offences, compared to 2013-14 when Motor vehicle offences accounted for almost 60% of the total.
It should be noted that the number of offences recorded by the police generally tends to be affected to a greater extent by police activity and operational decisions than the number of crimes.
Due to a number of offence codes being non-comparable over time, Motor vehicle offences and hence the overall figures on Offences (based on Miscellaneous offences and Motor vehicle offences combined) are only comparable from 2013-14 onwards.
The Scottish Government produced a Technical Report in 2014 which detailed the quality assurance work it carried out in reaching this conclusion.
Group 6 – Miscellaneous Offences
Number of Miscellaneous offences recorded in 2020-21:
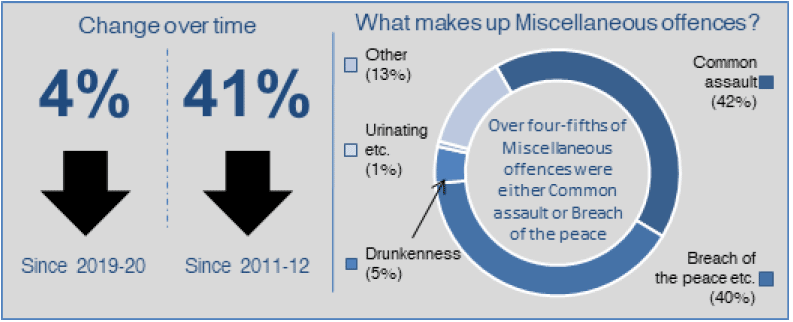
Miscellaneous offences account for around half (52%) of all offences recorded in Scotland in 2020-21. Between 2019-20 and 2020-21, the number of Miscellaneous offences recorded by the police in Scotland decreased by 4%, from 128,755 to 124,120.
Due to a number of anomalies in the data for Miscellaneous offences, this group is only comparable from 2008-09 onwards. Further information on the comparability of Group 6 is available in Annex 2.
The national rate of recorded Miscellaneous offences decreased from 236 offences per 10,000 population in 2019-20 to 227 offences per 10,000 population in 2020-21 (see Table 4).
Chart 18 shows the five categories within Miscellaneous offences over the last ten years. This chart gives an indication of the trend and scale of each category. Common assault and Breach of the peace etc. have consistently been the biggest categories within Miscellaneous offences.
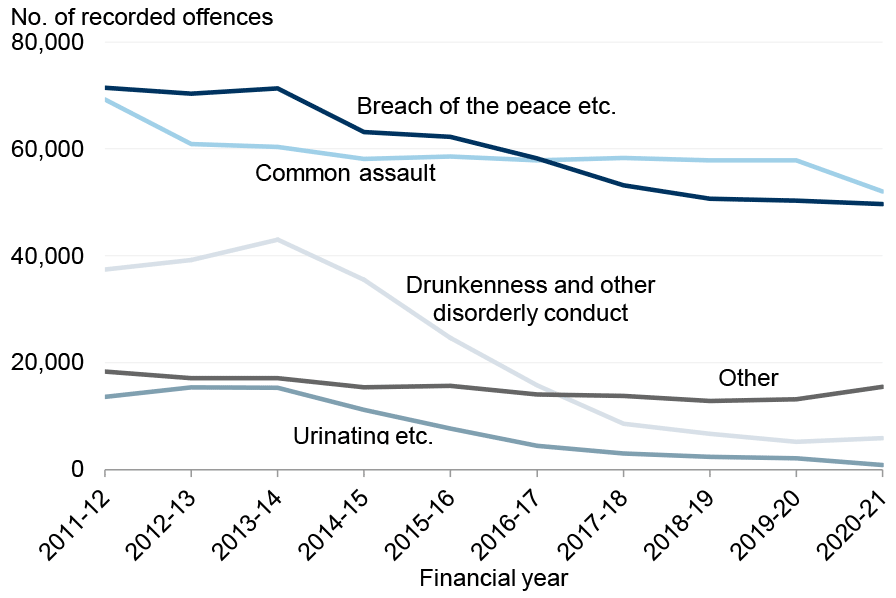
Common assault
Common assault is the largest category in Miscellaneous offences, accounting for 42% in 2020-21. Over the ten year period from 2011-12 to 2020-21, this category has fallen by a quarter (25%). There was a 10% decrease from 2019-20 to 2020-21 (from 57,833 to 52,052).
Of the 52,052 offences recorded in 2020-21, 8,118 (16%) related to common assault of emergency workers, an increase of 8% since 2019-20 and 14% since 2011-12 (see Table A8).
Breach of the peace etc.
Breach of the peace etc. includes Breach of the peace, Threatening or abusive behaviour and Stalking. A further breakdown of Breach of the peace etc. into its component parts is available in Table A6.
Breach of the peace etc. is the second largest category in Miscellaneous offences, accounting for two-fifths (40%) in 2020-21. Over the ten year period from 2011-12 to 2020-21, this category has fallen by almost a third (30%), including a 1% decrease from 50,327 in 2019-20 to 49,696 in 2020-21.
It should be noted that some offences which had previously been recorded under Breach of the peace etc. (primarily Threatening or abusive behaviour and Stalking) are no longer recorded when occurring as part of a course of conduct for which a crime has been recorded under the Domestic Abuse (Scotland) Act 2018 legislation. This means there is a discontinuity in the time series for Breach of the peace etc. offences and is likely to be part of the reason why there was a fall in Stalking offences from 1,304 in 2018-19 to 871 in 2019-20. In 2020-21, 889 Stalking offences were recorded.
Drunkenness and other disorderly conduct
Drunkenness and other disorderly conduct includes offences such as Drunk and incapable, Disorderly on licensed premises and Consumption of alcohol in designated places, byelaws prohibited. For further information on the classification of crimes and offences, please see the User Guide.
Drunkenness and other disorderly conduct accounted for 5% of Miscellaneous offences in 2020-21. Despite some fluctuation, there has been an 84% fall between 2011-12 and 2020-21. However, there was a 14% increase from 5,234 in 2019-20 to 5,961 in 2020-21.
Urinating etc.
Urinating etc. accounted for 1% of Miscellaneous offences in 2020-21. There has been a 93% decrease in these offences since 2011-12, including a 58% fall from 2,153 in 2019-20 to 894 in 2020-21 ( this may have been affected by the closure of licensed premises at various times during the coronavirus (COVID-19) pandemic).
Other miscellaneous offences
The Other miscellaneous offences category includes a wide range of offences, including Racially aggravated harassment, Racially aggravated conduct (see section below), False/hoax calls, Offences involving children and Offences involving animals/plants. For further information on the classification of crimes and offences, please see the User Guide.
Other miscellaneous offences account for 13% of Miscellaneous offences in 2020-21. These offences increased by 17% from 13,208 in 2019-20 to 15,517 in 2020-21.
It should be noted that the Other miscellaneous offences category is not considered comparable for years prior to 2008-09. Further information on quality issues is available in the ‘Data Considerations’ section below, and in Annex 2.
Racially aggravated harassment and conduct
Table A7 shows these offences for the last ten years. In 2020-21 there were 76 offences of Racially aggravated harassment and 1,706 offences of Racially aggravated conduct. While these include specific racially aggravated offences under section 50A of the Criminal Law (Consolidation) (Scotland) Act 1995, they do not account for all criminal behaviour which may have had a racial motivation. For example, Threatening or abusive behaviour or Common assault with a racial aggravation.
In February 2021, the Scottish Government published a study of the characteristics and circumstances of police recorded hate crime, based on a review of crime records: https://www.gov.scot/publications/study-characteristics-police-recorded-hate-crime-scotland/
Data considerations
Due to changes in police recording systems, comparisons for the Drunkenness and other disorderly conduct and Other miscellaneous offences categories in Group 6 should only be made for 2008-09 onwards. The comparability of the remaining three categories in Group 6 (Common assault; Breach of the peace etc. and Urinating etc.) are not affected.
HMICS Crime Audit 2020
It should be noted that in the HMICS audit report, violent crime includes common assault. Please refer to the Group 1 - Non-sexual crimes of violence section. Further information on this audit, including definitions of terminology and tests used, can be found in the User Guide.
Group 7 – Motor Vehicle Offences
Number of Motor vehicle offences recorded in 2020-21
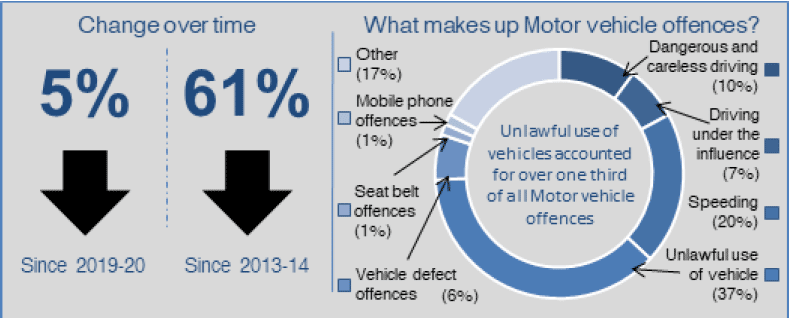
Motor vehicle offences account for 48% of all offences recorded in Scotland in 2020-21. Between 2019-20 and 2020-21, the number of Motor vehicle offences recorded by the police decreased by 5% from 121,907 to 116,054. There has been an overall decrease of 61% since 2013-14.
Due to a number of anomalies in the data as a result of inconsistencies with legacy data reporting, Motor vehicle offences recorded by the police are only comparable from 2013-14 onwards. Further information on the comparability issues can be found in Annex 2.
The national rate of recorded Motor vehicle offences decreased from 223 per 10,000 population in 2019-20 to 212 per 10,000 population in 2020-21 (see Table 4).
Unlawful use of vehicle
The Unlawful use of vehicle category includes offences such as Driving while disqualified, Driving without a licence, Driving without insurance, and Driving without a test certificate. Further detail can be found in the User Guide.
Unlawful use of vehicle is the largest category in this group, accounting for 37% of Motor vehicle offences. This category increased by 11% from 39,022 in 2019-20 to 43,309 in 2020-21.
Speeding
Speeding accounted for a fifth (20%) of Motor vehicle offences. This category decreased by 20% from 28,758 in 2019-20 to 22,963 in 2020-21. There has been an overall decrease of 72% since 2013-14.
These figures do not include any offences recorded as a result of the Scottish Safety Camera Programme. These are excluded as no police resources are used in the recording of an offence by this programme and the National Statistics on Recorded Crime focuses solely on crimes and offences faced by the police and not other organisations.
Dangerous and careless driving
Dangerous and careless driving accounted for 10% of Motor vehicle offences. This category increased by 5% from 11,246 in 2019-20 to 11,771 in 2020-21. Numbers have fluctuated since 2011-12, but the level is currently 19% higher than in 2011-12.
Driving under the influence
Driving under the influence accounted for 7% of Motor vehicle offences. This category increased by 23% from 6,594 in 2019-20 to 8,097 in 2020-21. Over the longer term, driving under the influence has increased by 9% since 2011-12.
Changes to the Road Traffic Act 1988 which introduced new offences of driving or being in charge of a motor vehicle with concentration of a specified controlled drug above a specified limit came into force on 21st October 2019. 616 of these new offences were recorded in 2019-20, and 2,491 offences were recorded in 2020-21, the first full year of the legislation being in force. While offences of driving or being in charge of a motor vehicle while impaired through alcohol or drugs already existed, evidence of impaired driving is not required for the new offences. This has resulted in additional offences being recorded in relation to drug driving and has therefore played a part in the increase in Driving under the influence offences.
Vehicle defect offences
Vehicle defect offences account for 6% of Motor vehicle offences. This category decreased by 7% from 7,346 in 2019-20 to 6,839 in 2020-21. There has been an overall decrease of 67% since 2013-14.
Seat belt offences
Seat belt offences account for 1% of Motor vehicle offences. This category decreased by 42% from 2,800 in 2019-20 to 1,632 in 2020-21. These offences had previously been on a generally upward trend between 2009-10 and 2013-14, before decreasing by 96% between 2013-14 and 2020-21.
Mobile phone offences
Mobile phone offences account for 1% of Motor vehicle offences. This category decreased by 34% from 2,450 in 2019-20 to 1,629 in 2020-21. These offences increased from 2011-12 to a peak in 2013-14, but have decreased each year since. There has been an overall decrease of 94% since 2011-12 and 95% since 2013-14.
Other motor vehicle offences
The Other motor vehicle offences category includes offences such as Accident offences and Parking offences. Further detail can be found in the User Guide.
Other motor vehicle offences account for 17% of Motor vehicle offences. This category decreased by 16% from 23,691 in 2019-20 to 19,814 in 2020-21. There has been an overall decrease of 53% since 2013-14.
It should be noted that the Other motor vehicle offences category is not considered comparable for years prior to 2013-14. Further information on quality issues is available in Annex 2.
Contact
Email: Justice_Analysts@gov.scot
There is a problem
Thanks for your feedback