Public sector employment in Scotland: statistics for second quarter 2020
Statistics based on administrative records and surveys of individual public sector bodies carried out by the Scottish Government and the Office for National Statistics (ONS). This is a snapshot of employment as at June 2020.
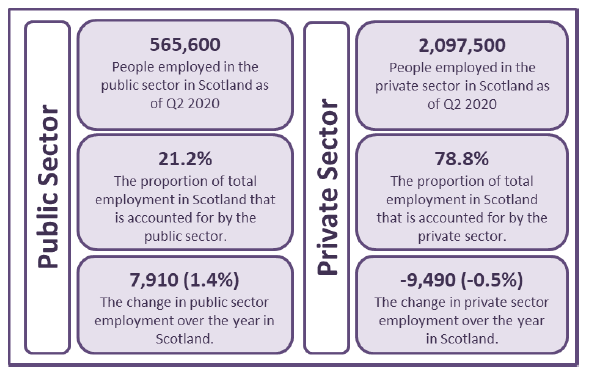
1. Total Employment and Public and Private Sector Employment in Scotland; Headcount
(see Table 1)
Public sector employment increased by 7,910 (1.4%) between June 2019 and June 2020, while private sector employment decreased by 0.5%. This increase in public sector employment is mainly due to an increase in the devolved public sector.
The public sector is defined according to the UK National Accounts Classifications Guide.
Figure 1 provides a summary of total employment in Scotland by public and private sector.
Source: Public Sector Employment in Scotland, Quarter 2 2020
Source: Public Sector Employment in Scotland, Quarter 2 2020
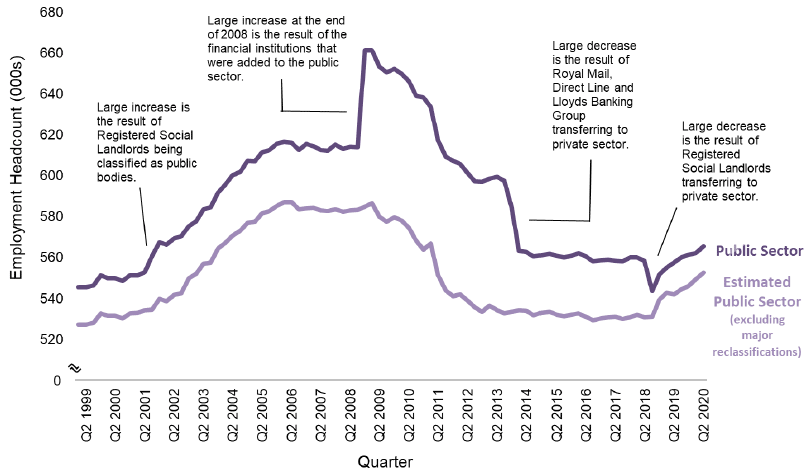
Chart 1 shows that the number of people employed in the public sector remained relatively constant between Q1 2014 and Q2 2018, before falling in Q3 2018 and rising again from Q4 2018 onwards. Excluding the effects of major reclassifications[2] (i.e. taking out the headcounts for all large organisations listed in footnote 2 from the overall numbers), the number of people employed in the public sector gradually reached a peak in Q2 2006, decreased to Q3 2013 and remained relatively constant until Q3 2018. The increase between Q3 2018 and Q4 2018 is mainly due to Cordia services moving back under Glasgow City Council services.
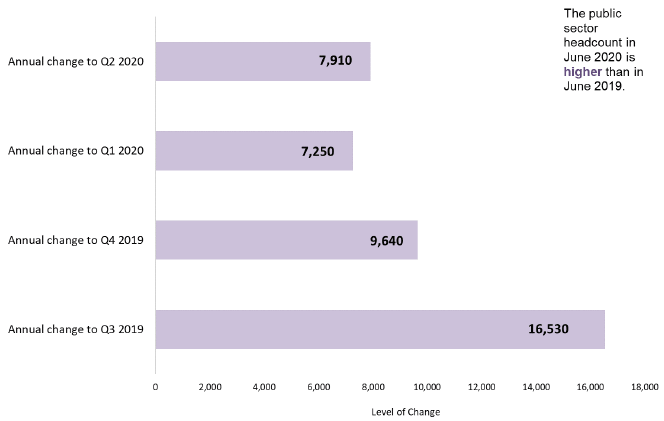
Chart 2 shows the annual change in employment for the public sector. Employment rose by 7,910 between Q2 2019 and Q2 2020. The devolved public sector headcount has risen due to increases in local government, NHS and devolved civil service (e.g. inclusion of Social Security Scotland from Q3 2018 and Forestry and Land Scotland and Scottish Forestry from Q2 2019 in Scottish Government Agencies and increases in Scottish Government Core Directorates (see section 5 for more detail)).
The annual change in Chart 2 in Q3 2019 shows the effects of Cordia services moving back under Glasgow City Council Services in Q4 2018.
Source: Public Sector Employment in Scotland, Quarter 2 2020
Impact of Excluding Major Reclassifications from Public Sector
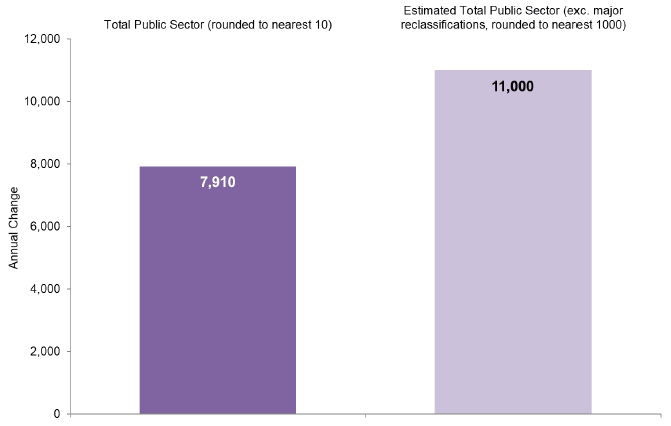
If the major reclassifications[2] were to be excluded from the public sector series (i.e. the headcounts for all large organisations listed in footnote 2 were taken out of the overall numbers), there would be around 553,000 people employed in the public sector in June 2020. This was 20.8% of the total employment in Scotland compared with 21.2% if major reclassifications are included.
Public sector employment, excluding the effects of the major reclassifications, would be around 11,000 (2.0%) higher in June 2020 compared with June 2019.
Chart 3 below shows that the overall public sector in Scotland increased by 7,910 (1.4%) between June 2019 and June 2020. Chart 3 also shows the estimated impact of removing major reclassifications from the series.
Source: Public Sector Employment in Scotland, Quarter 2 2020
Note: Totals may not equal the sum of individual parts due to rounding
Contact
Email: lmstats@gov.scot