Water Industry - Scottish Government Investment Group - Committed List performance progress report: quarter two 2023-2024
Sets out how Scottish Water is progressing with the delivery of projects and programmes included on the ‘Committed List’ and confirms the position up to the end of September 2023 (Q2 2023/24).
Part of
3. Indicator of Progress of Overall Delivery
The Indicator of Progress of Overall Delivery (IPOD) provides a high-level measurement of Scottish Water’s progress in delivering the Committed List for projects over £1.0m[2]. It assesses the progress of these investment projects monitored across 3 delivery gates combining this information to give an overall score.
When projects are added to the Committed List, each milestone is allocated 1 point. Each quarter, the number of points achieved by reaching gates is assessed against the baseline[3] level for the previous quarter (lower limit) and the subsequent quarter (upper limit). These points are shown as absolute scores. Scottish Water is considered to be within the target range where the number of points gained lies within the lower and upper limits.
At the end of September 2023 (Q2 2023/24), Scottish Water's IPOD position was on track at 721 points, against a target range of 690 to 810 points. (Figure 1).
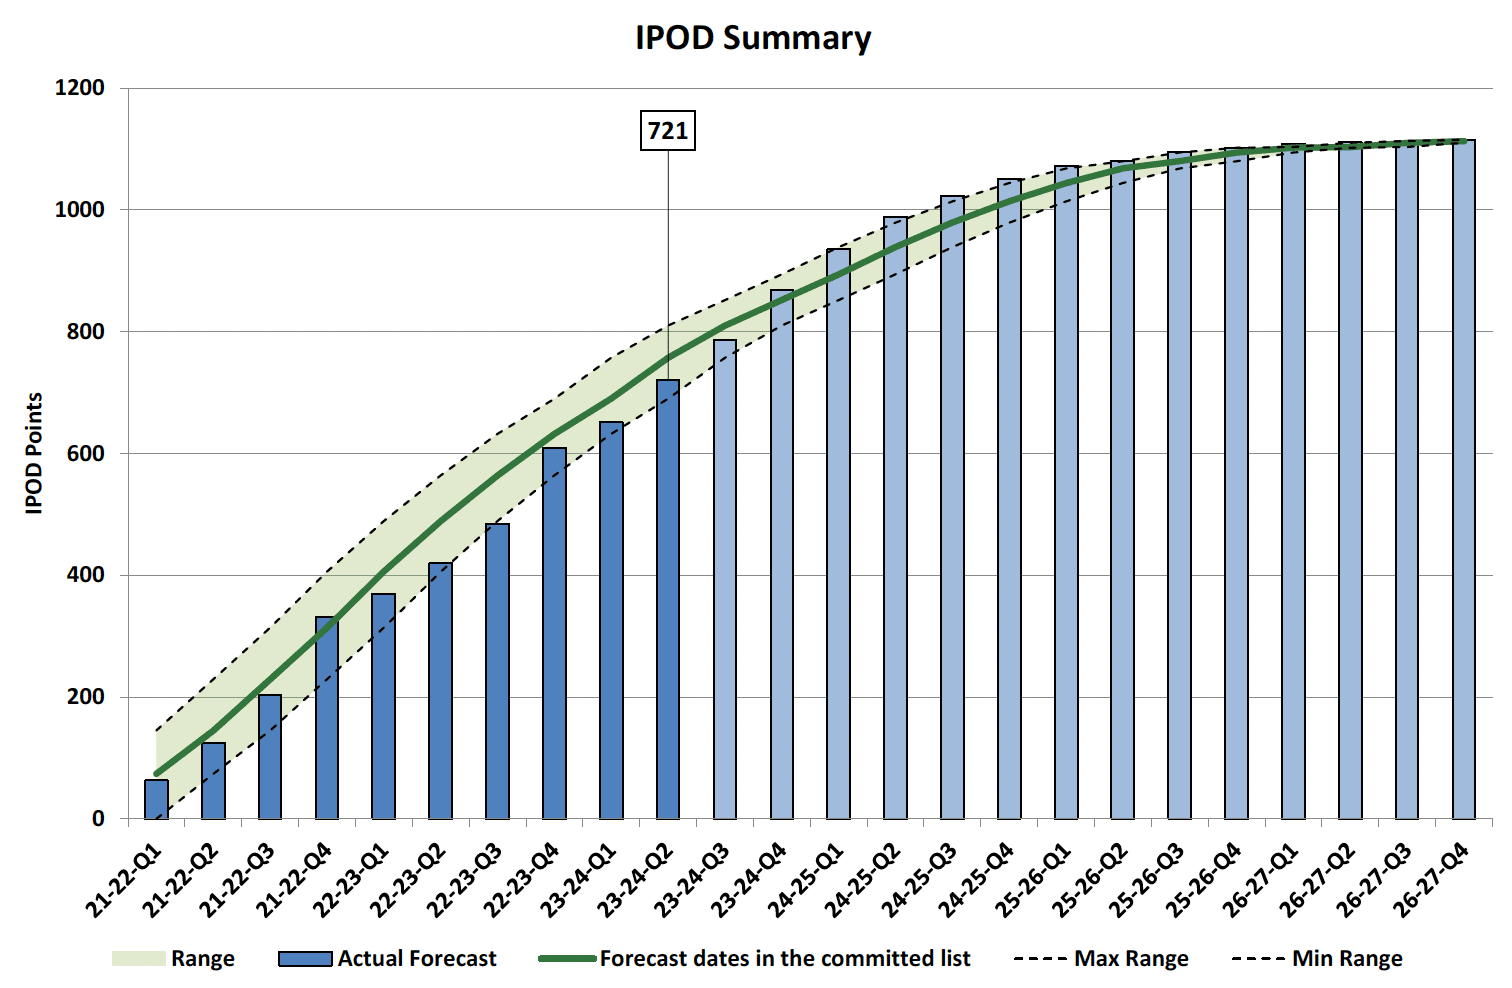
The green line in the figure above shows the aggregate of the forecast dates in the Committed List (the baseline). The solid blue bars show Scottish Water’s actual position, and the light blue bars show the forecast position for future months. The green area above shows the + or – 3 months target range (i.e., the baseline from the previous and subsequent quarters respectively). Being above this shows that Scottish Water is more than 3 months ahead of the baseline and being below this shows that Scottish Water is more than 3 months behind the baseline.
Figures 2, 3 and 4 below show the IPOD position at Q2 2023/2024 by individual milestone.
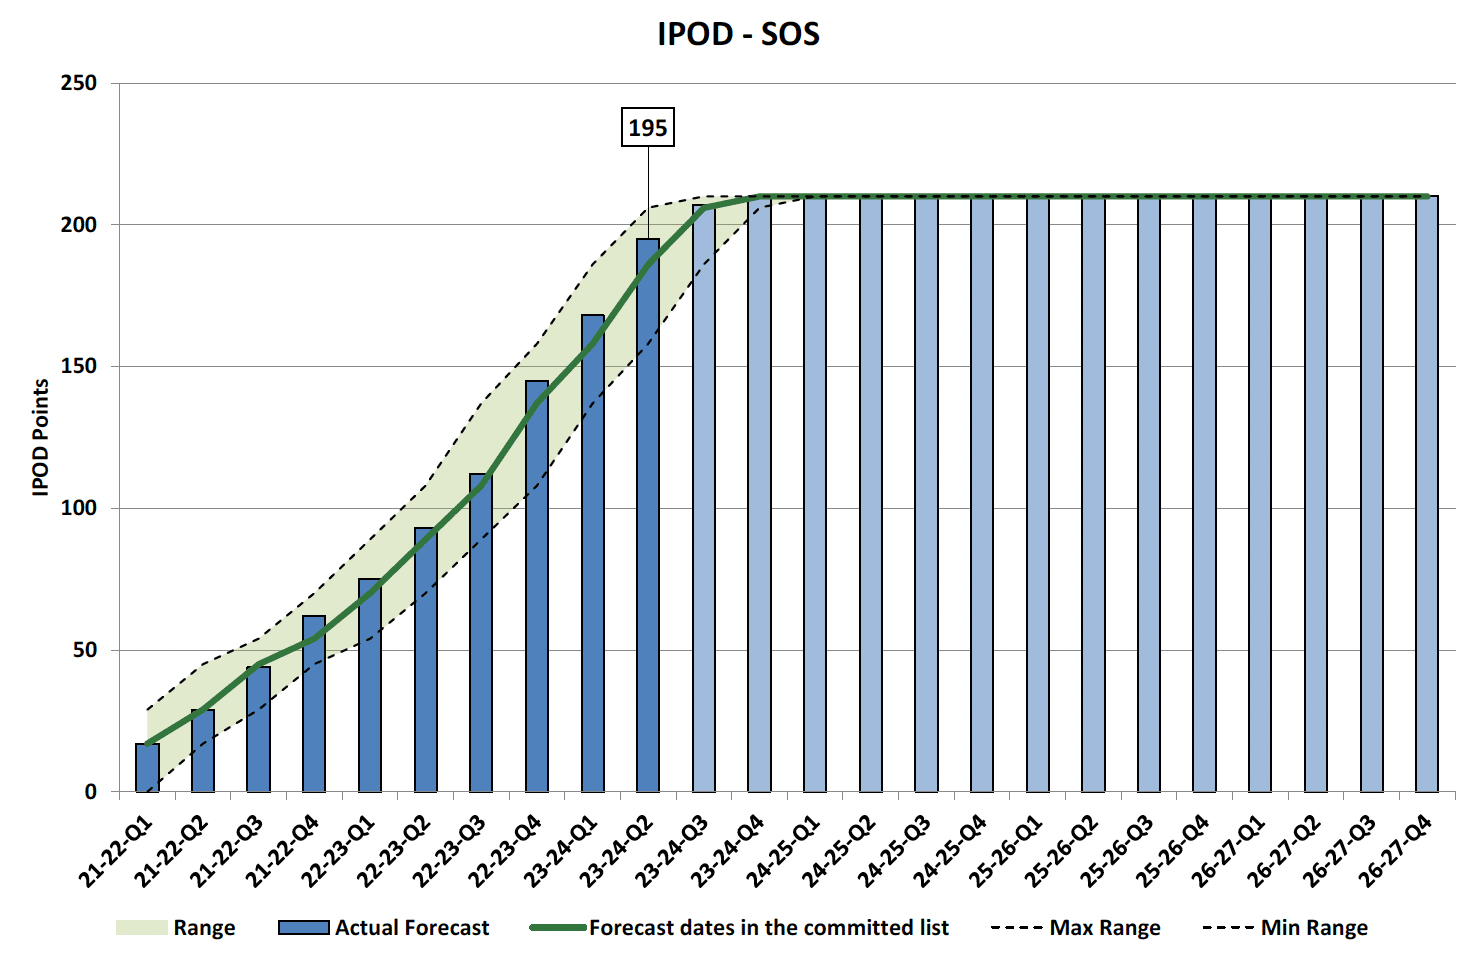
IPOD – Start On Site
27 projects started on site during Q2 bringing the total number of projects achieving the Start On Site (SOS) milestone to 195 with performance being in the top half of the range of 158 to 206. points.
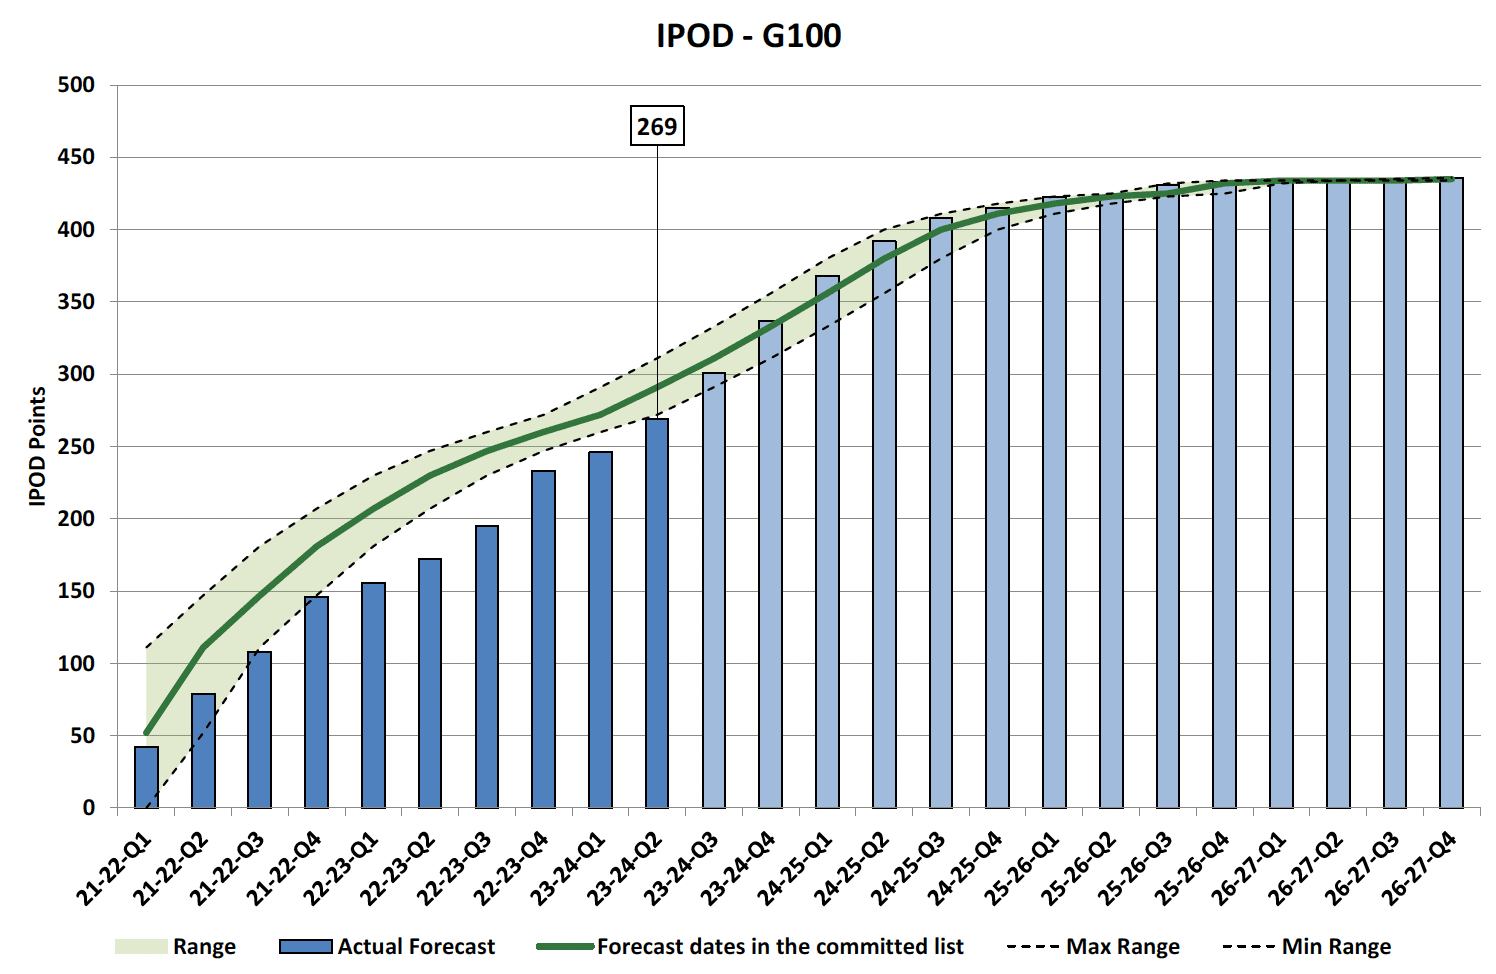
IPOD – Acceptance
23 projects achieved acceptance during Q2, bringing the total number of completed projects delivering benefit to customers to 269 which is out with the target range of 272 to 311 points. This position is forecast to gradually improve and be within target range at end of Q3 (301 points).
Explanation of this movement can be found in Sections 4 & 5. Full details of the projects on the water and wastewater portfolios are now shared regularly with DWQR and SEPA.
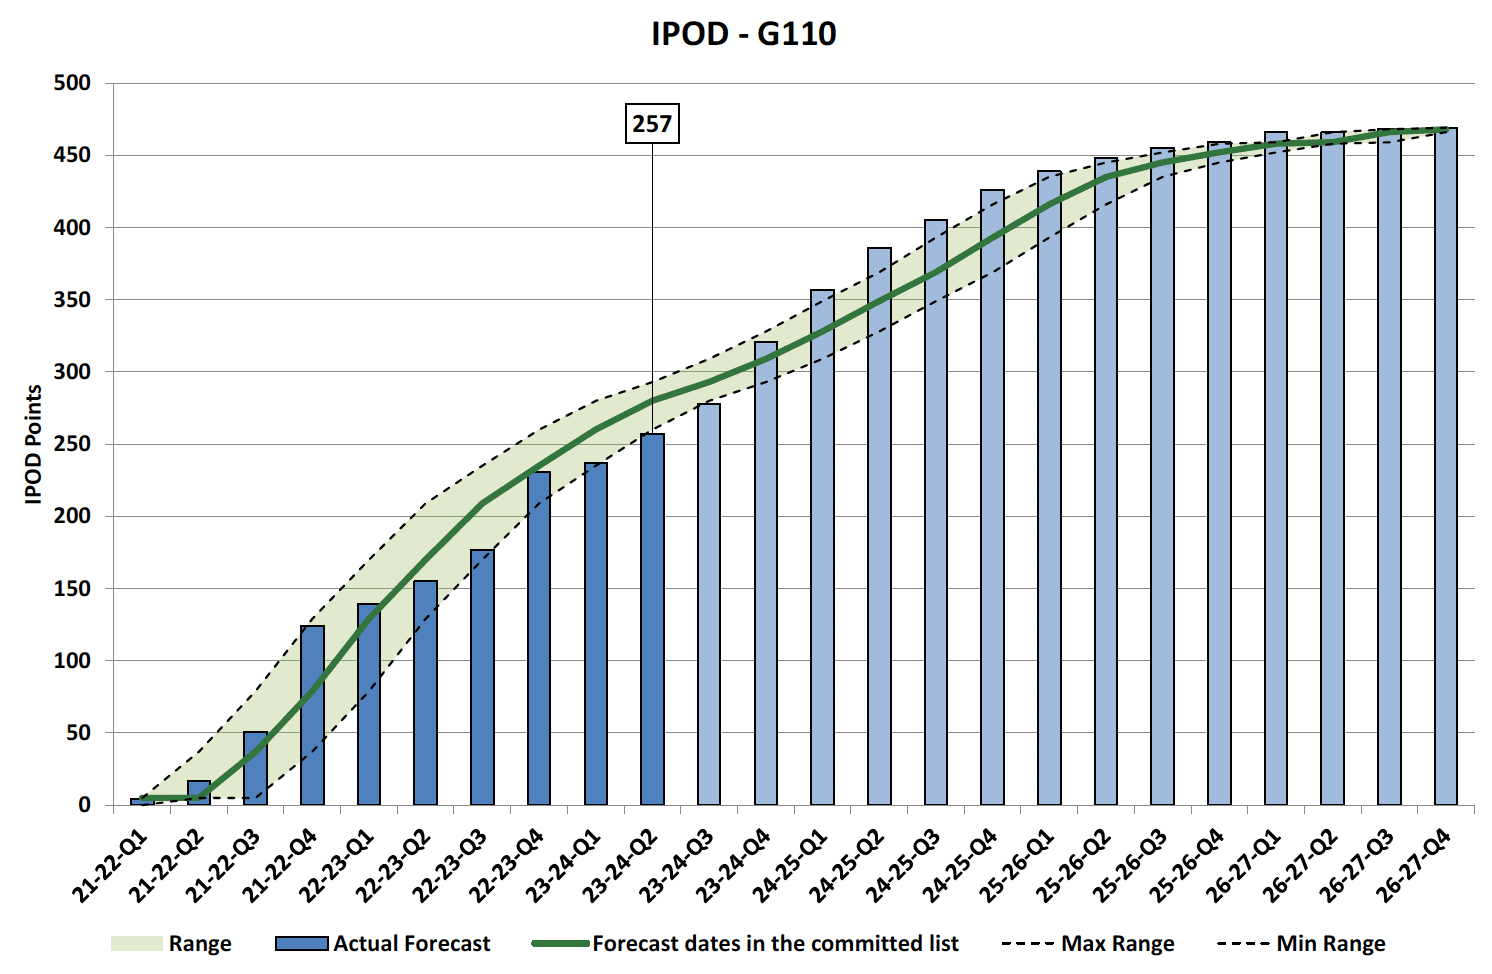
IPOD – Financial Completion
20 projects achieved financial completion during Q2, taking the total achieved to 257 which is just out with the target range of 260 to 293 points. The forecast at the end of Q3 for this indicator is that it will remain out with the range of 280 – 309.
Contact
Email: waterindustry@gov.scot