Programme for International Student Assessment (PISA) 2018 - global competence: results - highlights
The results of the PISA 2018 assessment of Global Competence, showing Scotland’s results and those of other participating states.
Chapter 4: Results of the Global Competence assessment
Key findings
- Scotland's average score in the global competence assessment was 534, higher than the average of all participating countries of 474
- Two countries/economies achieved an average score higher than Scotland, two countries were similar, and 22 countries were lower
- Girls outperformed boys in every country taking part in the assessment, with the exception of Scotland where performance was similar.
The PISA 2018 global competence cognitive assessment
16. The global competence cognitive assessment was conducted at the same time as the PISA 2018 reading, mathematics and science assessments. The global competence assessment consisted of 69 test items organised in 18 units and in four clusters. The global competence cognitive test in the 2018 main survey assessed three cognitive processes that support global competence:
- Evaluate information, formulate arguments and explain issues and situations;
- Identify and analyse multiple perspectives; and
- Evaluate actions and consequences
17. Of the 27 countries and economies that participated in the global competence cognitive test, 11 were OECD members. For this reason, all averages presented in this chapter are for all 27 participating countries and economies combined.
Performance in global competence assessment
18. Scotland's average score in the global competence assessment was 534 compared to the average of all participating countries of 474. Two countries achieved an average score higher than Scotland, two countries were similar, and 22 countries were lower. The top-performing countries/economies were Canada, Hong Kong (China), Scotland, Singapore and Chinese Taipei, with mean performance scores more than 50 points above the all-country average. Table 4.1 outlines which countries were statistically significantly above, similar to and below Scotland:
Table 4.1: Countries with a higher/similar/lower score than Scotland
Higher score than Scotland
Singapore
Canada
Similar score to Scotland
Hong Kong (China)
Chinese Taipei
Lower score then Scotland
Spain
Serbia
Korea
Colombia
Croatia
Costa Rica
Latvia
Brunei
Israel
Albania
Lithuania
Thailand
Greece
Panama
Slovak Republic
Indonesia
Russian Federation
Kazakhstan
Malta
Morocco
Chile
Philippines
19. Eleven OECD member states took part in the Global Competence assessments, with Scotland's score being lower than one member, and higher than nine OECD member states. Chart 4.1 outlines the Global Competence scores for each country/economy that took part in the assessment.
20. As well as comparison between countries' mean scores, it is important to look at how these are distributed within a country. The standard deviation measures the variation in performance amongst 15-year-old students within each country/economy. A higher standard deviation indicates more variation in the results (i.e. a larger proportion of pupils have a PISA score that is further away from the mean).
21. The average standard deviation in performance in the global competence cognitive assessment was 91 score points. Variations measured by the standard deviation in performance scores were the largest in Canada, Israel, Malta, Scotland and Singapore, exceeding 100 score points. Scotland's standard deviation was 107 score points, which was narrower than one country, similar to two countries, and wider than 23 countries.
22. PISA scores can be grouped into different Proficiency Levels. It is common to look at the proportion of students performing below Proficiency Level 2 and at Proficiency Level 5. A description of global competence levels are shown in Figure 4.1.
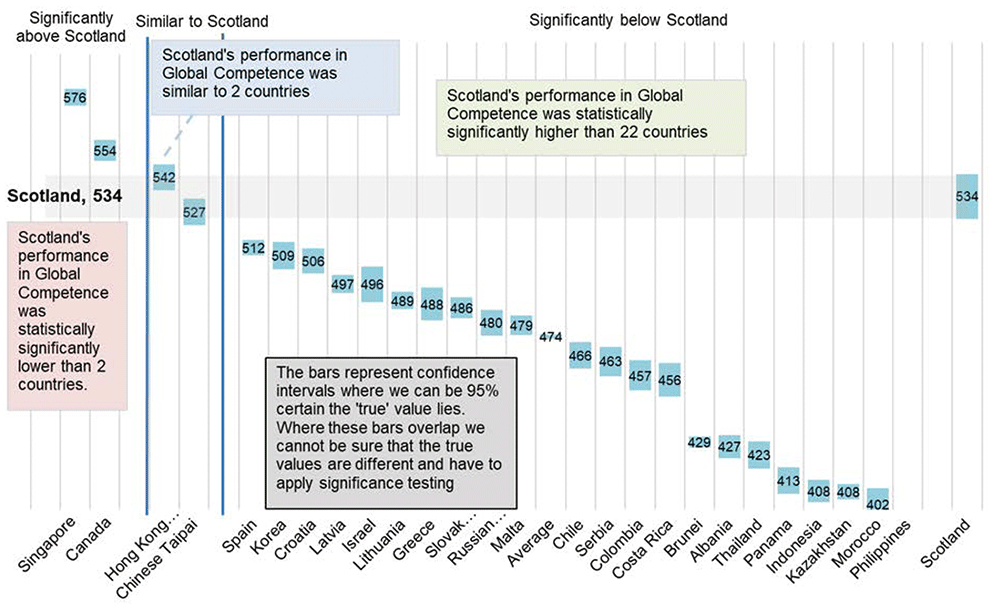
Chart description
Scotland’s performance was statistically significantly lower than two countries (Canada and Singapore), similar to two countries (Hong Kong and Chinese Taipei), and statistically significantly higher than 22 countries.
Figure 4.1: Global Competence assessment levels
Proficiency at Level 5
At the highest level of proficiency in global competence, students are able to analyse and understand multiple perspectives. They are able to examine and evaluate large amounts of information without much support provided in the unit's scenario. Students can effectively explain situations that require complex thinking and extrapolation and can build models of the situation described in the stimulus. On average across all countries, 4% of students attained the highest level of proficiency, Level 5, in global competence. The largest proportions of students who scored at this level were found in Singapore (22%), Canada (15%) and Scotland (12%).
Proficiency at Level 4
At level 4, students could analyse as many as five different perspectives while demonstrating the ability to reason further beyond the information that is provided in the scenario. Students can provide explanations of unfamiliar situations that require deeper reasoning such as causal inference. However, at this level, explanations provided by the students are facilitated by the information provided in the test unit's summary. On average across all countries, 9% of students attained proficiency Level 4 in global competence. The proportions of students who scored at this level were the largest in the top-performing countries.
Proficiency at Level 3
Students at level 3 of proficiency in global competence are able to analyse two to three perspectives. They are able to reason with the information provided in the scenario of the test unit as long as the amount of information that must be evaluated is manageable. Students also demonstrate an ability to evaluate greater amounts of information as long as they do not have to extrapolate too much beyond the information provided to them. On average across all countries, 16% of students attained proficiency Level 3 in global competence.
Proficiency at Level 2
At this level of proficiency, students can identify two perspectives and can evaluate minimal to medium amounts of information. They can reason beyond the described situation when the amount of information provided to them remains minimal. On average across all countries, 21% of students attained Level 2 proficiency in global competence.
Proficiency at Level 1
Students, at level 1, can identify one perspective correctly and use information from the summary of a scenario to complete the corresponding question. They can reason beyond the explicit information provided in the stimulus to understand a novel situation when the context is very familiar. At this level, students are able to evaluate a minimal amount of information and to describe a situation or aspects of a situation. On average across all countries, 23% of students performed at Level 1 proficiency in global competence.
Chart description
Students were grouped into five different levels for their results in the assessments. Scotland had a higher proportion of students who achieved the top two levels compared to the average of all countries.
23. Chart 4.2 shows that 12% of students taking the assessment in Scotland were assessed to be at Level 5, compared to 4.3% of students across all countries. Only two countries had a higher proportion of students assessed at Level 5.
24. 10.5% of students taking the assessment in Scotland were assessed as below Level 1, compared to 26.5% of students across all countries. Four countries had a lower proportion of students assessed as below Level 1.
25. The proportion of students achieving each level in each country is shown in Chart 4.3. The chart is ordered by the proportion of students achieving Level 5 in the assessments.
Chart description
Students were grouped into five different levels for their results in the assessments. The countries with the highest proportion of students who achieved Level 5 in the assessments were Singapore, Canada, Scotland, Hong Kong (China) and Israel.
How does performance on the cognitive test vary according to students' characteristics?
26. Table 4.2 outlines the average scores for students in different groups in Scotland. Girls and boys in Scotland achieved a similar score (541 compared to 527). Girls outperformed boys in every country taking part in the assessment, with the exception of Scotland where the difference was not statistically significant.
| Scotland | OECD | |
|---|---|---|
| Gender | ||
| Girls | 541 | 487 |
| Boys | 527 | 461 |
| PISA Index of economic, social and cultural status | ||
| First quarter (most disadvantaged) | 497 | 440 |
| Second quarter | 519 | 463 |
| Third quarter | 547 | 481 |
| Fourth quarter (least disadvantaged) | 586 | 516 |
| Immigration status | ||
| Non-immigrant students | 535 | 476 |
| Immigrant students | 546 | 459 |
Figures in bold represent the figure which is statistically significantly higher (where a statistically significant difference exists)
27. The OECD measure social background using their own Index of Economic, Social & Cultural Status (ESCS) calculated from data given by students in the background questionnaire. On average across the 27 participating countries and economies, the least disadvantaged students (fourth quarter) outperformed their disadvantaged peers (first quarter) by 75 score points. In Scotland, the difference between the two groups was above the average (89 points).
28. Non-immigrant and immigrant students achieved a similar average score in the assessment, with the difference being not statistically significant.
Contact
Email: keith.dryburgh@gov.scot