Priority marine feature surveys within the Small Isles MPA and surrounding waters
Marine Scotland collected and analysed abundance information for species with conservation importance relevant to priority marine features in the Small Isles MPA and the surrounding region (2012 – 2017). Abundance changes for key species and the relationship with fishing activity was assessed.
3. Results
3.1 Baseline benthic monitoring
In total, 9,374 DSI quadrats were obtained during the study period. Of these DSI quadrats, 8,137 were suitable for the analysis of species abundance (Annex A, Table A.1). In addition, 3,690 minutes of quantifiable video footage were obtained (Annex A, Table A.2).
Box-level density values for the eight target species across each available box and year combination are provided in Annex A, tables A.3 – A.10 (Greathead et al., 2023). In general, target species were surveyed sporadically across the survey period using a mix of DSI and HDV footage, with gaps in spatial or temporal coverage making it difficult to detect trends in density across sites and survey years. Given the baseline nature of the survey where different sites were visited in different years, it was considered most appropriate for the spatial or temporal trends in species density at the survey box level to be reported descriptively. The exception to this is the case study for F. quadrangularis and S. pallida (Annex D), where apparent changes in species density over time were examined in a few example locations to illustrate the potential for statistical analysis based on a modelling approach.
Funiculina quadrangularis was found in the majority (22) of survey boxes (Table 5; Annex A, Table A.3) but was not encountered in nine of the original 31 survey boxes. Funiculina quadrangularis was most consistently recorded from S07 just south of the Sound of Canna, where it was present in all the survey years that box was visited (2012, 2014 – 2017). The highest box-level densities for F. quadrangularis were recorded from S10 (southwest of Rum outside the MPA), S11 (north of Rum within the MPA) and S12 (southeast of Rum and outside the MPA). The highest box-level F. quadrangularis density was in S12 in 2017 (0.510 n.m-2); S10, S11 and S12 were the only locations to record box-level densities of F. quadrangularis greater than 0.100 n.m-2. There were 21 box and year combinations where F. quadrangularis was observed but at low densities of 0.010 n.m-2 or less. All the low density combinations occurred after 2014, except for B15 and V11 in 2014. Indeed, after 2014 all box-level densities for F. quadrangularis were lower than 0.100 n.m-2, apart from box S12 in 2017, which had a density of 0.510 n.m-2.
Table 5
Densities (n.m-2) of Funiculina quadrangularis within the Small Isles region sampled between 2012 and 2017. *Densities calculated from High Definition Video (HDV); **Densities calculated from Digital Still Image in a year when HDV data are also available. Any empty cell ('-') denotes years in which no data are available for that survey box. Densities are reported to three decimal places; a value of '0' indicates that F. quadrangularis was not observed from the seabed surveyed in that box and year. Density results are only reported for boxes where F. quadrangularis was present; full density results are available in Annex A, Table A.3.
| Survey Box | 2012 | 2013 | 2014 | 2015 | 2016 | 2017 |
|---|---|---|---|---|---|---|
| B14 | - | - | 0.021 | - | - | - |
| B15 | - | - | 0.010 | - | - | - |
| S05 | 0.018 | - | - | - | - | 0.009 |
| S06 | 0.048 | - | - | 0.006* | 0.006* | 0.016* |
| S07 | 0.058 | - | 0.074 | 0.003 | 0.003 | 0.006 |
| S08 | 0.060 | - | 0.087 | 0.006 | 0 | 0 |
| S09 | 0 | - | 0 | - | - | 0.002* |
| S10 | 0.285 | - | 0.303 | - | - | 0.082 |
| S11 | 0.149 | - | 0.182 | - | - | - |
| S12 | 0.430 | - | 0.295 | - | 0.056 | 0.510 |
| S15 | - | - | - | 0.008* | 0.019 | 0.012* |
| S17 | 0.011 | - | - | 0.026* | 0.005* | 0.002* |
| S19 | - | - | - | 0.029 | 0.031 | 0.011 |
| S23 | - | - | - | 0.006 | 0 | 0.005 |
| S40 | - | - | - | 0.047** | 0.034 | 0 |
| S51 | - | - | - | 0.075* | - | 0.045 |
| S64 | - | - | - | 0.073* | 0.083* | - |
| S66 | - | - | - | 0.030* | - | - |
| S67 | - | - | 0 | 0.024* | 0.017* | 0.005* |
| S68 | - | - | - | 0.006** | 0.008** | - |
| V04 | - | - | 0.048 | - | - | - |
| V05 | - | - | 0 | - | 0.230* | - |
| V11 | - | - | 0.005 | 0.006* | 0.002* | 0.010* |
The F. quadrangularis case study sought to determine whether apparent decreases in box-level density from 2014 through 2015, 2016 and 2017 were statistically significant. Density was modelled for survey boxes S07 and S08 (southern Sound of Canna) across the survey period. Significant decreases in F. quadrangularis were detected for both survey boxes between 2014 and all subsequent survey years (2015, 2016 and 2017). Case study details, including the outcome of statistical tests, are provided in Annex D.
Swiftia pallida was observed in approximately half (15) of the original 31 survey boxes (Table 6; Annex A, Table A.4). The highest recorded densities of S. pallida occurred at V05 and S16 (both south of Skye in the northeast of the MPA) and at S68 (southern part of the Sound of Canna); these were the only locations where box-level densities greater than 1.000 n.m-2 were recorded. The single highest box-level density for S. pallida was in S16 in 2013 (5.317 n.m-2); this location was not surveyed in subsequent years. There were eight box and year combinations where S. pallida was observed but at low densities of 0.100 n.m-2 or less. All the low density combinations occurred after 2014, except for S03 in 2012 which was not surveyed in subsequent years. Apparent density changes over time did not demonstrate consistent patterns across boxes.
Table 6
Densities (n.m-2) of Swiftia pallida within the Small Isles region sampled between 2012 and 2017. *Densities calculated from High Definition Video (HDV); **Densities calculated from Digital Still Image in a year when HDV data are also available. Any empty cell ('-') denotes years in which no data are available for that survey box. Densities are reported to three decimal places; a value of '0' indicates that S. pallida was not observed from the seabed surveyed in that box and year. Density results are only reported for boxes where S. pallida was present; full density results are available in Annex A, Table A.4.
| Survey Box | 2012 | 2013 | 2014 | 2015 | 2016 | 2017 |
|---|---|---|---|---|---|---|
| S03 | 0.007 | - | - | - | - | - |
| S06 | 0.193 | - | - | 0.345* | 0.124* | 0.106* |
| S15 | - | - | - | 0* | 0.011 | 0* |
| S16 | - | 5.317 | - | 0.215* | - | - |
| S17 | 0.110 | - | - | 0* | 0.004* | 0.192* |
| S19 | - | - | - | 0.636 | 0.319 | 0 |
| S41 | 0.146 | - | - | 0.225* | - | 0.193* |
| S46 | - | - | - | 0.011* | 0.005* | 0.023* |
| S64 | - | - | - | 0.021* | 0* | - |
| S66 | - | - | - | 0.102* | - | - |
| S67 | - | - | 0 | 0.479* | 0.098* | 0.470* |
| S68 | - | - | - | 3.316** | 0.615** | - |
| V05 | - | - | 1.777 | - | 0.302* | - |
| V11 | - | - | 0.352 | 0.682* | 0.265* | 0.613* |
| V12 | - | - | 0.798 | - | - | 0.403 |
The S. pallida case study sought to determine whether there were any statistically significant changes in box-level density across 2015, 2016 and 2017. Density was modelled for survey boxes S06 and S67 using available HDV data, which was only available for these three years. No significant changes in S. pallida were detected for survey boxes S06 and S67 (both within the Sound of Canna) between 2015, 2016 and 2017. Case study details, including the outcome of statistical tests, are provided in Annex D.
Parazoanthus anguicomus was observed in nine of the survey boxes (Table 7; Annex A, Table A.5), all of which occurred within the Sound of Canna apart from S66 (east of Rum) and V05 (south of Skye). The highest box-level densities of P. anguicomus were recorded in S41 in 2012 (0.216 o.m-2); and S66 in 2015 (0.109 o.m-2); these were the only year and box combinations where densities of P. anguicomus greater than 0.100 o.m-2 were recorded. There were eight survey box and year combinations where P. anguicomus was observed but at low densities of 0.010 n.m-2 or less; all these combinations occurred in 2016 or 2017 apart from S06 in 2012. Apparent density changes over time did not appear to demonstrate consistent patterns across boxes.
Table 7
Densities (o.m-2) of Parazoanthus anguicomus within the Small Isles region sampled between 2012 and 2017. *Densities calculated from High Definition Video (HDV); **Densities calculated from Digital Still Image in a year when HDV data are also available. Any empty cell ('-') denotes years in which no data are available for that survey box. Densities are reported to three decimal places; a value of '0' indicates that P. anguicomus was not observed from the seabed surveyed in that box and year. Density results are only reported for boxes where P. anguicomus was present; full density results are available in Annex A, Table A.5.
| Survey Box | 2012 | 2013 | 2014 | 2015 | 2016 | 2017 |
|---|---|---|---|---|---|---|
| S06 | 0.004 | - | - | 0.015* | 0.005* | 0.003* |
| S17 | 0.038 | - | - | 0* | 0* | 0.002* |
| S19 | - | - | - | 0.029 | 0 | 0 |
| S41 | 0.219 | - | - | 0.011* | - | 0.007* |
| S46 | - | - | - | 0.025* | 0.001* | 0.013* |
| S66 | - | - | - | 0.109* | - | - |
| S67 | - | - | 0 | 0.017* | 0.002* | 0.020* |
| S68 | - | - | - | 0.039** | 0.030** | - |
| V05 | - | - | 0 | - | 0.002* | - |
Atrina fragilis was only recorded in three survey boxes in the northern Sound of Canna (S03, S04, S15) and in one survey box outside of the MPA at V11, southeast of the island of Muck (Table 8; Annex A, Table A.6). The previously unknown occurrence of A. fragilis at V11 was revealed during a wider survey in 2014, guided by the output of SDMs produced by Marine Scotland. Atrina fragilis within S03 and S04 occurs within the wider dredge spoil disposal area, whereas S15 is located outside of the localised de facto refugium the dredge spoil disposal site provides. The highest density of A. fragilis was recorded for S03 (0.691 n.m-2) but this box was not surveyed after 2012. Box-level density for S04 appeared to decrease across 2012, 2015 and 2017 (0.075, 0.040 and 0.025 n.m-2 respectively). Similar patterns appeared to occur for S15 across 2015, 2016 and 2017 (0.012, 0.011 and 0.007 n.m-2) and for V11 across 2014, 2015 and 2016 (0.005, 0.001, 0.001 n.m-2). Box-level density was lower for V11 compared to the three Sound of Canna boxes, with no live A. fragilis observed at V11 after 2016.
Table 8
Densities (n.m-2) of Atrina fragilis within the Small Isles region sampled between 2012 and 2017. *Densities calculated from High Definition Video (HDV); **Densities calculated from Digital Still Image in a year when HDV data are also available. Any empty cell ('-') denotes years in which no data are available for that survey box. Densities are reported to three decimal places; a value of '0' indicates that A. fragilis was not observed from the seabed surveyed in that box and year. Density results are only reported for boxes where A. fragilis was present; full density results are available in Annex A, Table A.6.
| Survey Box | 2012 | 2013 | 2014 | 2015 | 2016 | 2017 |
|---|---|---|---|---|---|---|
| S03 | 0.691 | - | - | - | - | - |
| S04 | 0.075 | - | - | 0.040* | - | 0.025* |
| S15 | - | - | - | 0.012* | 0.011 | 0.007* |
| V11 | - | - | 0.005 | 0.001* | 0.001* | 0* |
Leptometra celtica was recorded in approximately half (15) of the original 31 survey boxes (Table 9; Annex A, Table A.7). The L. celtica records all occurred within the Sound of Canna apart from S66 east of Rum, S64 south of the MPA boundary, and S16 and V05 south of Skye. The highest box-level densities of L. celtica were all recorded from the Sound of Canna: S06 (2012, 2015 and 2017); S17 (2012, 2015 and 2016); and S67 (2014). These were the only year and box combinations where densities of L. celtica greater than 1.000 n.m-2 were recorded. The highest box-level density of L. celtica was for S17 in 2015 (4.236 n.m-2). There were nine survey box and year combinations where L. celtica was observed but at low densities of 0.100 n.m-2 or less. Apparent density changes over time did not appear to demonstrate consistent patterns across boxes.
Table 9
Densities (n.m-2) of Leptometra celtica within the Small Isles region sampled between 2012 and 2017. *Densities calculated from High Definition Video (HDV); **Densities calculated from Digital Still Image in a year when HDV data are also available. Any empty cell ('-') denotes years in which no data are available for that survey box. Densities are reported to three decimal places; a value of '0' indicates that L. celtica was not observed from the seabed surveyed in that box and year. Density results are only reported for boxes where L. celtica was present; full density results are available in Annex A, Table A.7.
| Survey Box | 2012 | 2013 | 2014 | 2015 | 2016 | 2017 |
|---|---|---|---|---|---|---|
| S06 | 3.336 | - | - | 1.217* | 0.805* | 1.221* |
| S08 | 0 | - | 0 | 0.006 | 0 | 0 |
| S14 | - | - | 0.014 | - | - | - |
| S15 | - | - | - | 0.020* | 0 | 0.001* |
| S16 | - | 0 | - | 0.062* | - | - |
| S17 | 1.660 | - | - | 4.236* | 1.640* | 0.504* |
| S19 | - | - | - | 0 | 0.044 | 0 |
| S40 | - | - | - | 0** | 0.156 | 0.015 |
| S41 | 0.219 | - | - | 0.479* | - | 0.117* |
| S46 | - | - | - | 0.198* | 0* | 0.129* |
| S64 | - | - | - | 0.090* | 0.039* | - |
| S66 | - | - | - | 0.514* | - | - |
| S67 | - | - | 1.139 | 0.479* | 0.760* | 0.10* |
| S68 | - | - | - | 0.311** | 0** | - |
| V05 | - | - | 0 | - | 0.242* | - |
Modiolus modiolus observations only occurred within S03 and S04, two near-adjacent survey boxes in the Sound of Canna (Table 10; Annex A, Table A.8). S03 was only surveyed in 2012, where box-level M. modiolus density was 0.677 n.m-2. The M. modiolus density at S04 appeared to decrease between 2012 and 2015 (12.868 and 0.525 n.m-2, respectively) with no M. modiolus observed in 2017.
Table 10
Densities (n.m-2) of Modiolus modiolus within the Small Isles region sampled between 2012 and 2017. *Densities calculated from High Definition Video (HDV); **Densities calculated from Digital Still Image in a year when HDV data are also available. Any empty cell ('-') denotes years in which no data are available for that survey box. Densities are reported to three decimal places; a value of '0' indicates that M. modiolus was not observed from the seabed surveyed in that box and year. Density results are only reported for boxes where M. modiolus was present; full density results are available in Annex A, Table A.8.
| Survey Box | 2012 | 2013 | 2014 | 2015 | 2016 | 2017 |
|---|---|---|---|---|---|---|
| S03 | 0.677 | - | - | - | - | - |
| S04 | 12.868 | - | - | 0.525* | - | 0* |
Arachnanthus sarsi was recorded in nine of the survey boxes, five within the Sound of Canna, one from S66 east of Rum, two outside of the MPA at S12 and S64 south of the MPA boundary, and one at V11 southeast of Muck (Table 11; Annex A, Table A.9). Box-level densities of A. sarsi were consistently low, with the highest density occurring at S15 in 2017 (0.015 n.m-2). All other box and year combinations where A. sarsi was recorded had densities less than 0.010 n.m-2. There were no consistent patterns in density apparent across boxes or years.
Table 11
Densities (n.m-2) of Arachnanthus sarsi within the Small Isles region sampled between 2012 and 2017. *Densities calculated from High Definition Video (HDV); **Densities calculated from Digital Still Image in a year when HDV data are also available. Any empty cell ('-') denotes years in which no data are available for that survey box. Densities are reported to three decimal places; a value of '0' indicates that A. sarsi was not observed from the seabed surveyed in that box and year. Density results are only reported for boxes where A. sarsi was present; full density results are available in Annex A, Table A.9.
| Survey Box | 2012 | 2013 | 2014 | 2015 | 2016 | 2017 |
|---|---|---|---|---|---|---|
| S03 | 0.007 | - | - | - | - | - |
| S12 | 0 | - | 0 | - | 0.005 | 0 |
| S15 | - | - | - | 0.002* | 0* | 0.015* |
| S17 | 0.005 | - | - | 0* | 0* | 0.001* |
| S46 | - | - | - | 0* | 0* | 0.002* |
| S64 | - | - | - | 0.004* | 0.001* | - |
| S66 | - | - | - | 0.001* | - | - |
| S67 | - | - | 0 | 0* | 0.001* | 0.002* |
| V11 | - | - | 0 | 0.001* | 0* | 0.006* |
Pachycerianthus multiplicatus was recorded in nine survey boxes (Table 12; Annex A, Table A.10). Six of these boxes occurred within the Sound of Canna and three boxes (S10, S12 and S64) were located south of the MPA boundary. Box-level densities were low for P. multiplicatus at all locations. The highest P. multiplicatus density was 0.009 n.m-2, which was recorded from S12 in 2012 and S05 in 2017. There were no apparent patterns in density across boxes or years.
Table 12
Densities (n.m-2) of Pachycerianthus multiplicatus within the Small Isles region sampled between 2012 and 2017. *Densities calculated from High Definition Video (HDV); **Densities calculated from Digital Still Image in a year when HDV data are also available. Any empty cell ('-') denotes years in which no data are available for that survey box. Densities are reported to three decimal places; a value of '0' indicates that P. multiplicatus was not observed from the seabed surveyed in that box and year. Density results are only reported for boxes where P. multiplicatus was present; full density results are available in Annex A, Table A.10.
| Survey Box | 2012 | 2013 | 2014 | 2015 | 2016 | 2017 |
|---|---|---|---|---|---|---|
| S05 | 0 | - | - | - | - | 0.009 |
| S06 | 0.004 | - | - | 0.001* | 0* | 0* |
| S10 | 0 | - | 0 | - | - | 0.007 |
| S12 | 0.009 | - | 0 | - | 0 | 0 |
| S17 | 0 | - | - | 0* | 0.003* | 0.002* |
| S40 | - | - | - | 0** | 0.003 | 0 |
| S46 | - | - | - | 0* | 0* | 0.001* |
| S64 | - | - | - | 0.001* | 0.003* | - |
| S67 | - | - | 0 | 0.002* | 0.001* | 0* |
3.2 Assessing the impact of fishing activity on Funiculina quadrangularis abundance
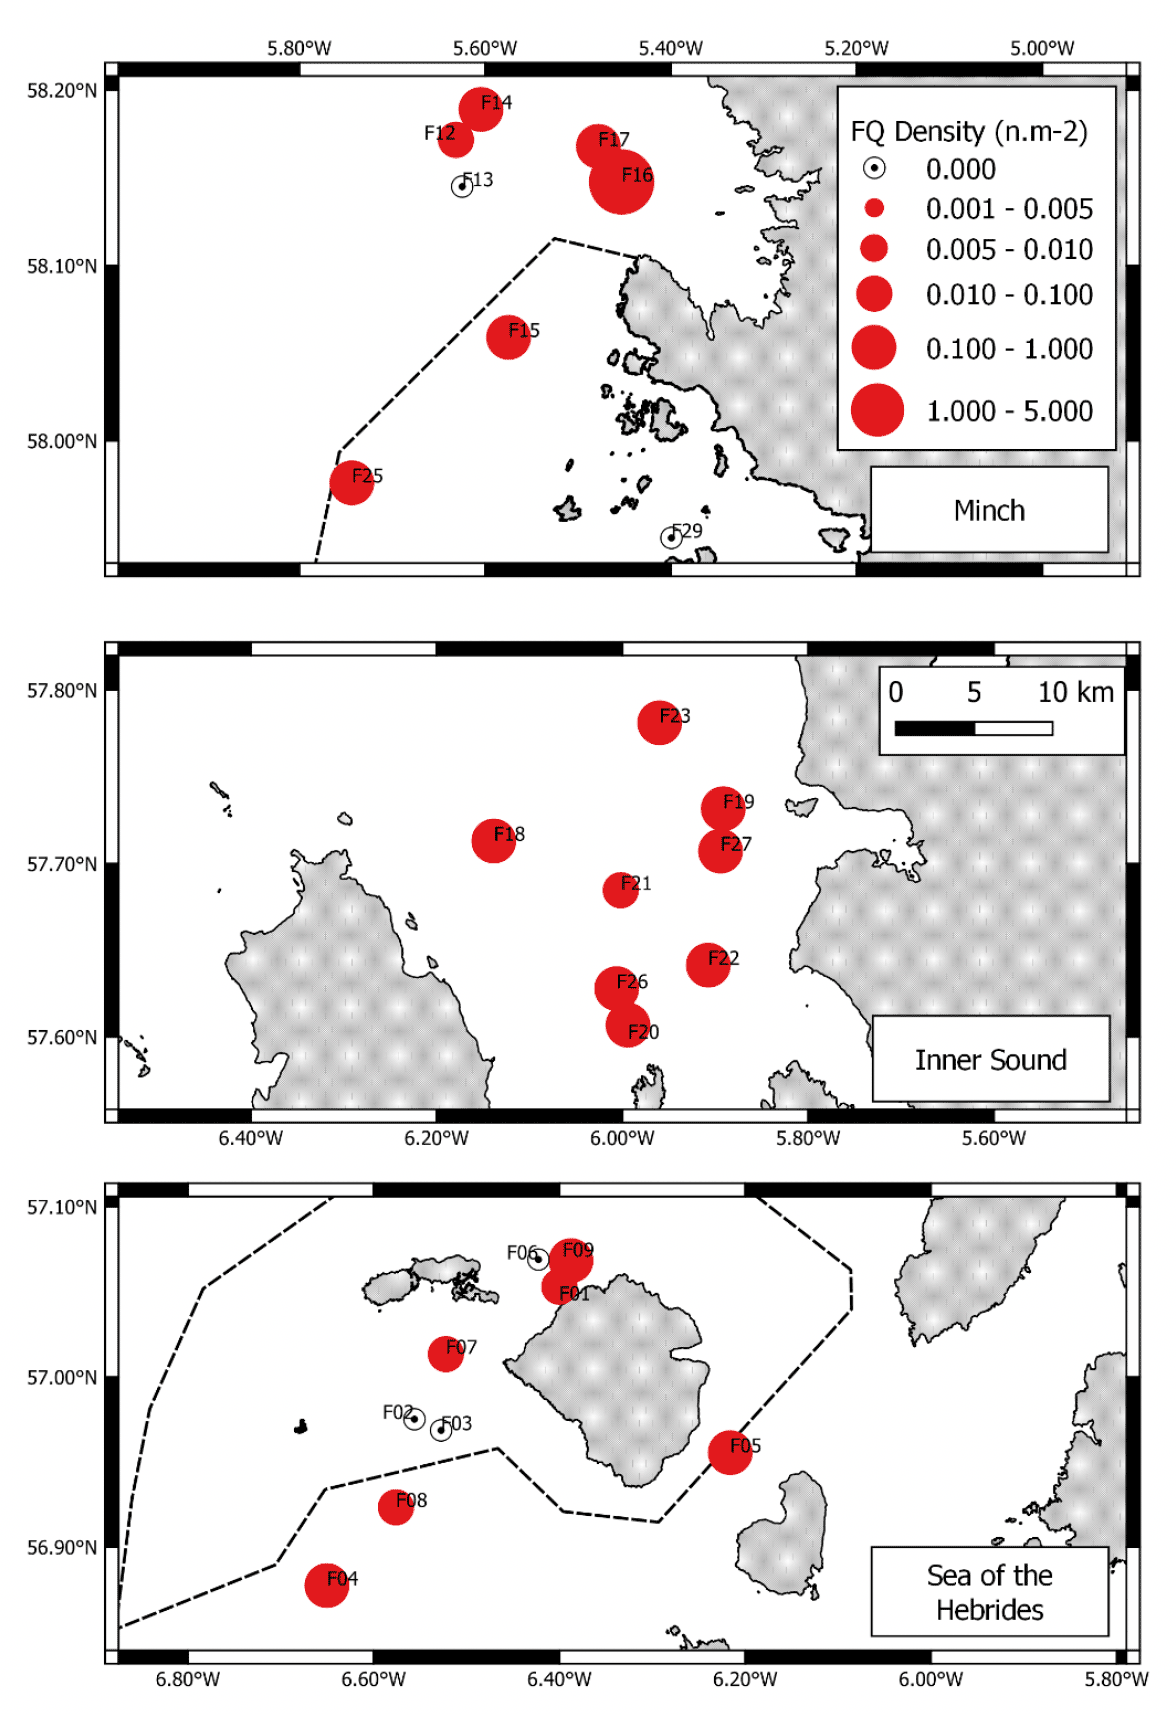
In total, 29 boxes targeting F. quadrangularis were surveyed during 2017 within the Sea of the Hebrides, Inner Sound and Minch, some located within the larger PMF survey boxes described in section 3.1 (Fig. 5; Annex A, Table A.11 of the Annex Materials document, Greathead et al. (2023)). Mean densities of F. quadrangularis within the surveyed boxes ranged from 0.00 to 3.80 n.m-2 over the three areas. Percentage mud (Χ2 = 2.888, p = 0.08), depth (Χ2 = 3.610, p = 0.06), slope (Χ2 = 13.064, p < 0.001), curvature (Χ2 = 14.357, p < 0.001) and area (Χ2 = 13.430, p < 0.01) were found to have a significant effect on the abundance of F. quadrangularis. Percentage mud had a positive relationship with F. quadrangularis mean densities, with depth, slope, and curvature negatively related to F. quadrangularis density. The Sea of the Hebrides had lower densities of F. quadrangularis than the Inner Sound and the Minch, with the Minch recording the highest densities. Box F16 within the Minch, sited west of Lochinver, recorded F. quadrangularis at nearly four times (3.80 n.m-2) the level of any other box surveyed. Fishing intensity (Χ2= 1.238, p = 0.26), gravel content (Χ2= 0.355, p = 0.55) and minimum salinity (Χ2 = 3.068, p = 0.08) were not found to have a significant effect on F. quadrangularis density. To assess whether the higher densities observed at F16 were driving the relationships with environmental variables, an additional model run was conducted excluding F16 from the dataset. The removal of F16 from the dataset was not found to affect the overall structure of the final model.
Contact
Email: rachel.boschen-rose@gov.scot