Planning Applications Statistics, 2022/23: Annual and Quarterly (October 2022 to March 2023)
Statistics on planning application decision-making timescales for 2022-2023. Historic annual statistics back to 2018-2019 are also presented.
Part of
Annex A – Yearend 2022/23 Key Findings
1. Local Developments
1.1. All Local Developments
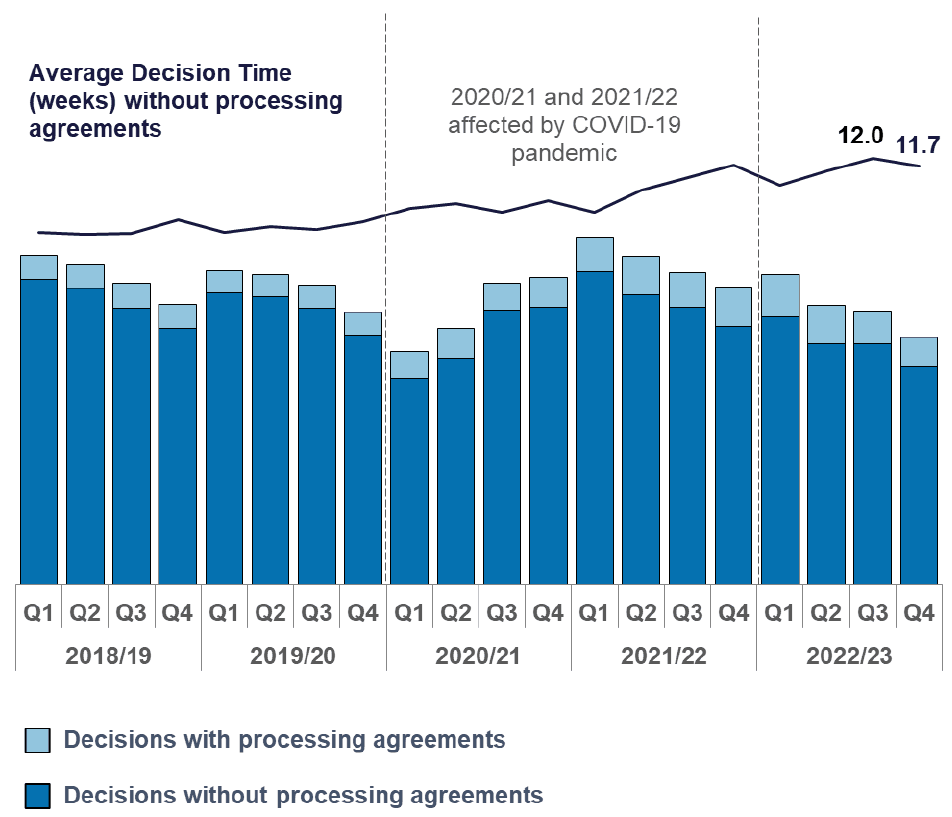
There were 11,607 decisions on local developments in the last two quarters of 2022/23. This was the lowest yearend figure in this period. The average decision time for applications not subject to processing agreements remained higher than pre-pandemic times at 12.0 weeks in Q3 and 11.7 weeks in Q4.
In quarter three there were 741 local development applications with processing agreements, with 60% meeting agreed timescales that had been set between developers and local authorities. In quarter four there were 679 with three-quarters (76%) meeting the agreed timescales. Some authorities continued to use more processing agreements for local applications than had been used in the past.
1.2. Local Housing Developments
There were 1,659 local housing developments not subject to processing agreements decided during the last two quarters of 2022/23. This was a low figure for the yearend period. The average decision time remained higher than pre-pandemic times at 17.3 weeks in Q3 and 19.3 weeks in Q4. The percentage of decisions made in less than two months was 41% in Q3 and fell to a low of 35% in Q4. Almost two thirds of 358 applications with processing agreements met agreed timescales.
2. Applications for Major Developments
2.1. All Major Developments
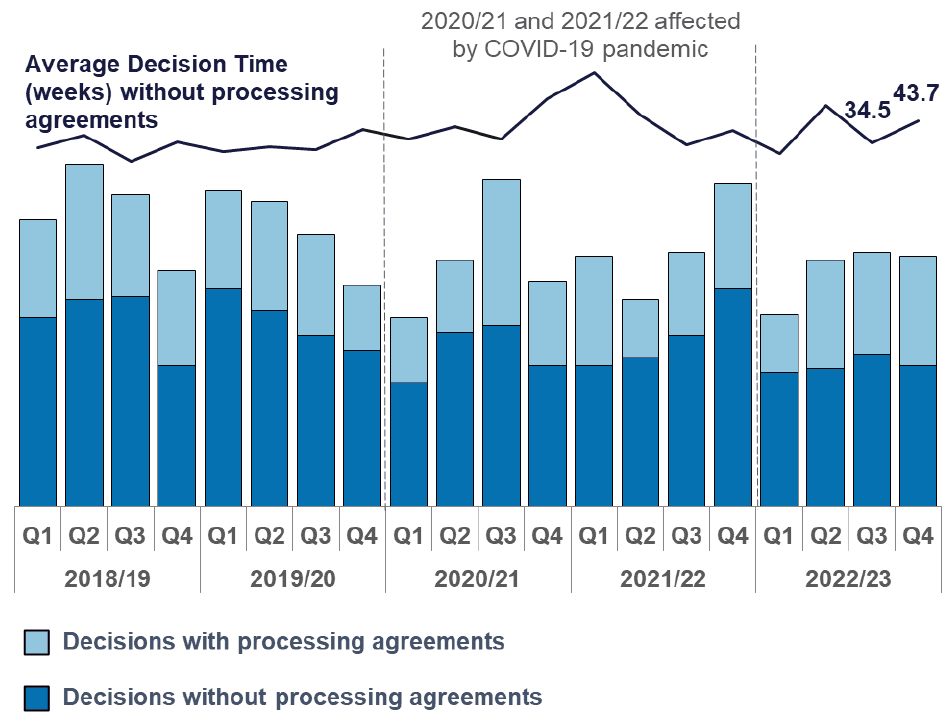
There were 139 decisions on major developments in the last two quarters of 2022/23. The average decision times for the 81 applications not subject to processing agreements were only slightly higher than pre-pandemic times at 34.5 weeks in Q3 and 43.7 weeks in Q4.
In quarter three there were 28 major development applications with processing agreements over half (57%) met agreed timescales that had been set between developers and local authorities. In quarter four there were 30, less than half (47%) meeting the agreed timescales.
2.2. Major Housing Developments
There were 24 major housing developments not subject to processing agreements decided during the last two quarters of 2022/23. The average decision times were 35.9 weeks in Q3 and 53.4 weeks in Q4. There were 23 applications with processing agreements and timescales were met for 55% in Q3 and 50% in Q4.
Contact
Email: planstats@gov.scot