Planning Applications Statistics, 2022/23: Annual and Quarterly (October 2022 to March 2023)
Statistics on planning application decision-making timescales for 2022-2023. Historic annual statistics back to 2018-2019 are also presented.
Part of
2. Local Developments
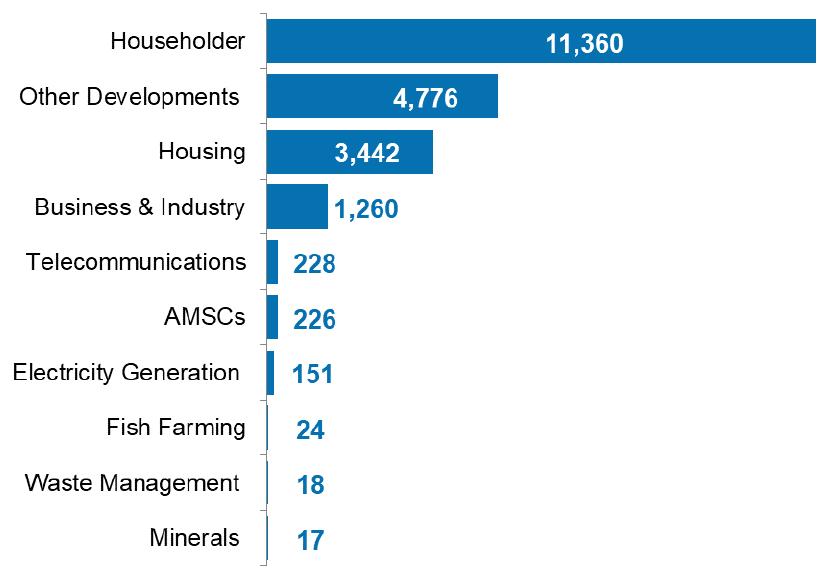
Local developments include applications for changes to houses and smaller developments for new housing. They also include applications covering areas of development such as minerals, business & industry, waste management, electricity generation, freshwater fish farming, marine finfish farming, marine shellfish farming, telecommunications, Approval of Matters Specified in Conditions (AMSCs) and other developments.
Some authorities use processing agreements where the developer and the authority agree on timescales for decisions. When an application is subject to a processing agreement it is not included in average decision time calculations.
2.1. All Local Developments
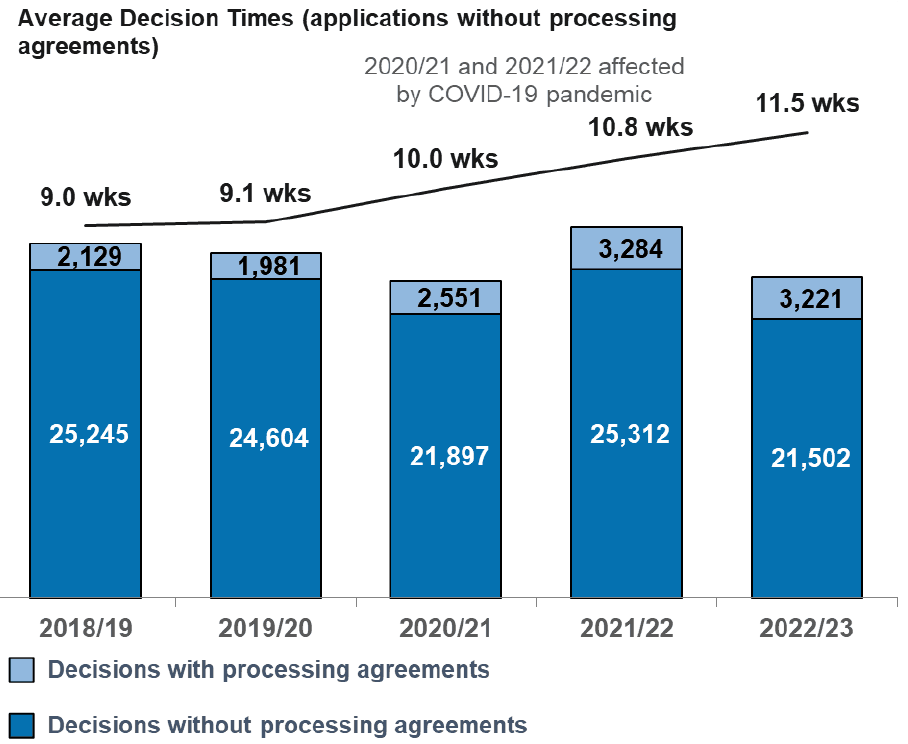
There were 24,723 local development applications decided in 2022/23. Numbers in fell in 2020/21 at the beginning of pandemic restrictions and in 2021/22 numbers seem to have been boosted as those restrictions began to be lifted. The number has fallen in 2022/23 to the lowest number other than the pandemic year of 2020/21. The average decision time for applications without processing agreements increased during 2020/21 and 2021/22. This has increased again in 2022/23 to 11.5 weeks despite the number of applications falling. In 2019/20, before the pandemic, the average time was 9.1 weeks.
Statutory time period for local applications
Under planning regulations, authorities should determine applications for local developments within two months of the validation date. This is the date when the last piece of information on the content is received. More information is available in the planning circular on development management procedures.
View Planning circular 3/2022: development management procedures - gov.scot (www.gov.scot)
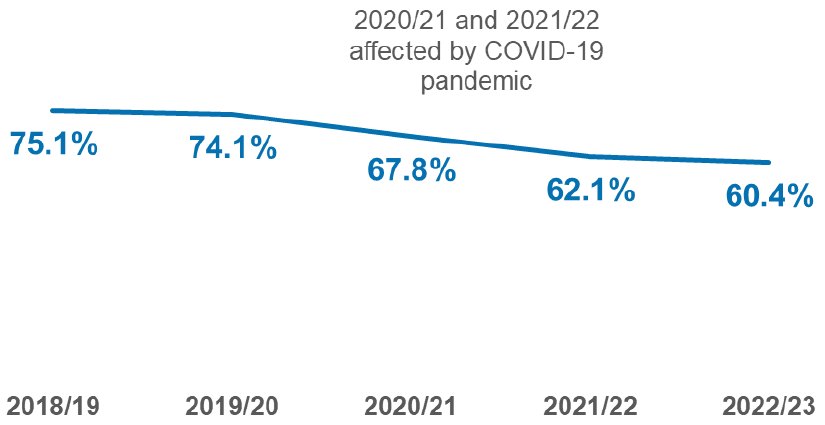
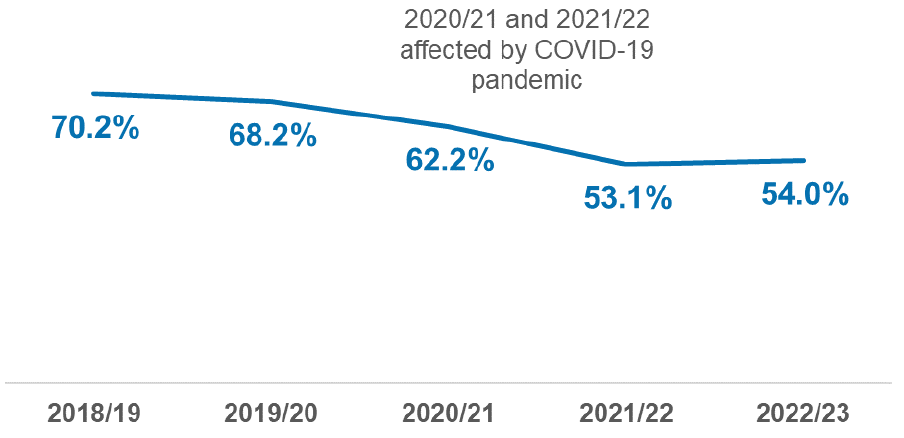
The percentage decided within two months continued to fall to 60% in 2022/23. This is lower than before the pandemic when around 74% were decided within two months. Where these applications were from householders making changes to their properties, the percentage was higher at 72%.
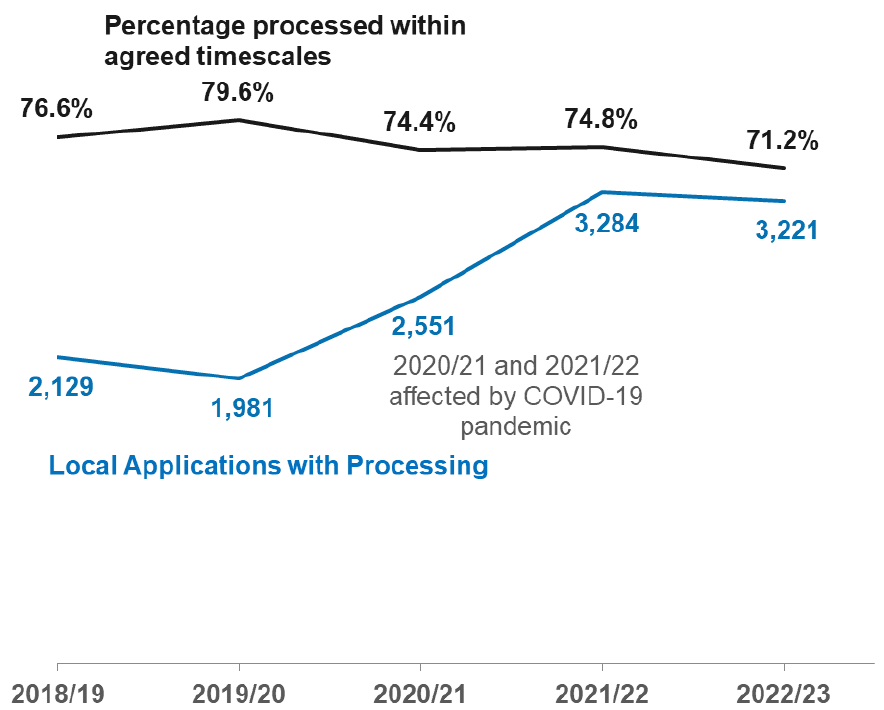
In 2022/23, there were 3,221 local development applications with processing agreements. Agreed timescales were met for 71% of applications. The use of processing agreements by planning authorities for local applications increased during the pandemic. This has remained higher than the years prior.
2.2. Local Housing Developments
Local housing developments are those that have less than 50 dwellings and a site area that is less than 2 hectares.
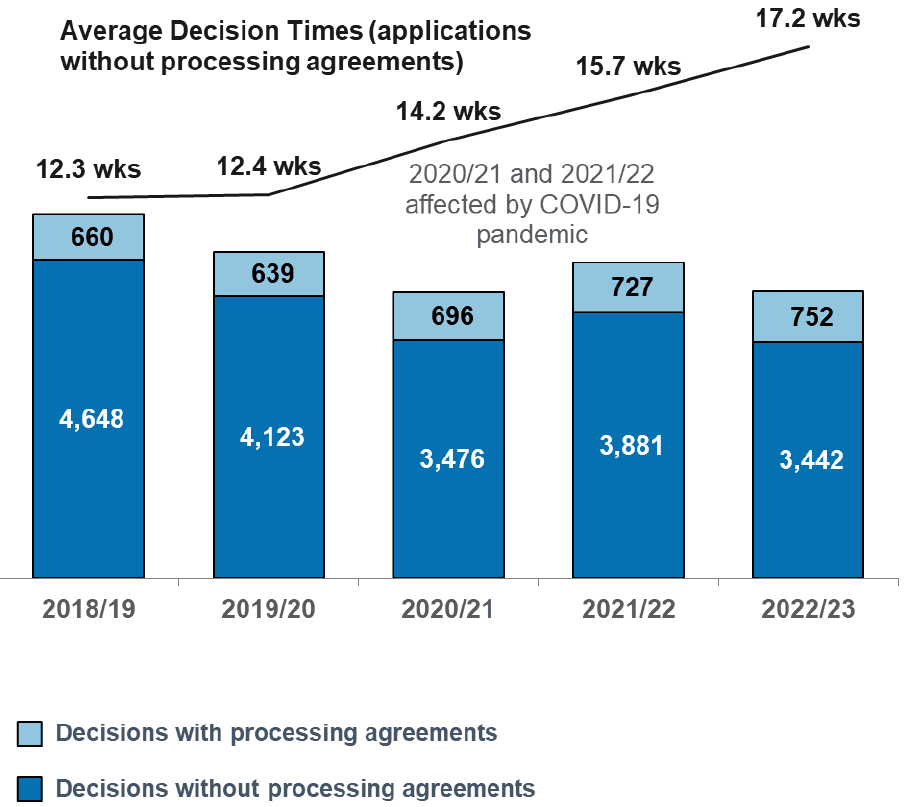
There is a downward trend in local housing applications, numbering 4,194 in 2022/23, compared to 5,308 in 2018/19. Average decision times for those without processing agreements have increased by 4.8 weeks since 2019/20 and only 39% were decided within two months, compared to 56% in 2019/20.
There can be some long decision times for local housing developments. Very long decision times affect the average (mean). The middle value (median) of decision times was lower than the average (17.2 wks) at 10.1 weeks.
752 local housing applications with processing agreements were determined. Two-thirds (66%) of these met timescales agreed between developers and local authorities.
2.3. Local Business and Industry Developments
Business and Industry developments include construction of a building or structure for any of the following: use as an office, for research and development of products or processes, for any industrial process or for use for storage or as a distribution centre. To be classed as local, the gross floor space must not be more than 10,000 square metres and the site area must be less than 2 hectares.
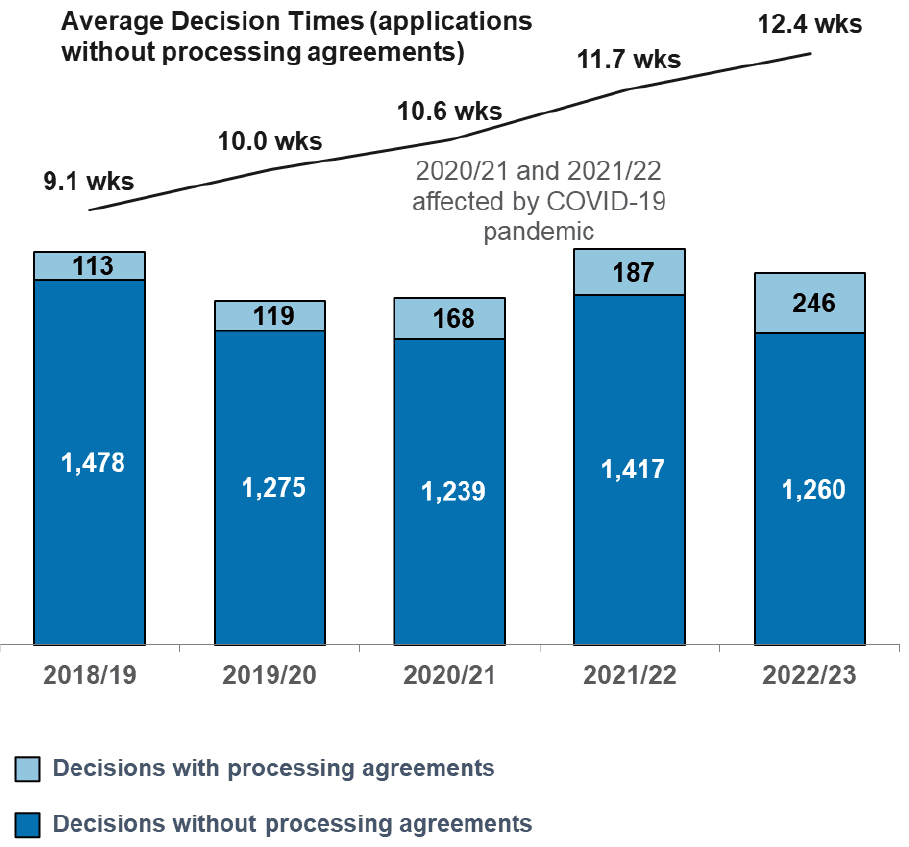
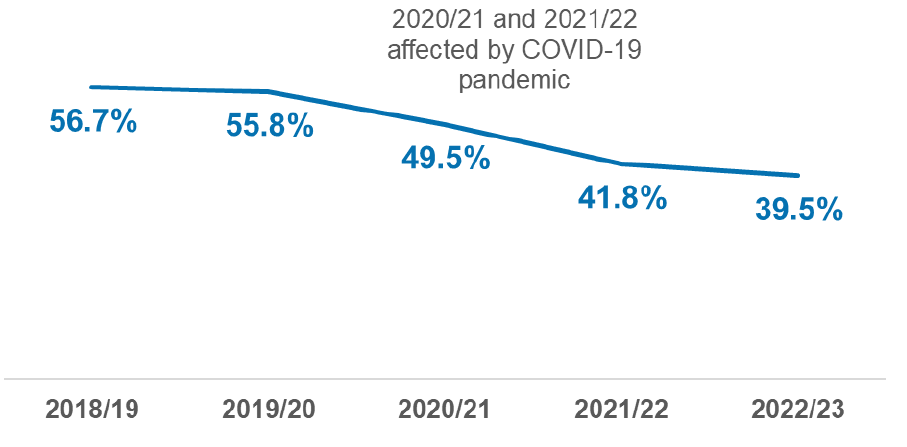
The number of local business and industry applications was 1,506 in 2022/23, slightly higher than 1,394 in the pre-pandemic year 2019/20. Average decision times for those applications not subject to processing agreements have been rising since 2018/19 from 9.1 weeks to 12.4 weeks in 2022/23. The percentage decided within two months has fallen since 2018/19 and was 54% in 2022/23.
246 local business and industry applications with processing agreements were determined. Almost three quarters (73%) of these met agreed timescales that had been set between developers and local authorities.
2.4. Local Applications by Development Type
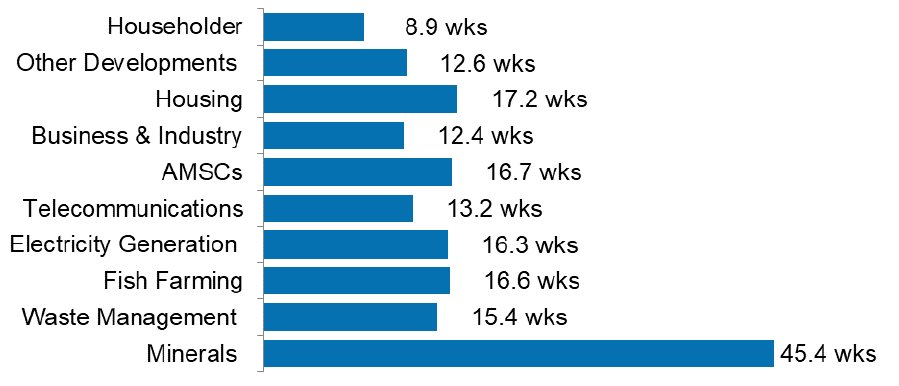
More than half (53%) of all local applications without processing agreements were from householders making changes to their properties. These applications had the shortest average decision time of 8.9 weeks.
Contact
Email: planstats@gov.scot