Early learning and childcare funding: Primary 1 deferral pilot evaluation
Evaluation report for the deferral pilots 2021 to 2022 to inform the national roll-out of the additional year of early learning and childcare funding to eligible children who defer entry to Primary 1 from August 2023.
2. Impact on deferral rates
Summary
- There were increases in August-December deferrals in pilot areas. Increases were sharper in Year 2 areas.
- It is not possible to fully disentangle the impact of the pilot and the impact of wider contextual factors such as the Covid-19 pandemic and the influence of campaigns to raise the school starting age on deferral rates. Differing levels of deprivation across local authorities (which has historically influenced deferrals rates) should also be considered.
- There are indications in the data, however, that the new entitlement led to a slightly sharper increase in the uptake of August-December deferral, when compared with the figure for Scotland overall.
- There was no clear pattern to suggest the pilot had impacted January-February deferral rates.
- There will be a clearer picture when data is available for next few academic years.
This section examines deferral rates in the pilot areas and compares them with national data. The ten local authority areas piloting the funded entitlement provided data on the number of deferrals by birth month, for the past six years. The charts in this section show the average deferral rates across the pilot areas. However, the deferral rates for each pilot local authority are provided in Appendix 4.
National deferral rates and pilot areas
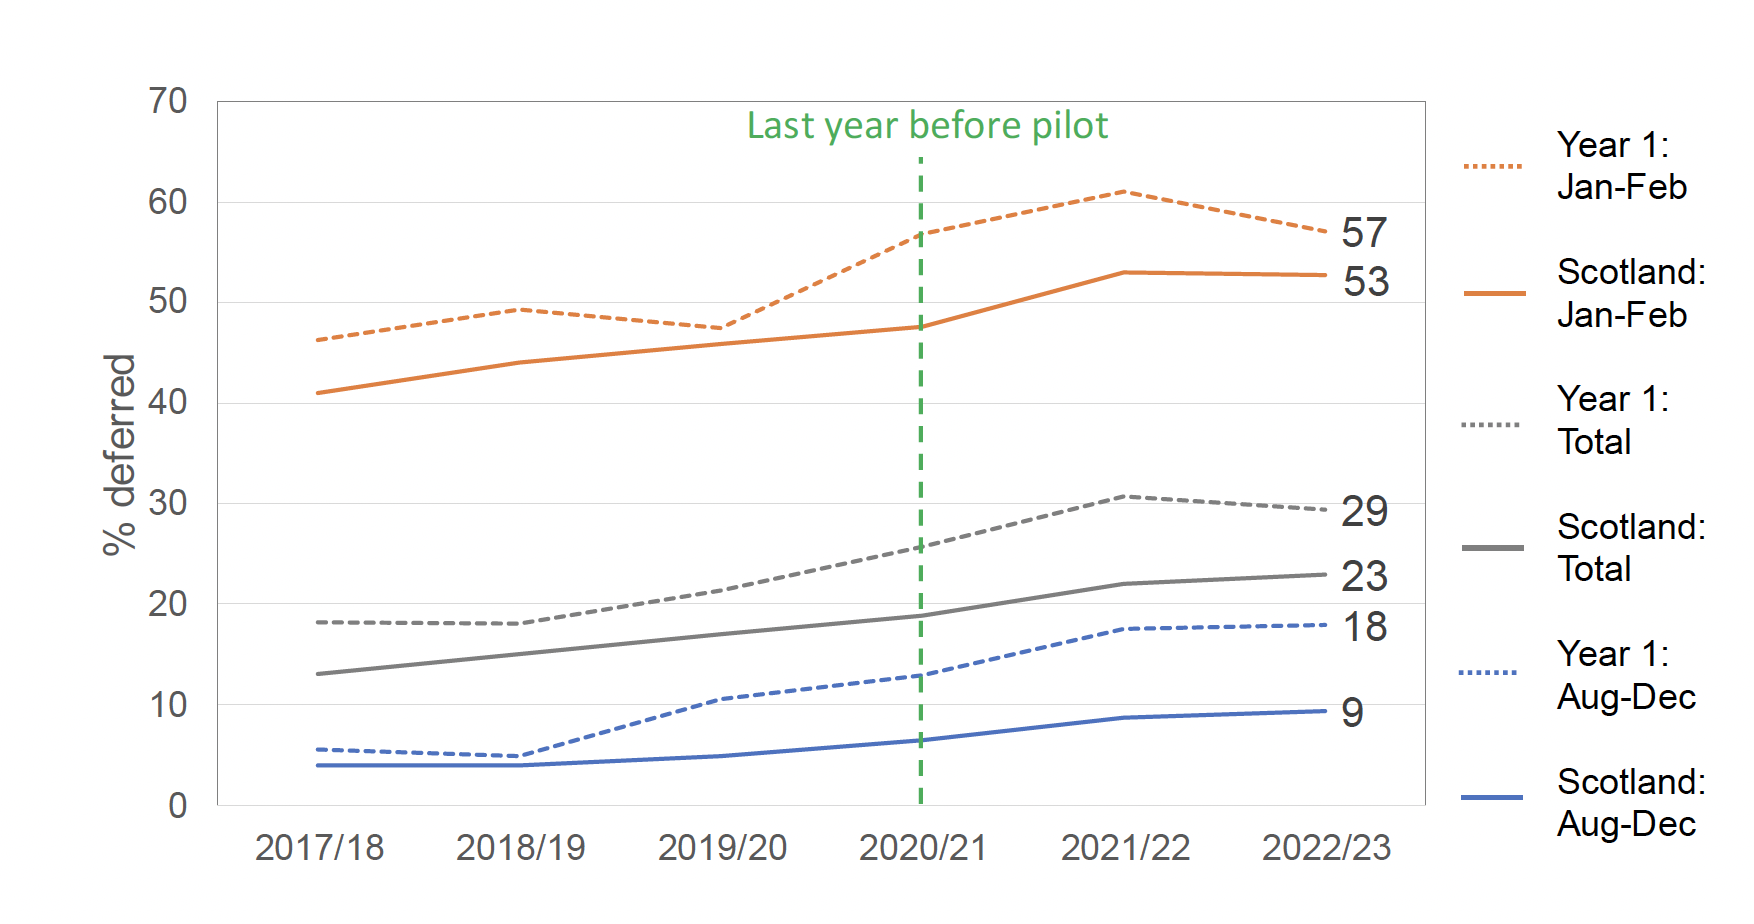
Figure 2.1 shows that there has been a general, gradual, increase in rates of deferral (for both January-February and August-December born children) in Scotland over the past five years, which includes the period before the pilots were introduced. The dotted lines show the average deferral rates of the Year 1 pilot areas, illustrating that Year 1 areas tended to have deferral rates that were higher than the national average prior to the pilot.
In the year after the pilot began, August-December deferrals increased by two percentage points nationally, from 7% to 9%. However, in Year 1 pilot areas, this increase was slightly steeper – four percentage points (from 13% in 2020/21 to 17% in 2021/22). While it is difficult to disentangle the impact of the wider contextual factors on uptake from the impact of the pilot (discussed later in this section), this suggests the pilot may be behind part of the moderate increase in uptake in Year 1 areas. However, given the number of children deferring in pilot areas is relatively small, this is an indicative finding.
In contrast, the rate of increase in January-February deferrals is almost identical when comparing the national rate to the Year 1 pilot areas (5 and 4 percentage point increases respectively in the year after the pilot began). The 2022/23 data shows the gap between Year 1 pilot areas and Scotland narrowing for January-February deferrals. It is too early to say whether January-February deferral rates will now remain stable, as we move further away from the pandemic. Figure 2.1 also illustrates that January-February rates have been much higher than August-December ones since 2017/18.
Year 2 uptake data suggests the pilot has also had an impact on uptake in these areas (Figure 2.2). Pilot areas closely followed national rates for August-December deferral from 2017/18 to 2021/22. However, a 10 percentage point increase took place after the pilot began (from 6% in 2021/22 to 16% in 2022/23), making Year 2 deferral rates since the pilot implementation seven percentage points higher than the national average.
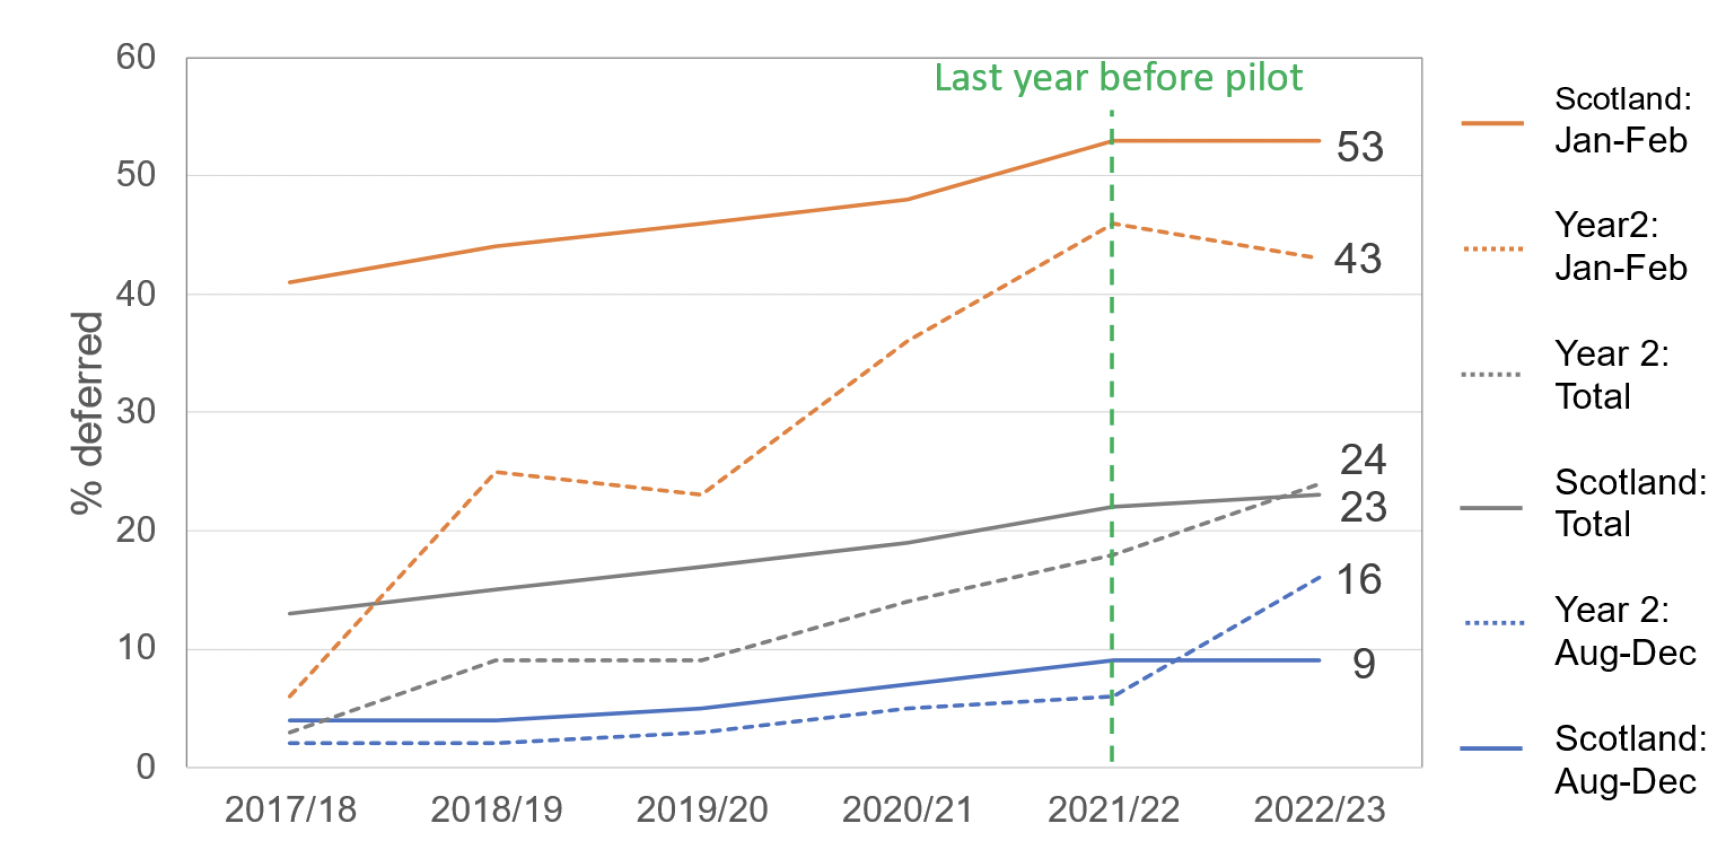
In terms of January-February deferral rates, the average deferral rate for Year 2 areas was comparatively low in 2017/8 and then increased sharply up until 2021/22, the last year before the pilot. It then decreased slightly following the introduction of the pilot. This pattern contrasts with Year 1 data (Figure 2.1) in which January-February deferral rates had been high for a number of years before the pilot. The difference may relate to levels of deprivation in the pilot areas, a point which will be discussed further below. Overall, there were no clear trends within the pilot local authorities to suggest that the pilot had influenced January-February deferral rates.
There is no clear connection between the size of the increase in August-December deferrals post pilot and the local authority's approach pre-pilot. This is more apparent in Year 2 areas. Clackmannanshire and Fife both saw steep increases but previously approved most requests, while Stirling saw a comparable increase post-pilot, but previously approved less than half of requests. This further suggests that the pilot itself has driven an increase in uptake.
Charts illustrating the breakdown of deferral rates for each pilot area (for January-February deferral and for August-December deferral) are in Appendix 4. These illustrate that there was variation in August-December deferral uptake across the pilot areas. Tracking this data over the next few years will provide a clearer picture of the impact the new entitlement has had. Nevertheless, current data suggests the pilot did drive the increase in August-December deferrals.
Deferral rates and child/household characteristics
The evaluation sought to explore any differences in uptake of the additional funded year in ELC by child/household characteristics. However, pilot local authorities were not able to provide comprehensive data on household characteristics (such as household income or SIMD quintile) of the children who had deferred since the introduction of the pilot).
To explore any patterns by SIMD, the analysis instead considered the deprivation profiles of local authorities, and what happened to deferral rates in each post pilot. Table 2.1 shows that, overall, Year 2 areas were more deprived, and some saw steeper increases in their deferral rates than Year 1 areas. However, in Year 1 and Year 2 areas, there appears to be a trend for the less deprived local authorities to have experienced the larger increases in their deferral rates (Aberdeen City and Shetland are exceptions to this). This suggests that the pilot may have had more of an impact in areas that are less deprived. This is a fairly rudimentary analysis using local authority rankings, and can therefore be only taken as indicative. It will be useful to track deferral rates by local authority, taking into account their overall rank according to SIMD, to explore any patterns by SIMD as the roll-out progresses.[9]
| Rank (1 = most deprived in Scotland, 32 = least deprived) | % point increase in year after pilot began | |
|---|---|---|
| Year 1 | 2020/21 | 2021/22 |
| Falkirk | 14 | 1 |
| Argyll | 18 | 4 |
| Angus | 21 | 9 |
| Scottish Borders | 27 | 6 |
| Shetland | 32 | -6 |
| Average % point increase | 4 | |
| Year 2 | 2021/22 | 2022/23 |
| Glasgow | 1 | 4 |
| Clackmannanshire | 8 | 10 |
| Fife | 12 | 15 |
| Aberdeen | 18 | 3 |
| Stirling | 20 | 16 |
| Average % point increase | 10 |
It has been possible to look at deferral by sex using data provided by pilot local authorities. Figure 2.3 compares national data with Year 1 and Year 2 pilot areas over three years. There is no clear trend suggesting the pilot has had an impact on the proportion of girls and boys deferring. Figure 2.3 shows the proportion of girls deferring has increased across Scotland slightly since 2019/20. While this increase is a little more pronounced in 2021/22 for Year 1 areas and in 2022/23 for Year 2 areas (the years immediately following the introduction of the pilot), the numbers involved are small and it is too early to draw any firm conclusions. Again, monitoring this over the next few years may make it clearer whether the expansion of the entitlement has any impact of differences by sex.
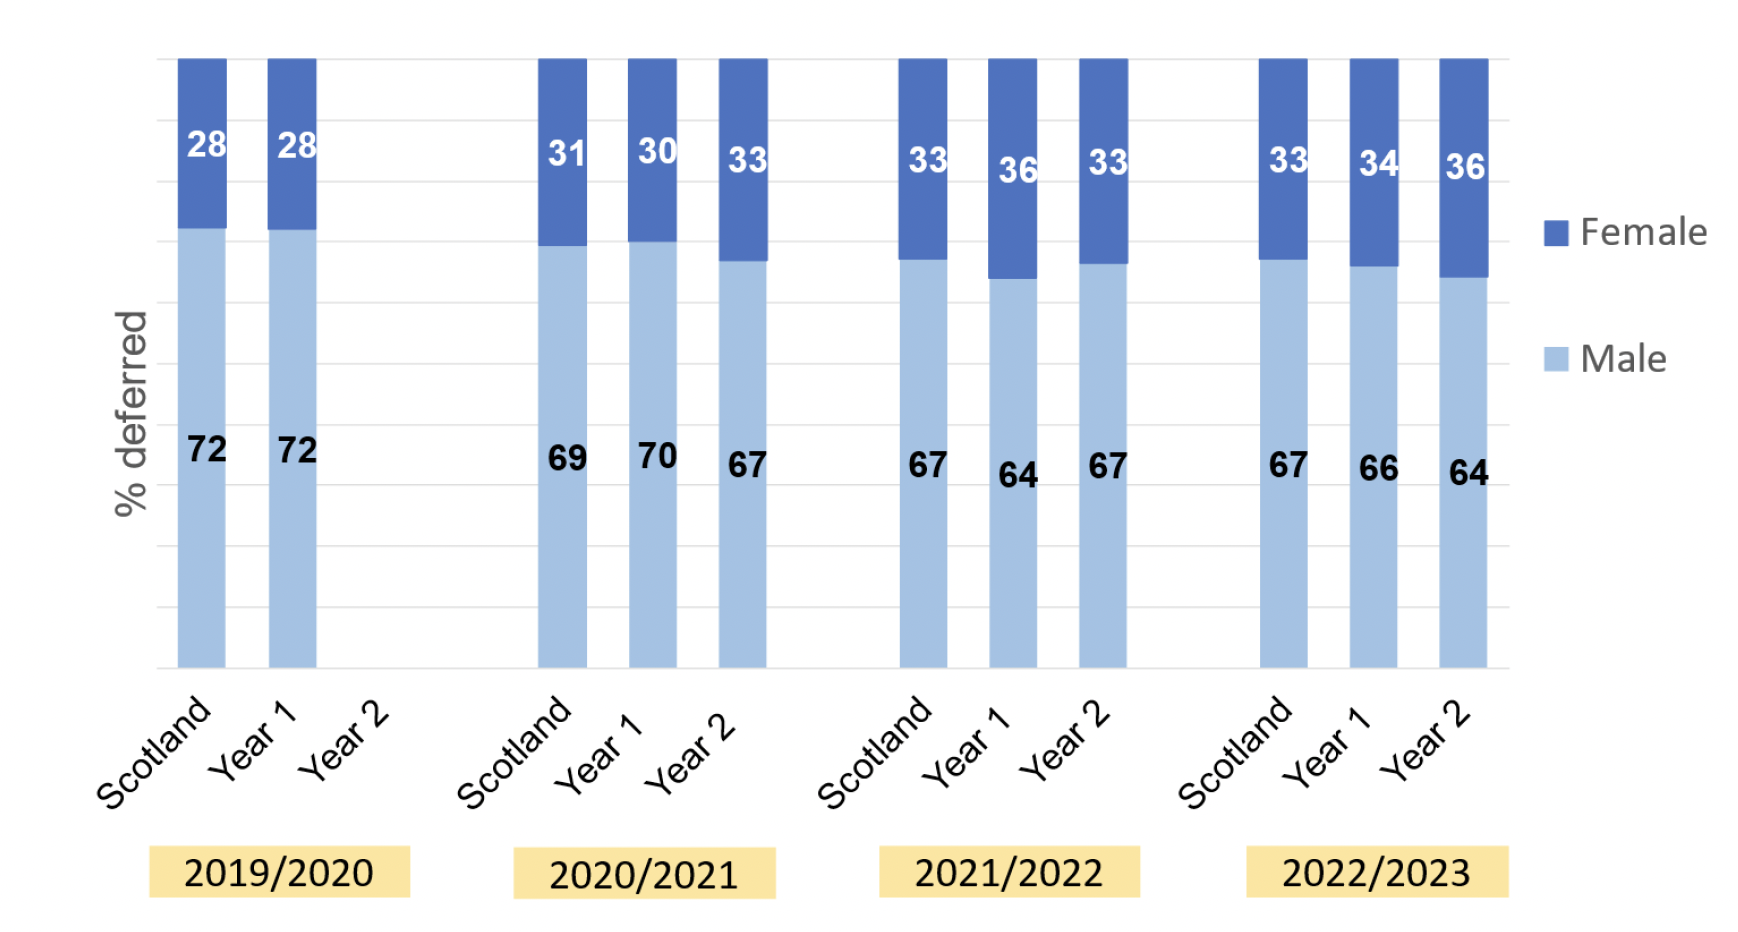
*Not all local authorities were able to provide data on deferral by sex for every year. 2021/22 'Year 1' data is from four pilot areas (instead of five). 2020/21 and 2021/22 'Year 2' data is also from four pilot areas (instead of five). Data was not available for Year 2 areas for 2019/20.
Contextual factors
When looking at the uptake data above, it is worth keeping in mind wider contextual factors which may have also influenced increases or stability in uptake levels. As mentioned in Chapter 1, the Covid-19 pandemic is perhaps the most obvious factor that may be driving deferral rates. Further contextual factors to consider include:
- national campaigns to increase the school starting age:[10] It is not clear how much of an influence these have had on increasing deferral rates. These campaigns were mentioned in some parent interviews (mainly as a source of information for those who already had an interest in deferral). Pilot leads perceived an increase in awareness of deferral generally and some felt the activities of organisations like Give Them Time and Upstart Scotland were contributing to this.
- pre-pilot policies on August-December deferrals: as mentioned above, while the uptake data did not show a clear connection between the size of the increase in August-December deferrals post pilot and the local authority's approach pre-pilot, it is still useful context.
- the historic variation in deferral rates according to levels of deprivation: January-February deferral rates have tended to have been higher in the least deprived areas of Scotland. This trend differs for August-December deferrals, where children in SIMD quintile 5 (the least deprived areas) have been less likely to be deferred than those in SIMD 1 (the most deprived areas).[11] Due to insufficient data, it has not been possible to explore whether the pilot has caused any changes in deferral rate trends relating to levels of deprivation.
Area for consideration:
Support local authorities to ensure they are able to gather data about household and child characteristics.
Track deferral rates by local authority, taking into account their overall rank according to SIMD, as the roll-out progresses.
Contact
Email: socialresearch@gov.scot