Early learning and childcare funding: Primary 1 deferral pilot evaluation

Evaluation report for the deferral pilots 2021 to 2022 to inform the national roll-out of the additional year of early learning and childcare funding to eligible children who defer entry to Primary 1 from August 2023.


Appendix 4: Additional deferral uptake data

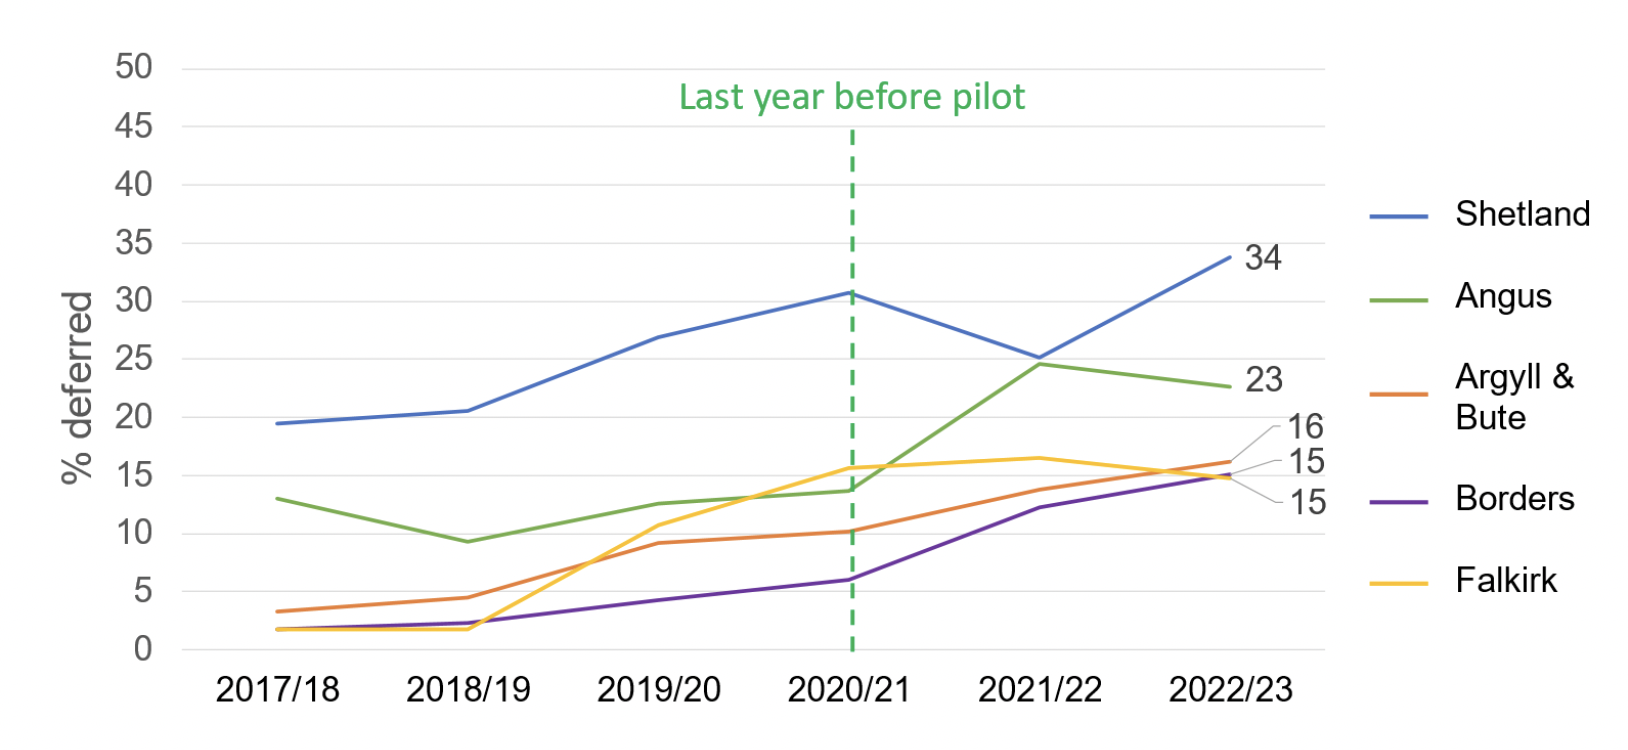
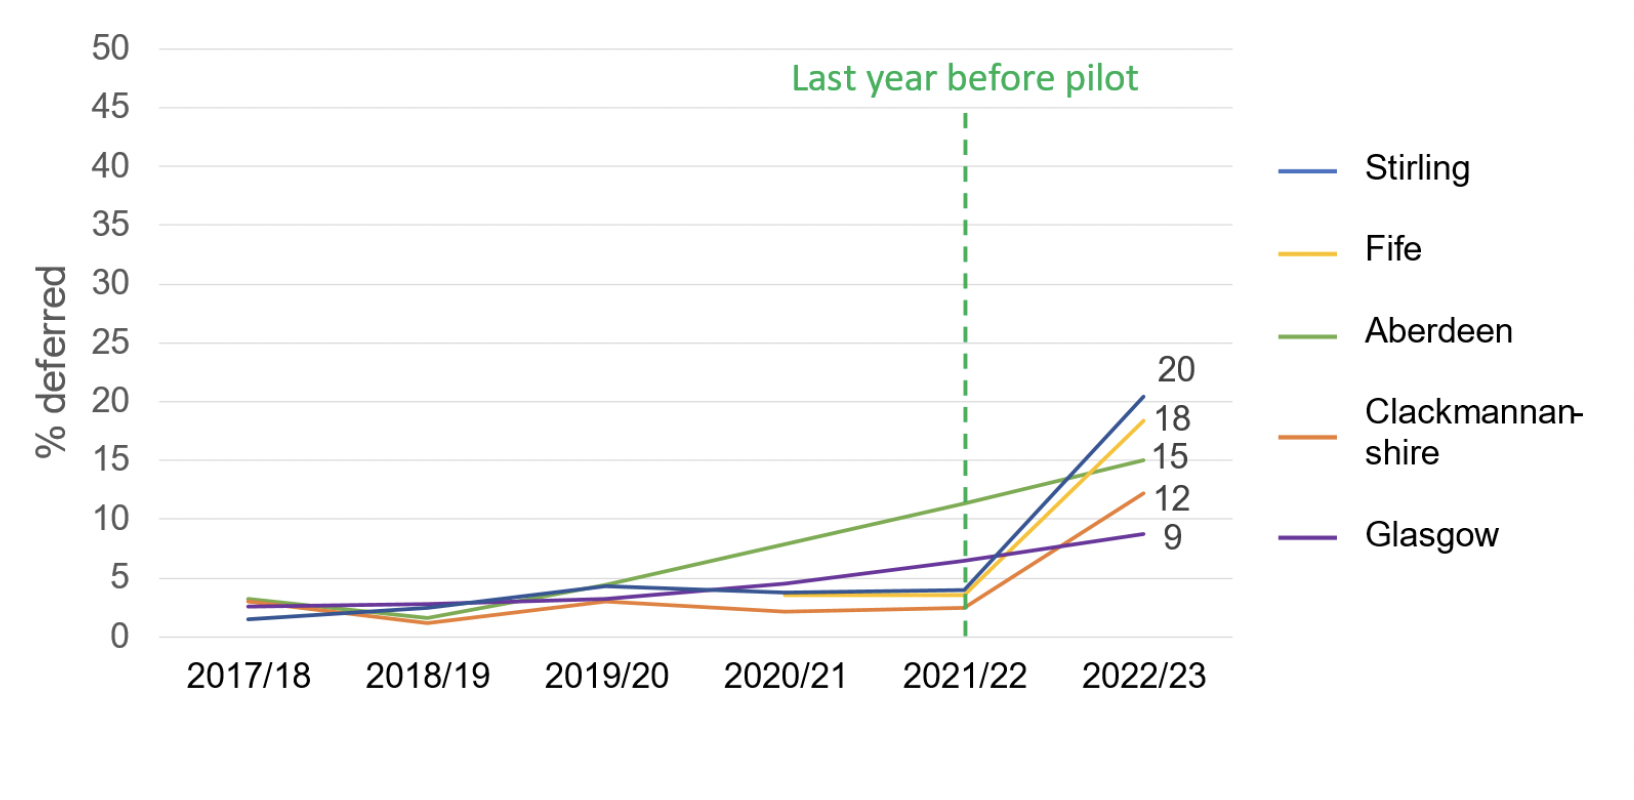
Deferral uptake by pilot local authority area

Figure i: Percentage of children deferred in Year 1 pilot areas (August-December birthdays)
Figure i is a line chart showing August-December deferral rates for 2017/18 to 2022/23. It compares data from Year 1 pilot areas which were Shetland, Angus, Argyll & Bute, Borders, and Falkirk. Overall, it shows some increases in the deferral rate in Year 1 areas since the pilot was implemented in 2020/21.
Figure ii: Percentage of children deferred in Year 2 pilot areas (August-December birthdays)
Figure ii is a line chart showing August-December deferral rates for 2017/18 to 2022/23. It compares Year 2 pilot areas which were Stirling, Fife, Aberdeen, Clackmannanshire, and Glasgow. Overall, it shows some sharp increases since the pilot was implemented for Stirling, Fife and Clackmannanshire. Glasgow and Aberdeen saw more gradual increases since before the pilot, and no steep increase once it began.
Figure iii: Percentage of children deferred in Year 1 pilot areas (January-February birthdays)
Figure iii is a line chart showing January-February deferral rates for 2017/18 to 2022/23. It compares data from Year 1 pilot areas which are Shetland, Angus, Argyll & Bute, Borders, and Falkirk. There are no clear trends shown in regard to the impact of the pilot. Shetland and Angus saw a small decrease in the year following the pilot, but saw an increase in deferral rates in the second year of the pilot. The Borders and Falkirk did see an increase after the pilot, but saw a decrease in the following year.
Figure iv: Percentage of children deferred in Year 2 pilot areas (January-February birthdays)
Figure iv is a line chart showing January-February deferral rates for 2017/18 to 2022/23. It compares data from Year 2 pilot areas which are Stirling, Fife, Aberdeen, Clackmannanshire, and Glasgow. There is no a clear overall trend. Some areas like Clackmannanshire and Glasgow saw a small decrease in the year following the pilot implementation in 2021/2022 while others experience no change.

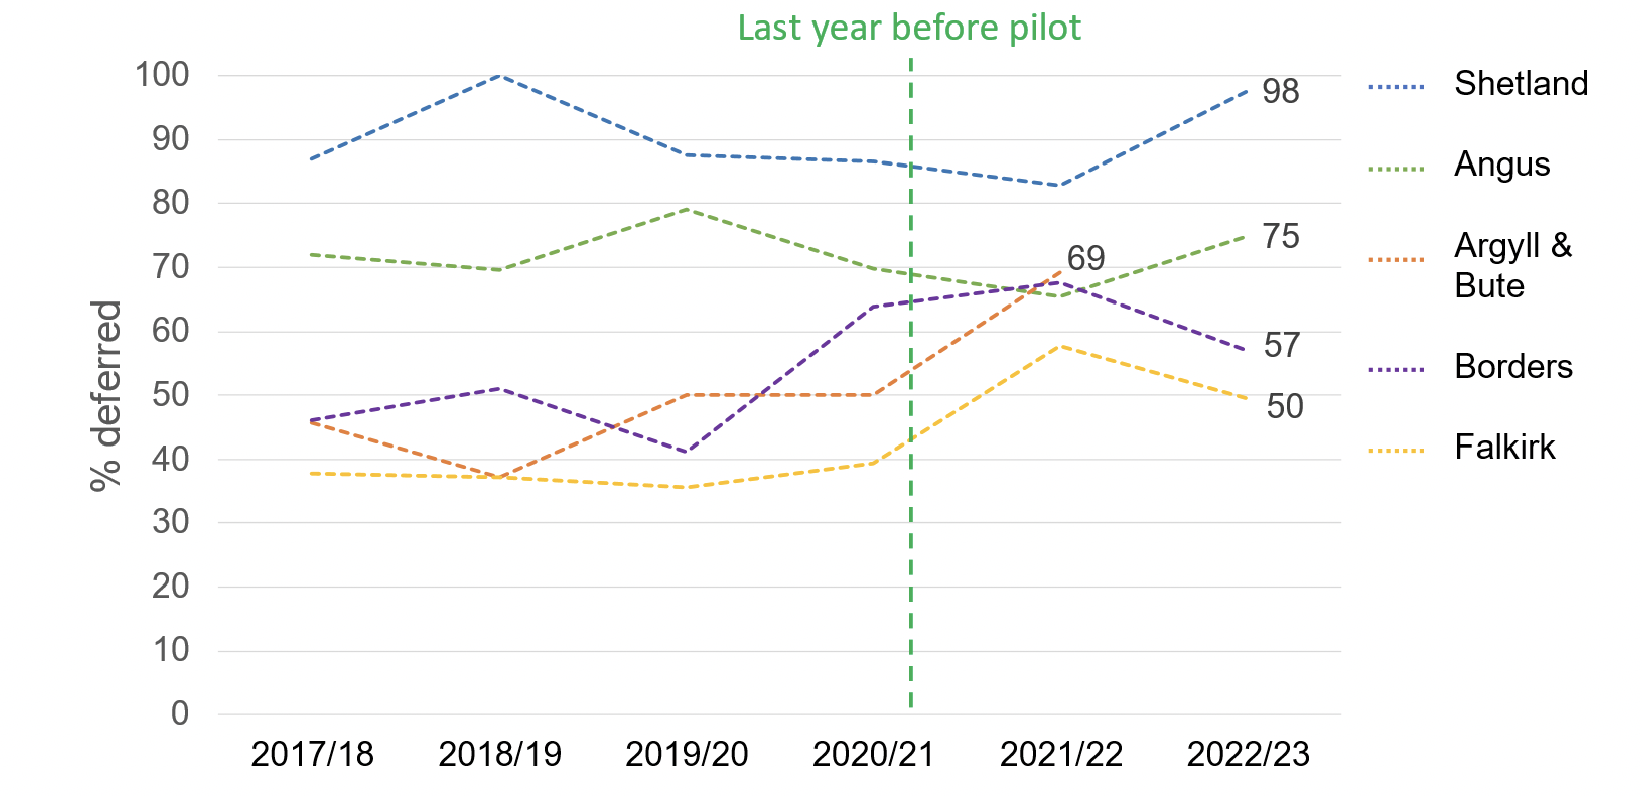
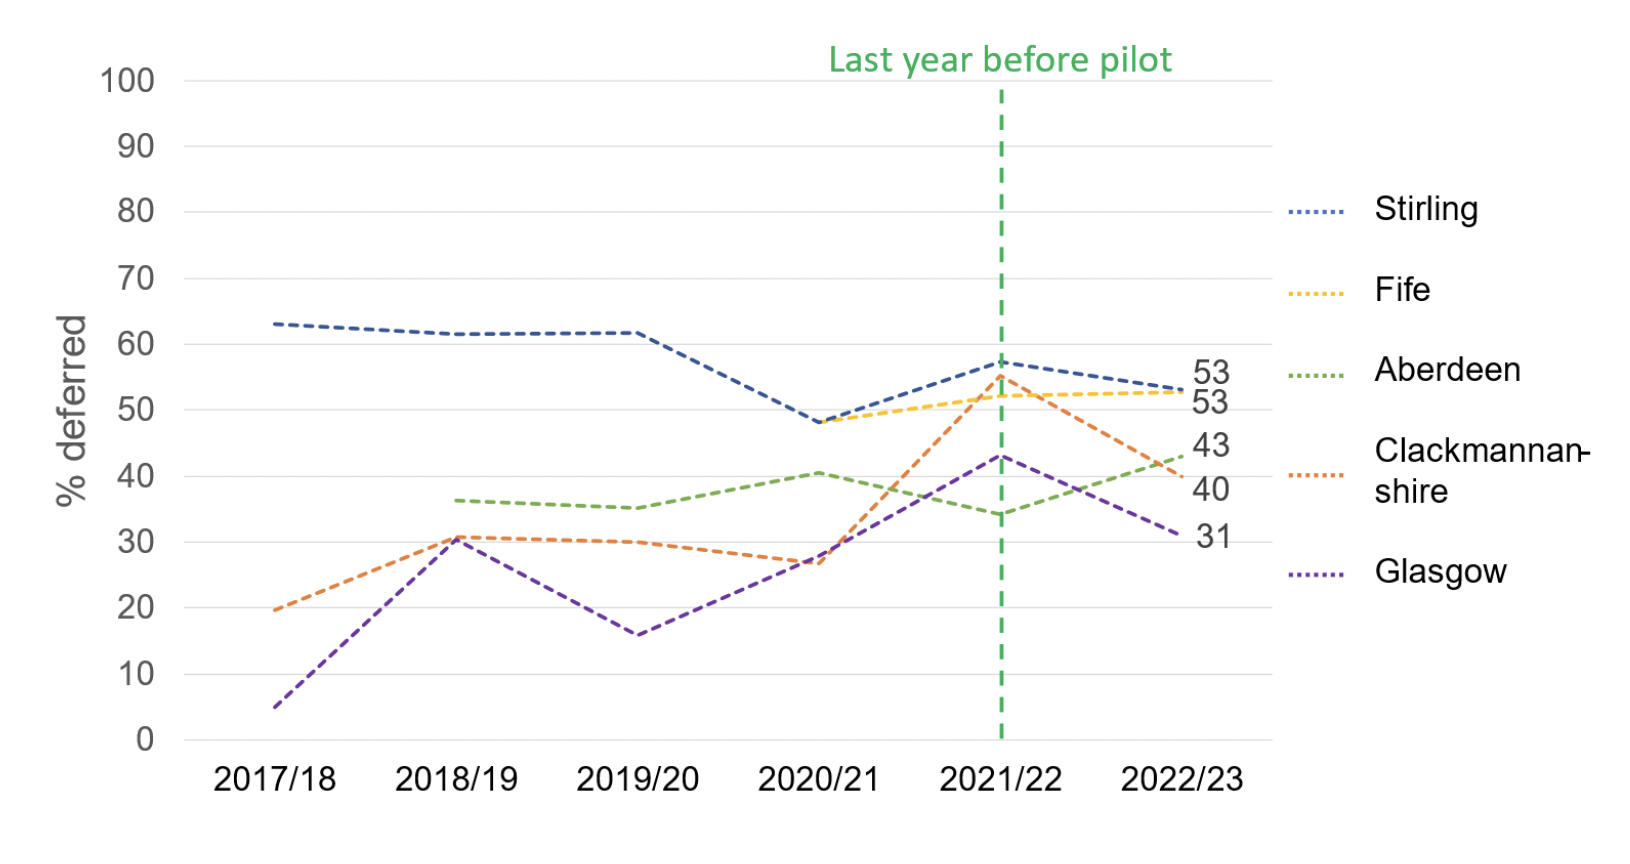
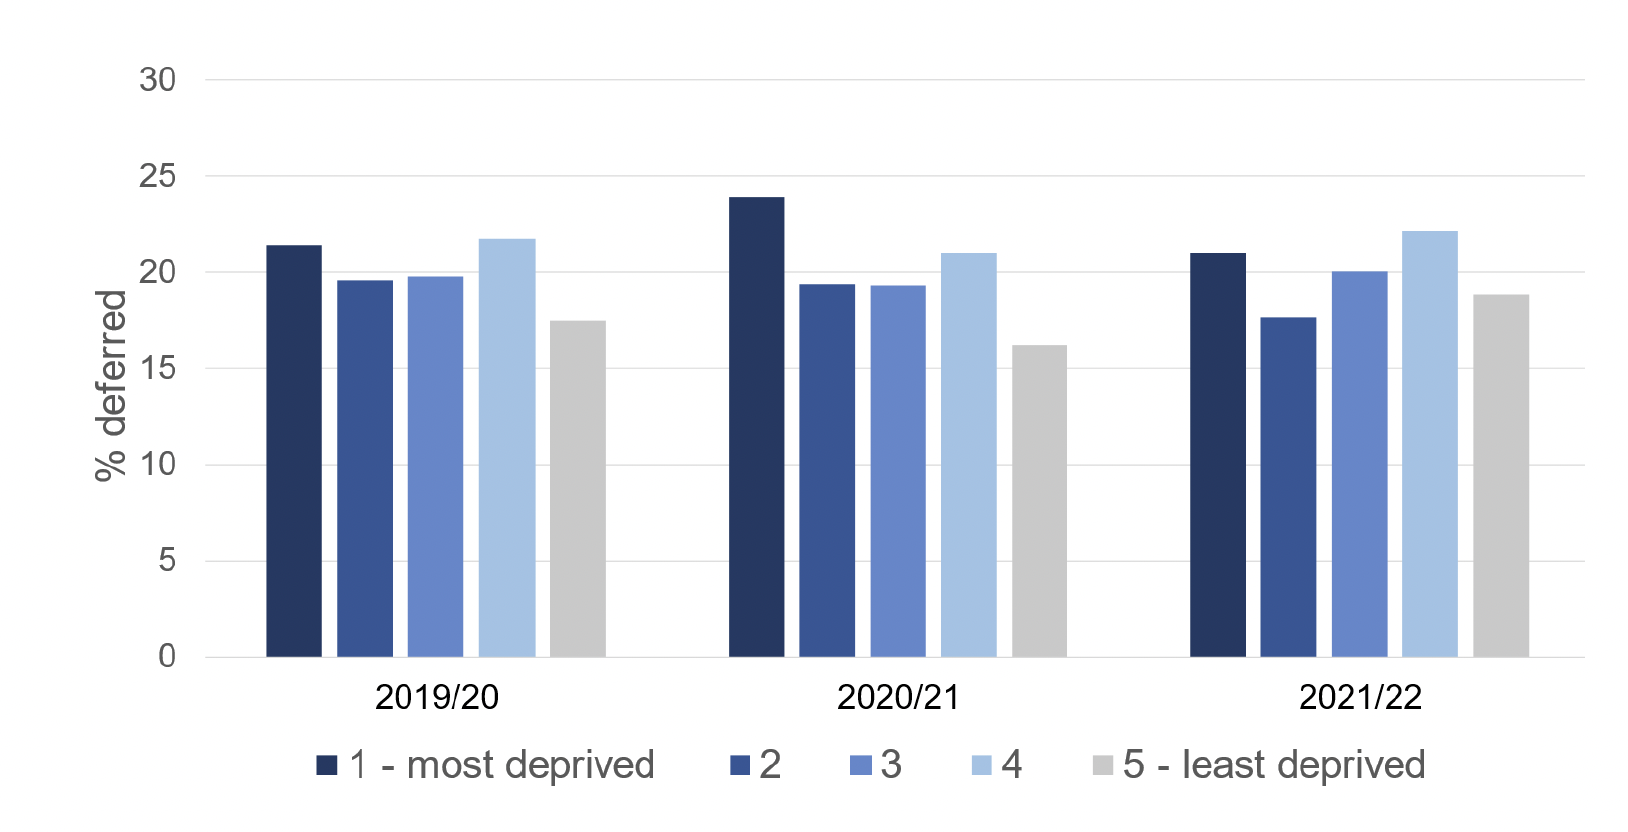
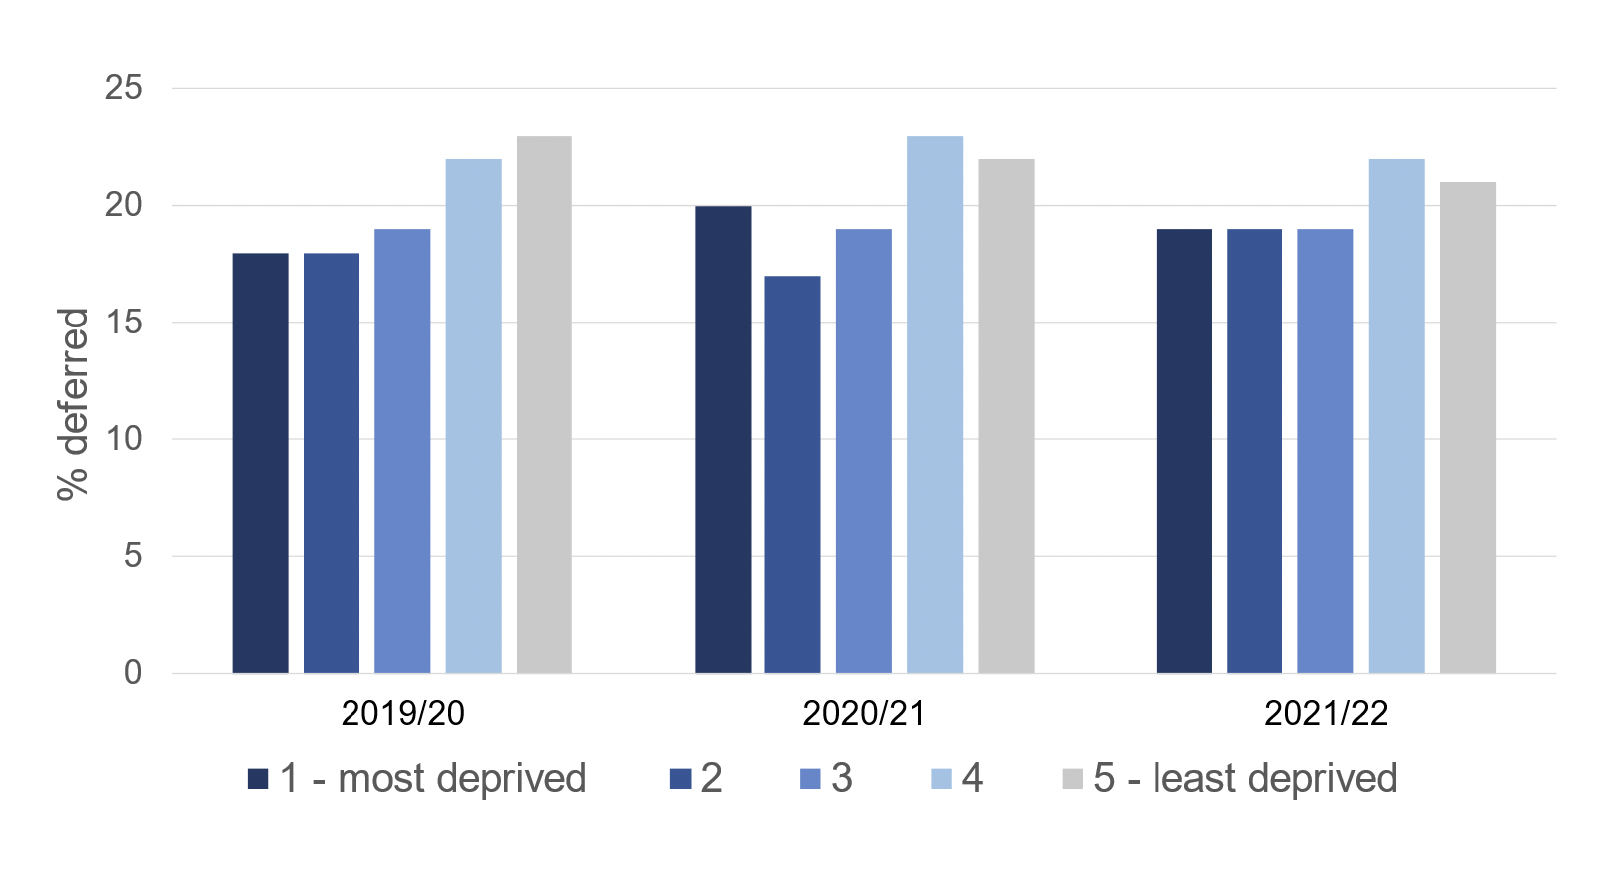
Deferral uptake by SIMD (Scotland wide data)

Figure v. August-December deferrals by deprivation ( SIMD quintile) - Scotland (%)
Figure v. is a bar chart of August-December deferral rates in Scotland from 2019/20 to 2021/22 according to local authority deprivation, SIMD quintiles. It shows August-December deferral rates have been high among those living in the most deprived quintile, quintile 1, and this increased in the first year of the pilot ,2020/21, but then dropped off again in the following year. This is national data and suggests that the pilot has not significantly changed the national picture. Local authority level data by SIMD quintile was not available.
Figure vi. January-February deferrals by deprivation ( SIMD quintile) - Scotland (%)
Figure vi is a bar chart of January-February deferral rates in Scotland from 2019/20 to 2021/22 according to local authority deprivation, SIMD quintiles. It shows that deferral rates were higher in the least deprived areas across all three academic years. Deferral rates remained fairly stable across time in all deprivation groups.

Contact

Email: socialresearch@gov.scot

Back to top