Pesticide Usage in Scotland: Local Authority Integrated Weed Control Survey - 2019
This publication presents information from a survey of weed control strategies used by Local Authorities in Scotland during 2019
Part of
Appendix 5 – Survey methodology
Sampling and data collection
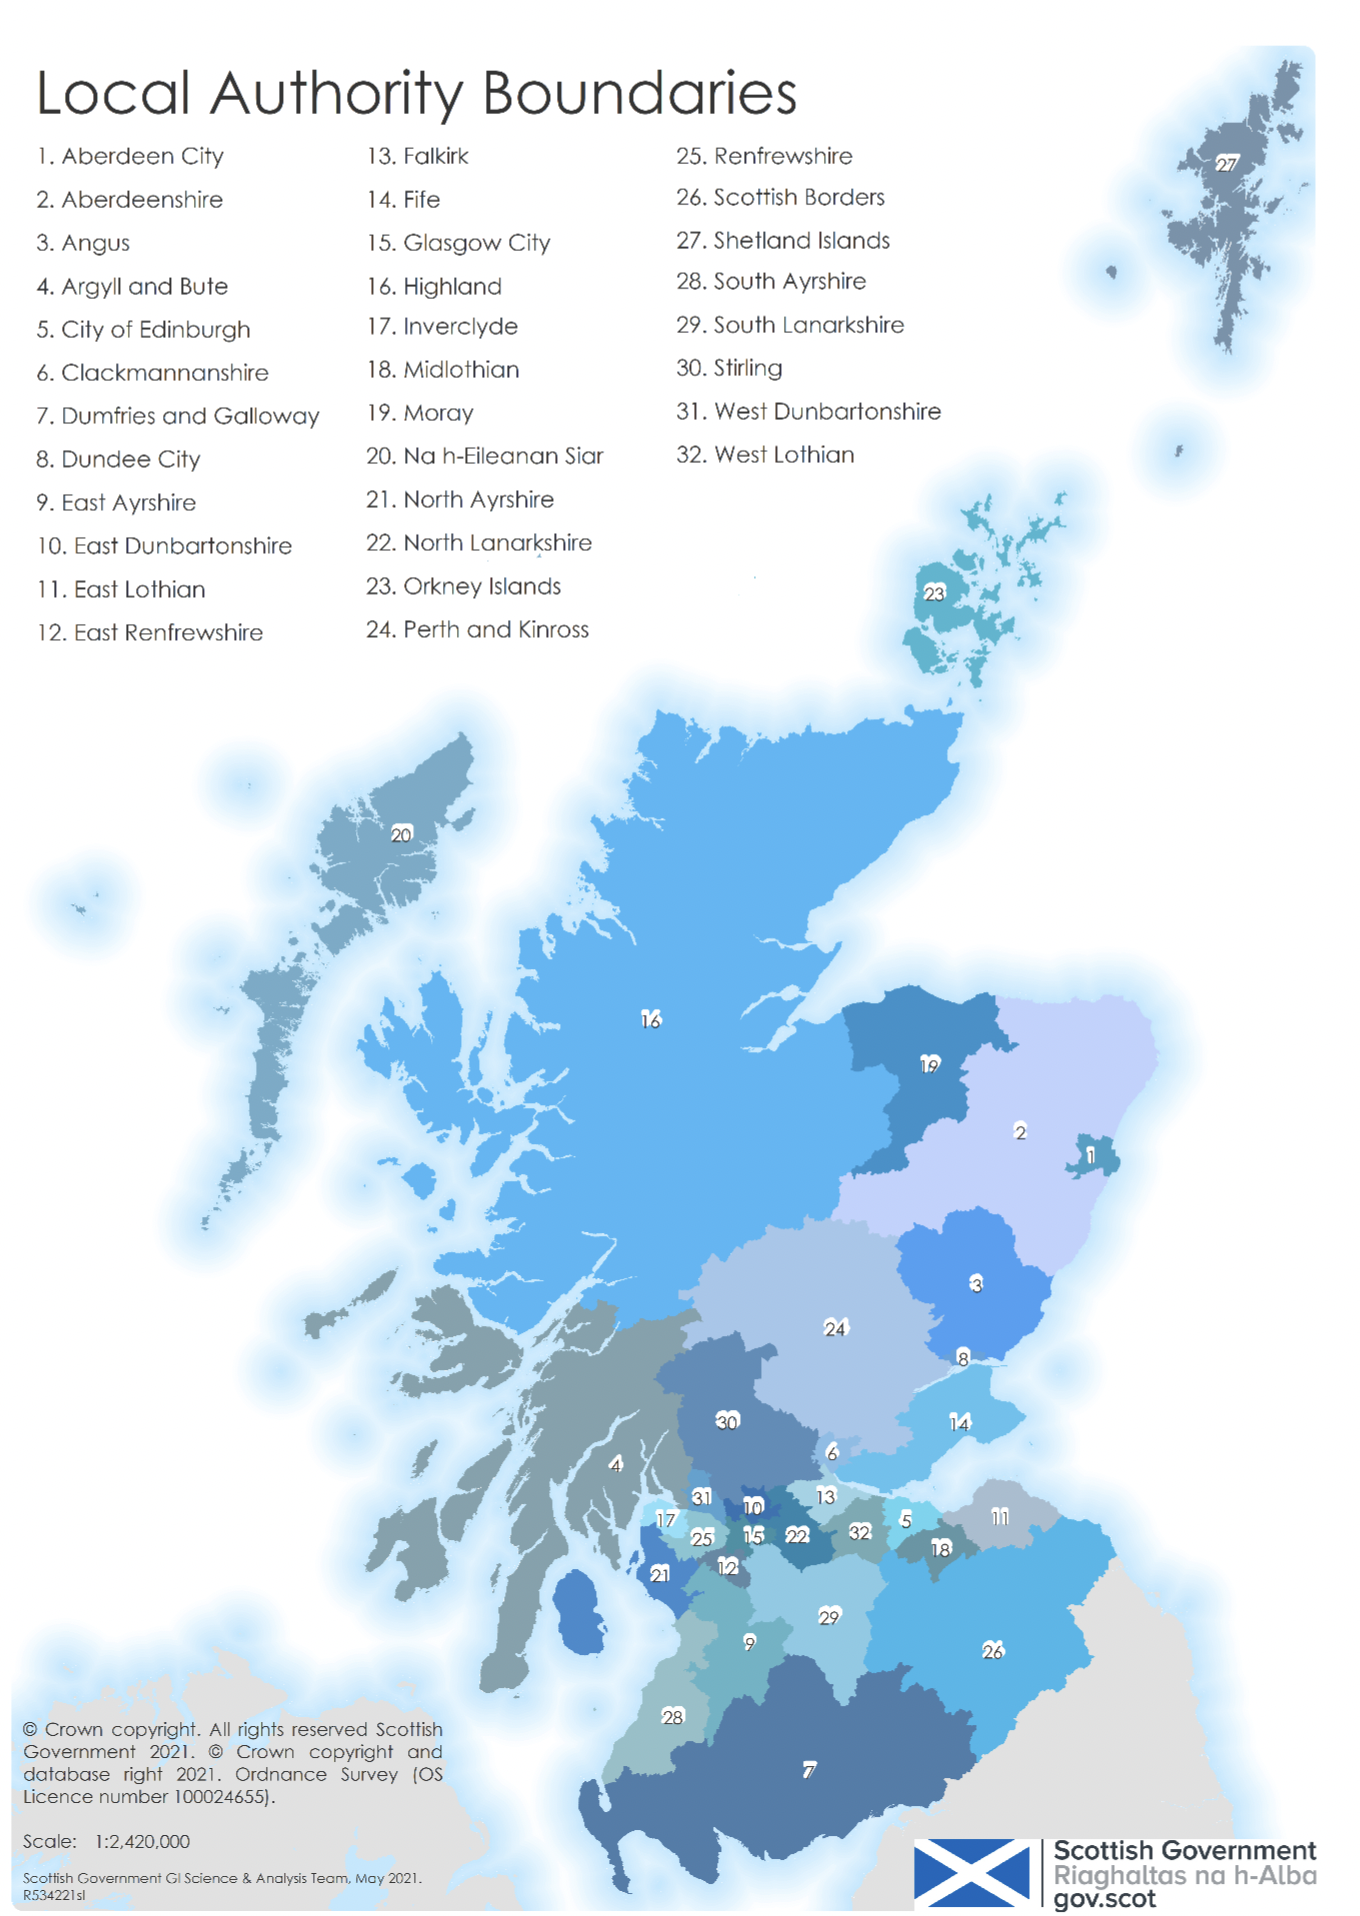
There are 32 local authorities in Scotland (Figure 11, Table 10). Each LA was emailed a survey questionnaire designed to collect information about weed control strategies used in 2019 (a copy of the survey questionnaire is available in Appendix 6). The survey was due to commence in March 2020 but was delayed due to the COVID-19 pandemic. Questionnaires were emailed in September 2020. Where data were not received, reminder emails were sent two months after survey initiation. Data collection was closed in January 2021.
The questionnaire consisted of two parts. The first was a qualitative section consisting of questions about integrated weed management practices, including weed prevention and non-herbicide methods of control. The second was a quantitative questionnaire to collect information about herbicide applications used by the LA during 2019.
The intention of this voluntary survey was to attempt to collect information from all Scottish LAs. Therefore, unlike the Scottish Government's agricultural pesticide usage surveys, no attempt has been made to produce a statistical estimate of total Scottish use from this sample. However, as the sample covers 88 per cent of Scottish LAs, it is considered to provide a robust overview of their integrated weed management practices.
The questionnaire was emailed to local authority staff who had responsibility for weed control. Weed control and/or integrated management is often the responsibility of more than one department. LA contacts were asked to share the questionnaire with the most appropriate person in each department to avoid gaining only partial information. Survey respondents were asked to describe their role within the organisation. Twenty-three indicated they organise and supervise those responsible for carrying out weed control operations. Thirteen respondents were also involved in drawing up tenders and agreements for those responsible for weed control, four stated they organise, supervise and get involved with weed control and finally one said they were responsible for carrying out weed control operations. Three respondents did not provide any data about their role within their LA.
Statistical Methods
Statistical analysis was provided by Biomathematics and Statistics Scotland.
For a number of questions, respondents were presented with a list of possible options and were asked to rank them in terms of relevance for their operations (where "1" denoted the most relevant). If any respondent adopted an unlisted approach or reason, they were asked to state these in the "Other" box and give an associated rank.
Presented ranks were adjusted for any ties within each LA prior to statistical analysis. Unranked options were interpreted as being of no relevance to the respondent and hence ranked as of least importance. All unranked options were regarded as tied unless not cited by any LA at all, in which case they were excluded from calculation of ranks. The importance of assigning a rank (albeit a rank denoting least importance) to options unranked within individual LAs should be noted. If ranks were not assigned in such cases, then it would be possible for an approach to be ranked of high relevance simply because it was ranked of high relevance in the few occasions it was selected by respondents. In cases where respondents cited an approach in the "other" category but failed to rank it, it has been ranked of less relevance than all those ranked listed categories but above all the unranked listed categories. In cases where multiple respondents stated similar approaches in the "other" category, they have been combined into a new, additional, specified approach. Where amalgamation has not been possible, they have simply been classified as "other".
As an example, consider a scenario with five approaches listed and in which a respondent ranked two approaches as "1", one approach as "2" and did not rank the remaining two approaches. The two approaches ranked "1" would be given a rank of 1.5 (sharing the average of 1 and 2). The approach ranked "2" on the form would be ranked "3" behind the two ranked above it. The two unranked options would be ranked 4.5 (sharing the average of ranks 4 and 5).
For each of these questions the mean ranks for each category have been computed as summary statistics. Irrespective of size, the responses from each local authority have been given equal weighting (i.e. treated as of equal importance).
For the one local authority supplying three questionnaires the same ranking methodology has been applied to each questionnaire and then the mean over the three questionnaires has been used to represent that local authority. For the two local authorities that restricted their answers to green spaces, it has been assumed that they would have given similar answers if they had covered all areas of use in their response.
In contrast, in one question (factors influencing decision to use herbicide rather than non-herbicide alternatives) respondents were asked how strongly a series of factors influenced their decision making on a (1 to 5) scale (1 equals little influence and 5 equals strong influence) rather than to rank the listed factors. The option was also given to record any other unlisted factors and provide a score. For this question the scores for each factor have been analysed separately. The scores are assumed to be on an interval scale. That is to say that each increment in the (1 to 5) scoring scale is assumed to correspond to a similar increase in influence. For any given respondent it is assumed they use the scoring scale in the same way for each factor. These two assumptions enable informal comparisons between factors of mean scores calculated across respondents to be meaningful. However, it is recognised that there are likely to be respondent-to-respondent differences in how each defines points on the (1 to 5) scale and therefore how it is used. What one respondent may regard as a fairly strong influence, another respondent may regard as a very strong influence.
Data quality assurance
The dataset underwent several validation processes as follows; (i) checking for any obvious errors upon data receipt (ii) checking and identifying inconsistencies with use and approval conditions once entered into the database (iii) 100 per cent checking of data held in the database against the raw data. Where inconsistencies were found these were checked against the records and with the LA if necessary. Additional quality assurance is provided by sending reports for independent review. In addition, the Scottish pesticide survey unit is accredited to ISO 9001:2015. All survey related processes are documented in Standard Operating Procedures (SOPs) and our output is audited against these SOPs by internal auditors annually and by external auditors every three years.
Main sources of bias
These surveys may be subject to measurement biasas they are reliant on respondents recording data accurately. As this survey is not compulsory it may also be subject to non-response bias, as some LAs could be more likely to respond to the survey than others.
Contact
Email: psu@sasa.gov.scot