Pesticide Usage in Scotland: Arable crops and Potato stores 2022
This publication presents information from a survey of pesticide use on Arable crops and Potato stores in Scotland during 2022.
Part of
Appendix 4 – Survey methodology
Sampling and data collection
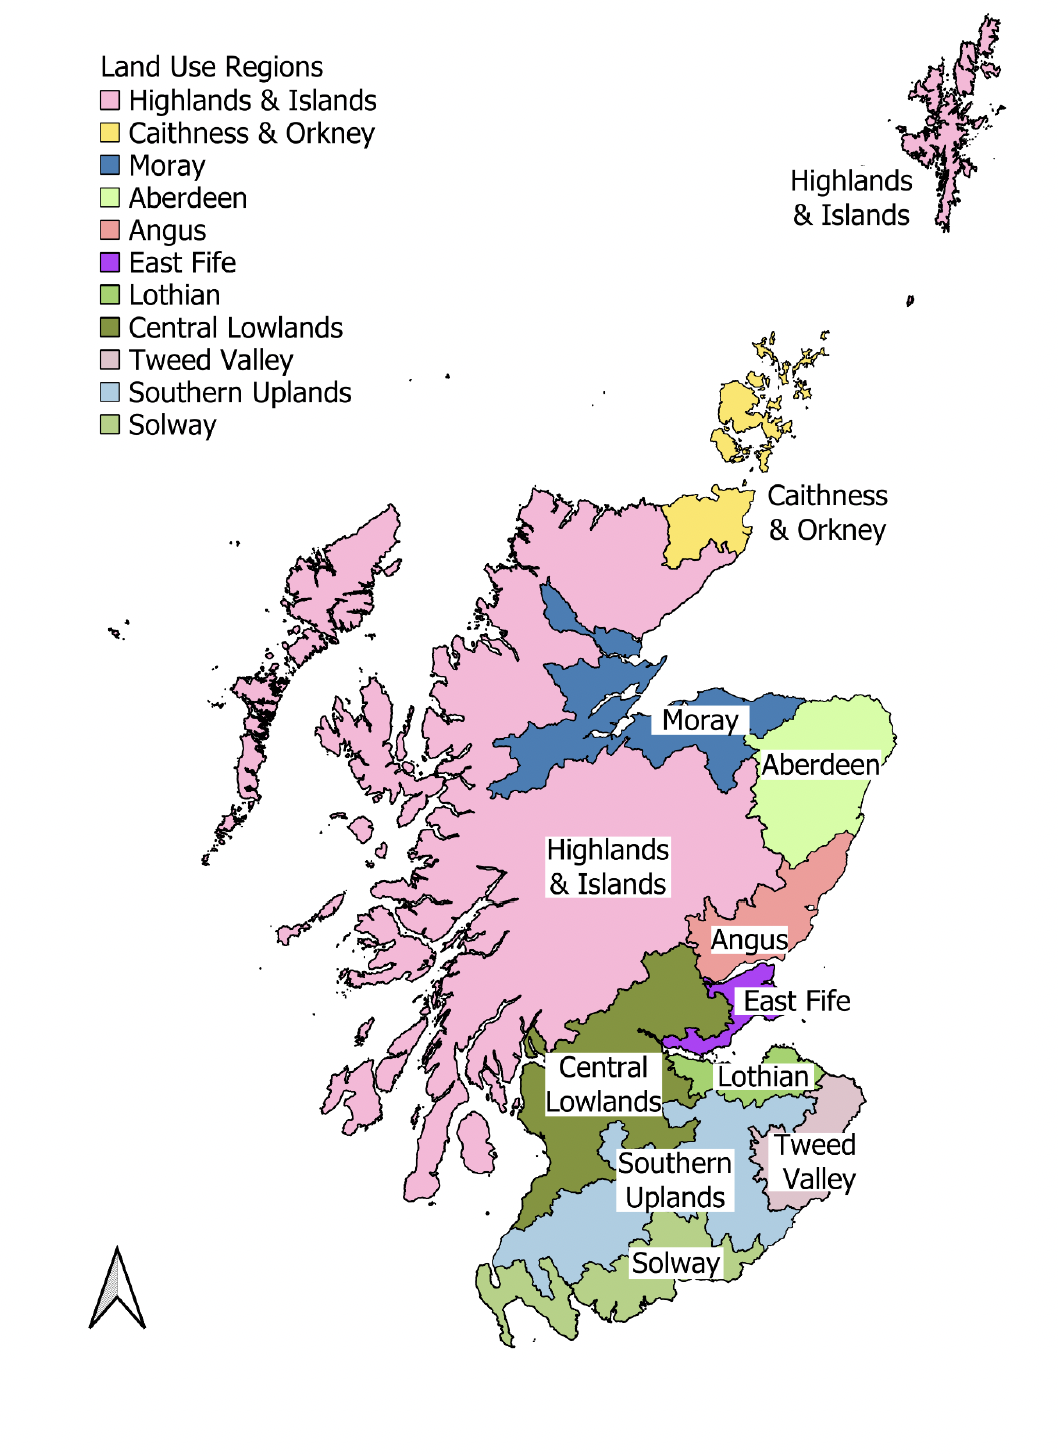
Using the May 2022 Single Application Form (SAF) data,a sample was drawn representing arable cultivation in Scotland. The country was divided into 11 land-use regions (Figure 31). Each sample was stratified by these land-use regions and according to holding size. The sampling fractions used within both regions and size groups were based on the areas of relevant crops grown rather than number of holdings, so that smaller holdings would not dominate the sample.
The survey covered pesticide applications to arable crops where all, or the majority, of the growing season was in 2022. As well as recording treatments applied directly to the crop, data was also collected on land preparation treatments prior to sowing or planting the crop.
Following an introductory letter and phone call, data were collected during a phone interview or by email. Where necessary, information was also collected from agronomists and contractors. In total, information was collected from 332 holdings growing arable crops (Table 26). These holdings represent eight per cent of the total crop area grown.
Raising factors
National pesticide use was estimated by ratio raising. This is a standard statistical technique for producing estimates from a sample. It is the same methodology used by the other UK survey teams and has been used for all historical datasets produced by the Pesticide Survey Unit, allowing comparability over time. The sample data were multiplied by raising factors (Tables 29). These factors were calculated by comparing the sample area to the areas recorded in the May 2022 SAF data within each region and size group (please see changes from previous years section for further detail). An adjustment (Table 29) was made for each crop within each region by applying the raising factors to the sample area of each crop grown and comparing this with the SAF area. This adjustment modifies the estimate to take into account differences in composition of crops encountered in the sample and those present in the population. A second adjustment was necessary for some crops which were present in the population but were not encountered in the sample in some strata.
Changes from previous years
There are changes which should be noted when comparing the 2022 data with the previous survey.
For previous reports, the June Agricultural Census was used to draw a sample of farmers growing the relevant crops to participate in the survey. National pesticide use was then estimated by ratio raising, by comparing the sample area to the areas recorded in the June Agricultural Census data.
To allow for the Agricultural Statistics Transformation Programme(18), the June 2022 Agricultural Census was paused. This pause was agreed with the Office for Statistical Regulation and data users.
For this report, the May 2022 Single Application Form (SAF) data was used to draw the sample and estimate national pesticide use using the same methodology as previous surveys. SAF data accounts for the majority of land area for arable crops. The sample drawn is based on area of crop grown, rather than number of holdings. As such, no attempt is made to account for holdings that are not captured by SAF returns. (Note: The difference in total Scottish arable area recorded between SAF 2022 and Agricultural Census 2021 was less than one per cent. The largest difference was biased towards the smaller size groups, less than five per cent of a difference).
Some data published in previous reports such as modes of action data, reasons for use and timing of application data have been excluded from the current survey due to resource and time constraints.
The 2020 report contained information about grower adoption of Integrated Pest Management (IPM). IPM data was not collected during the 2022 survey. It is anticipated that IPM data will be collected and published every 4 years. This allows IPM uptake to be monitored over time but reduces the burden on growers and surveyors.
Data quality assurance
The dataset underwent several validation processes as follows; (i) checking for any obvious errors upon data receipt (ii) checking and identifying inconsistencies with use and pesticide approval conditions once entered into the database (iii) checking of data held in the database against the raw data. Where inconsistencies are found these are checked against the records and with the grower if necessary. Additional quality assurance is provided by sending reports for review to members of the Working Party on Pesticide Usage Surveys and other agricultural experts. In addition, the Scottish Pesticide Survey Unit is accredited to ISO 9001:2015. All survey related processes are documented in Standard Operating Procedures (SOPs) and our output is audited against these SOPs by internal auditors annually and by external auditors every three years.
Main sources of bias
The use of a random stratified sample is an appropriate survey methodology. A stratified random sample, grouped by farm size and region, is used to select holdings used in this survey. Sampling within size groups is based on area rather than numbers of holdings, so that smaller size groups are not over-represented in the sample. The pesticide survey may be subject to measurement biasas it is reliant on farmers/growers recording data accurately. As this survey is not compulsory it may also subject to non-response bias, as growers on certain farm/holding types may be more likely to respond to the survey than others. Reserve lists of holdings are held for each stratum to allow non-responding holdings to be replaced with similar holdings.
Experience indicates that stratified random sampling, including reserves, coupled with personal interview technique, delivers the highest quality data and minimises non-response bias.
Contact
Email: psu@sasa.gov.scot