Partnership Action for Continuing Employment: client experience survey 2022
Research into the experiences of clients receiving redundancy support services through Partnership Action for Continuing Employment (PACE). This research is the seventh iteration of research assessing client experiences of PACE.
Appendix A: Methodology
6.11 The 2022 Client Experience research incorporated two strands:
- A telephone survey of 852 new clients who have accessed PACE services since January 2020; and
- A follow-up survey of 242 individuals who took part in the previous wave of research in March 2020 (after accessing PACE services in the period January 2018 to January 2020).
6.12 All interviews were conducted by IFF Research using Computer Aided Telephone Interviewing (CATI) software. Fieldwork took place in February and March 2022.
6.13 The outline methodology for each of these strands is described below with further details on the profile of people interviewed in each strand.
New client survey
6.14 The 2022 questionnaire largely maintained continuity with the previous versions. Some changes were made to the questionnaire, primarily to capture the impact of COVID-19 on access to, and satisfaction with services.
6.15 The main additions were questions covering:
- Awareness of PACE online and telephone services prior to accessing PACE services,
- The format of PACE services received (whether in person, online or telephone), and the client’s preferred format for services,
- Whether PACE online webinars or other pre-recorded content had been accessed and, if so, whether clients were satisfied with this content,
- Whether the client believed their redundancy was related to the COVID-19 pandemic,
- Whether any career changes (if applicable) were influenced by the COVID-19 pandemic; and
- Further detail on post-redundancy qualifications gained.
6.16 Past questions capturing whether participants had used support from other private sector companies, the location of training undertaken, whether training was full- or part-time, and the impact of PACE on elements such as motivation and interviewing skills were removed due to being less relevant to the research objectives and ensuring survey length met project guidelines.
6.17 Respondents from the survey came from a database of 4,231 PACE clients who were listed as having received PACE services in the period since January 2020. Contact was attempted with all of these individuals to invite them to take part in a telephone interview. No quotas were applied to control the profile of respondents, as the priority was to conduct a census of the available contacts.
6.18 A screener was applied which excluded from the survey anybody who had not left the job which was selected for redundancy. This was found to be the case in three per cent of the starting sample. Further details on the breakdown of call outcomes can be seen in Table 6.1.
6.19 Interviews were completed with a total of 852 PACE clients, representing 60% of cases where contact was made with the named respondent. The survey lasted an average of just under 21 minutes.
| Sample outcome | n | Proportion of starting sample | Proportion of cases where contact made with eligible respondent |
|---|---|---|---|
| Base | (4,231) | (4,231) | (1,496) |
| Ineligible or unavailable | |||
| Could not recall any PACE service | 532 | 13% | n/a |
| Still in job selected for redundancy | 148 | 3% | n/a |
| Not heard of PACE and not made redundant | 32 | 1% | n/a |
| Eligible person not contactable on supplied number(s) during fieldwork period | 2,022 | 48% | n/a |
| Refusals | |||
| Refused to participate | 397 | 9% | 27% |
| Not available in fieldwork period | 247 | 6% | 17% |
| Completed | |||
| Completed interview | 852 | 20% | 57% |
Profile of new PACE clients surveyed
6.20 Table 6.2 presents the demographic profile of clients taking part in the 2022 new client survey, both weighted and unweighted, and draws comparisons to the demographic profiles of new clients in the previous survey in 2020. The 2022 new client respondents accessed PACE services from January 2020 onwards.
6.21 The unweighted and weighted profiles in 2022 are broadly similar to the unweighted profile in 2020: the majority of clients were male, older and identified themselves as White British. However, as shown in Table 6.2, there are some slight profile differences, namely in gender, socio-economic class and age. These have been taken into account when comparisons are drawn between new client findings over time, and the report commentary highlights where significant differences occur between these sub-groups.
6.22 New to the 2022 survey, clients were also asked if they felt their redundancy was related to the COVID-19 pandemic. The majority (62%) felt it was, 37% felt it was not and 2% were unsure.
| All 2020 survey respondents (unweighted) | All 2022 survey respondents (unweighted) | All 2022 survey respondents (weighted) | |
|---|---|---|---|
| Base | (736) | (852) | (852) |
| % | % | % | |
| Gender | |||
| Male | 64 | 68 | 64 |
| Female | 34 | 30 | 30 |
| Prefer not to say / to self-describe | 2 | 2 | 6 |
| Age | |||
| 30 or under | 18 | 10 | 14 |
| 31-39 | 15 | 15 | 19 |
| 40 to 49 | 22 | 26 | 24 |
| 50 plus | 43 | 46 | 38 |
| Refused | 2 | - | - |
| Ethnicity | |||
| White British | 91 | 89 | 86 |
| Other ethnicity | 6 | 8 | 8 |
| Prefer not to say | 3 | 2 | 6 |
| Socio-economic group | |||
| A/B | 8 | 12 | 12 |
| C1 | 31 | 36 | 35 |
| C2 | 23 | 27 | 26 |
| D/E | 30 | 16 | 15 |
| Unknown / refused | 8 | 9 | 12 |
| Has disability | |||
| Yes* | 7 | 9 | 9 |
| No | 91 | 89 | 87 |
| Refused | 2 | 2 | 4 |
| Served in UK Armed Forces | |||
| Yes | 5 | 7 | 6 |
| No | 93 | 91 | 89 |
| Refused | 2 | 2 | 5 |
| Whether redundancy was related to the COVID-19 pandemic | |||
| Yes | Not asked in the 2020 survey | 61 | 62 |
| No | 38 | 37 | |
| Don’t know | 2 | 2 | |
*Question text was as follows: Do you have any long-term physical or mental impairment which limits your daily activities or the work you can do?
Note that figures may not sum to 100% due to rounding
6.23 Figure 6.1 shows the duration of contact clients had with the PACE service. Almost half (46%) of clients interacted with PACE services for less than one month, while a further 15% used the services for between one and two months, and 16% used it for three months or more. A small proportion (3%) were still receiving support at the time of survey.
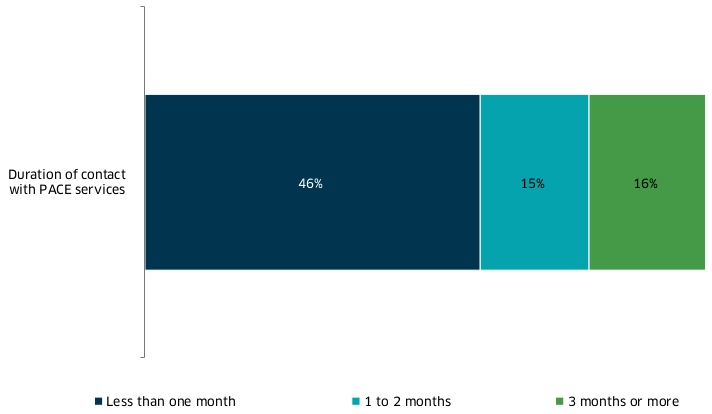
Base: All clients (582)
Note that 19% of clients did not know the date they first and last accessed PACE services and 3% were still accessng support therefore totals do not sum to 100%
Weighting approach
6.24 In a change from previous iterations of the survey, in order to ensure the representativeness of survey findings, weighting was applied to the new survey data in 2022.
6.25 The weights were informed by the profile of the underlying population of PACE clients accessing services between January 2020 and January 2022, in terms of gender, age and whether services were accessed before or after the first COVID-19 lockdown (March 2020).
6.26 Data on the underlying population was sourced from PACE client database and is presented in Table 6.3.
| Population count (n) | Proportion of total population (%) | |
|---|---|---|
| Base | (4,261) | |
| % | % | |
| Gender | ||
| Male | 2705 | 63.9 |
| Female | 1289 | 30.5 |
| Unknown | 237 | 5.6 |
| Age | ||
| 30 or under | 619 | 14.6 |
| 31-39 | 863 | 20.4 |
| 40 to 49 | 1071 | 25.3 |
| 50 plus | 1672 | 39.5 |
| Unknown | 6 | 0.1 |
| Pre- or post-lockdown | ||
| Pre-lockdown | 516 | 12.2 |
| Post-lockdown | 3715 | 87.8 |
| No | 82% | 99% |
Longitudinal survey
6.27 The longitudinal strand of the research followed up with the 458 PACE clients who had taken part in the ‘new client’ survey in 2020 and had agreed to be contacted for further research. A census approach was attempted leading to a total of 242 interviews completed. This is equivalent to interviews being undertaken with 82% of cases where contact was made with an eligible respondent. Details of the outcomes for the whole starting sample are shown in Table 6.4.
| n | Proportion of starting sample | Proportion of cases where contact made with eligible respondent | |
|---|---|---|---|
| Base | (458) | (458) | (294) |
| % | % | ||
| Ineligible or unavailable | |||
| Could not recall PACE service | 7 | 2% | n/a |
| Person not contactable on supplied number(s) during fieldwork period * | 157 | 34% | n/a |
| Refusals | |||
| Refused to participate | 50 | 11% | 17% |
| Not available in fieldwork period | 2 | <1% | 1% |
| Completed | |||
| Completed interview | 242 | 53% | 82% |
* In most cases this relates to circumstances where there was no answer on the supplied telephone number even after 13 attempts. In others, it was clear that the named respondent was no longer available on that number
6.28 The questionnaire for the 2022 longitudinal survey matched those used in previous iterations of the survey, collecting information on a range of labour market outcomes including:
- Whether the individual secured work after being made redundant, and after how long;
- Where the person secured paid work, whether this was at a higher or lower level of pay, responsibility and skills;
- Whether the individual had sustained employment with the same employer, or maintained successful self-employment; and
- Whether the individual engaged with any education and training since being made redundant.
6.29 A small number of questions were added to the 2022 survey, namely to capture whether respondents had been furloughed in the last two years and to capture more detail about qualifications and training undertaken.
Profile of PACE longitudinal clients surveyed
6.30 The longitudinal survey followed up with individuals who took part in the 2020 survey. Table 6.5 shows the profile by key factors for:
- All clients who were successfully followed up in the 2020 longitudinal survey (300 clients),
- All clients who were successfully followed up in the 2022 longitudinal survey (242 clients).
6.31 The profiles of the two samples are broadly similar, however in 2022 there was an increase in the proportion of female respondents. There was also a change in the social economic groups, with a reduction in the proportion of respondents in SEG A/B and C1, and an increase in the proportion of respondents in SEG C2 and D/E. There was also an increase in the proportion of respondents under the age of 40.
| All 2020 longitudinal survey respondents | All 2022 longitudinal survey respondents | |
|---|---|---|
| Base | 300 | 242 |
| % | % | |
| Gender | ||
| Male | 73 | 69 |
| Female | 27 | 31 |
| Age | ||
| Under 40 | 21 | 29 |
| 40 to 49 | 27 | 25 |
| 50 plus | 50 | 46 |
| Refused | 2 | - |
| Ethnicity | ||
| White British | 91 | 94 |
| Not White British | 7 | 5 |
| Prefer not to say | 2 | 1 |
| Social Economic Group | ||
| A/B | 16 | 9 |
| C1 | 41 | 33 |
| C2 | 18 | 24 |
| D/E | 19 | 31 |
| Unknown / refused | 7 | 4 |
| Has disability | ||
| Yes* | 10 | 7 |
| No | 89 | 91 |
| Refused | 1 | 2 |
*Question: Do you have any long-term physical or mental impairment which limits your daily activities or the work you can do?
Note that figures may not sum to 100% due to rounding
Contact
Email: margaret.sutor@gov.scot