Partnership Action for Continuing Employment: client experience survey 2022
Research into the experiences of clients receiving redundancy support services through Partnership Action for Continuing Employment (PACE). This research is the seventh iteration of research assessing client experiences of PACE.
3 Client views on PACE services
Chapter summary
This chapter looks at the proportion of clients that accessed different PACE services in 2022 and their views of these services in terms of satisfaction, relevance, and usefulness. It also investigates the perceived timeliness of the delivery of these services and the format in which they were delivered. The key findings of this chapter are outlined below:
There has been an increase in the proportion of clients aware of PACE services before using their services – from 22% with any awareness prior to redundancy in 2020 to 27% with prior awareness in 2022.
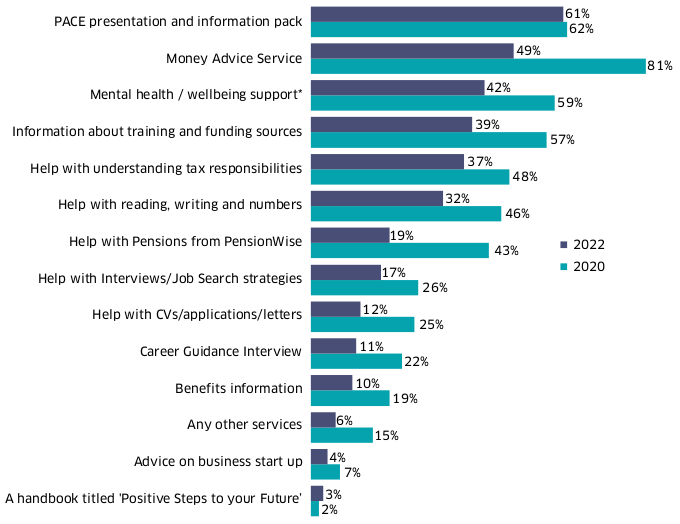
The most commonly accessed service was ‘information about training and funding sources’ (used by 61%). Around half (49%) said they accessed the PACE presentation and information pack, a significant drop from 81% in 2020, likely related to the COVID-19 pandemic and move to online delivery modes.
Levels of satisfaction have remained consistently high, and across all services the average satisfaction score was 86%, in line with 2020 (also 86%).
Clients recognised the value and relevance of some key services including support with CV-writing, applications and letter-writing, help with understanding tax, and mental health and wellbeing support.
Following the COVID-19 pandemic, there has been a shift in the format of the way PACE services have been delivered and clients have most commonly accessed services by phone and online. Around one in five (19%) clients who had used PACE services from 13th January 2021 had used PACE online webinars or pre-recorded content.
Roughly half of clients would prefer face-to-face service delivery (45% to 64% for each service). This was much more common among those aged 50 plus.
3.1 PACE supports its customers with a wide range of services, from careers guidance and assistance with job searches and different stages of a job application process, to information about how to cope with their redundancy, both financially (including information on access to benefits) and in terms of managing resulting stress.
3.2 The survey of new clients in 2022 measured the relevance and usefulness of each of the PACE services, as perceived by those that used them, and the satisfaction of clients regarding the services delivered to them.
3.3 This chapter presents the outcomes of these key performance indicators and examines the extent to which clients who accessed the different services felt they were being made available at the right time in their redundancy. It also investigates the preferred delivery format of services, whether this be face-to-face, online or by phone.
Awareness of PACE services prior to receiving support and use of other redundancy support services
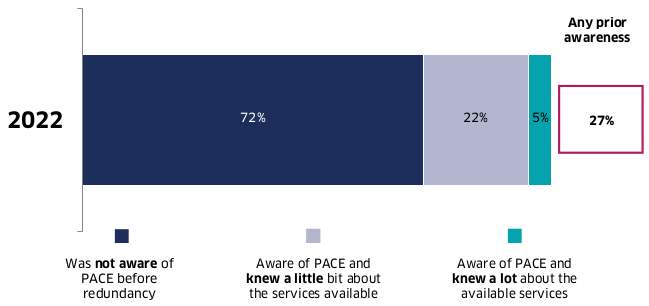
3.4 All clients were asked about their awareness of PACE services before redundancy. More than a quarter (27%) had prior awareness, including 5% who knew a lot about PACE and 22% who only knew a little about PACE. This represents an increase in awareness from 2020, in which just 22% of clients had any prior awareness. While there is no conclusive data on what is driving this additional awareness, this may be due to an increase in publicity. For example, among those aware of PACE prior to accessing services, a higher proportion said they became aware of PACE through advertising than in 2020 (14% compared to 5% in 2020). There has been a 7 percentage point reduction in the proportion of clients with no awareness of PACE services before their redundancy, from 79% in 2020 to 72% in 2022. Males were more likely than females to say they had any awareness of PACE services before being made redundant (30% compared to 23%).
Packages of PACE services accessed
3.5 In 2022, information about training and funding sources was the most accessed service (61%, in line with 62% in 2020).
3.6 Mirroring previous years, the other most commonly used services were the PACE presentation and information pack (49%), help with CVs, applications and letters (42%), benefits information (39%), career guidance interview (37%) and help with interview and job search strategies (32%). However, as shown in Figure 3.2, the proportion of clients accessing each of these had fallen significantly from 2020.
Base. All clients (852)
3.7 The biggest drop was in the proportion of clients accessing the PACE presentation and information pack (49% in 2022 compared to 81% in 2020). Access to this service dropped substantially following the March 2020 lockdown (accessed by 45% of post-lockdown clients compared to 77% pre-lockdown). This may be due to the move to online services, with clients less likely to watch a presentation online compared with attending when delivered in-person at the workplace.
3.8 Some differences could be seen by client gender. Males were more likely to access information about training and funding sources (65% compared to 55% of females), whereas females were more likely to have received help with interviews (40% compared to 29% of males) and accessed the ‘Positive Steps to your Future’ handbook (24% compared to 16%).
Base: All clients 2022 (852), 2020 (736)
*Code wording changed from ‘Help to cope with redundancy related stress’ in 2020 to ‘Mental health/ wellbeing support’ in 2022
3.9 Some differences could also be seen by age, with younger clients (those aged 40 or under) more likely to receive help from the Money Advice Service (23% compared to 17% overall), whereas those aged 50 and over were more likely to receive help with pensions from Pension Wise (21%, compared to just 5% in the 40-49 age bracket). Those under 30 were more likely to receive help with interviews (43% compared to 32% overall) and mental health / wellbeing support (17% compared to 10% overall).
Satisfaction with PACE services
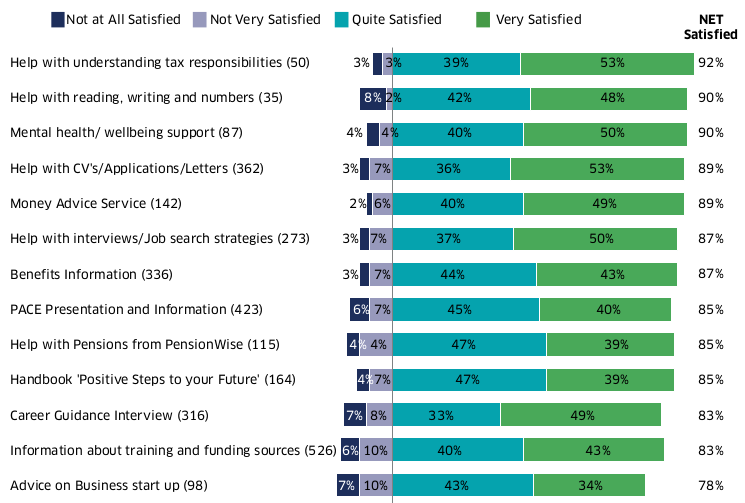
3.10 Levels of satisfaction with PACE services have remained consistently high since 2016. Across all services the average satisfaction score was 86% (combining the proportion of clients who were either ‘very satisfied’ or ‘quite satisfied’). This is in line with an average satisfaction score of 86% in 2020, 85% in 2018 and 84% in 2016.
3.11 As shown in Figure 3.3, satisfaction levels remained high across all services, ranging from 78% to 92% ‘quite’ or ‘very’ satisfied. The PACE services with the highest overall satisfaction levels in 2022 were: help with understanding tax responsibilities (92%); help with reading, writing and numbers (90%); and mental health / wellbeing support (90%). While a large majority were still satisfied overall with the advice they received on business start-up, this had the lowest satisfaction score of 78% potentially driven by its online delivery format (as discussed later in the chapter recipients of this service were most likely to have preferred a face-to-face delivery mode).
3.12 Clients were generally ‘very satisfied’ with the more practical forms of employment support, such as help with writing their CVs, applications, and letters (53%) and help with interviews or job search strategies (50%). However, this does represent a fall in the proportion very satisfied with these services compared to 2020 (63% and 60% respectively).
3.13 It is also notable that the proportion satisfied with the PACE presentation and Information pack has fallen by 5 percentage points from 90% in 2020 to 85% in 2022, returning to a similar level to 2018 (86%). This is an important satisfaction measure given that this is likely to be the client’s first point of contact with the PACE suite of resources.
3.14 Dissatisfaction with services was highest for the advice they received on business start-up (17%), information received about training and funding sources (16%), and the career guidance interview (15%) – similar to 14%, 13%, and 10% in 2020, respectively.
Base: All clients accessing each service: sample size for each row shown in chart
3.15 Some variation in satisfaction could be seen by delivery method. For example, those who received help with interviews and job search strategies face-to-face were more likely to be satisfied (98%) compared with those who received this help online (87%) or by phone (86%). However, face-to-face delivery format was not linked with higher satisfaction for all services.
Perceived relevance of PACE services
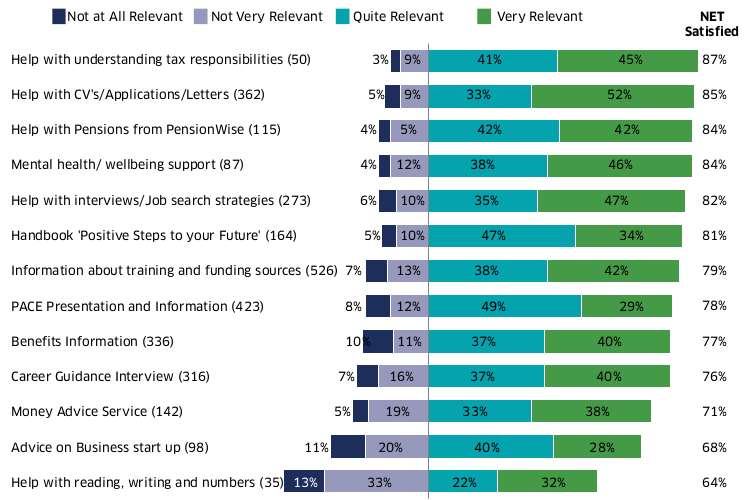
3.16 PACE services continue to be very relevant to those who use them: average levels of relevance have remained consistently high, with an average of 78% of clients across all services feeling that the services they had accessed were relevant. This is in line with the 78% reported in the 2020 survey and 79% in the 2018 and 2016 surveys.
3.17 Clients found help with understanding tax responsibilities to be the most relevant service (87% rating this as either ‘quite’ or ‘very’ relevant), followed by help with CVs, applications and letters (84%), help with pensions from Pension Wise (84%) and mental health/wellbeing support (84%).
3.18 By contrast, clients were least likely to think help with reading, writing and numbers was relevant (54%), in comparison to 51% in 2020. Again, in line with 2020, the proportion feeling that advice on starting a business was relevant remained lower than many other services (68% rating this as relevant; 64% in 2020), and around a third (31%) of clients who had accessed this support considered it either ‘not at all’ or ‘not very’ relevant.
3.19 Services providing practical advice for finding new employment continue to be the most likely to be rated as highly relevant. For example, the services most likely to be reported as ‘very relevant’ were help with CVs, applications and letters (52%) and help with interviews and job searches (47%). Following an increase in the proportion rating these services as very relevant in 2020, these 2022 findings reflect a return to scores seen in the 2018 (where 53% found help with CVs, applications and letters very relevant, and 47% found help with interviews and job searches very relevant).
3.20 Those who had secured work following their redundancy were more likely to feel that services had been relevant to them, most notably the PACE presentation and information pack (rated relevant by 81% who had secured work compared to 54% of those who had not yet), information about training and funding sources (80% compared to 66%) and benefits information (78% compared to 63%).
Base: All clients accessing each service: sample size for each row shown in chart
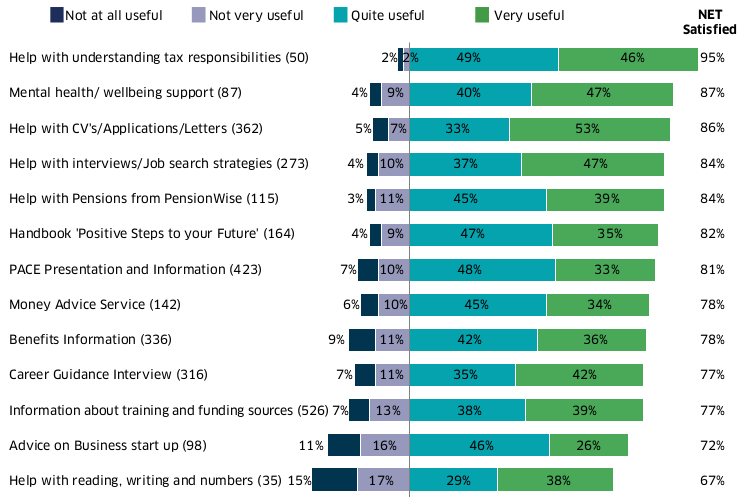
Perceived usefulness of PACE materials
3.21 Clients were also asked to reflect on the usefulness of the materials they received from each of the PACE services. As shown in Figure 3.5, the majority of PACE clients found the materials they received to be useful, with the average level of ‘usefulness’ (combining ‘very useful’ and ‘quite useful’ across all services) at 78%. This is in line with 79% in 2020 and 2018.
3.22 As well as being the most relevant service, clients also rated help with understanding tax responsibilities to be the most useful service (95% rated this as quite or very useful). Other services most commonly reported to be useful were mental health and wellbeing support (87%) and help with CVs, applications and letters (86%).
3.23 Around seven in ten or more rated each service useful, with the exception of help with reading, writing and numbers; a comparatively low proportion (67%) rated this useful, though this was an increase from 53% in 2020.
3.24 As with the findings in relation to relevance of services, the more practical materials with links to finding work were more commonly rated as ‘very useful’. Over half (53%) rated help with CVs, applications and letters as very useful (though this is a drop from 64% in 2020), as did 47% of those accessing help with interview and job searches (again a drop from 59% in 2020).
Base: All clients accessing each service: sample size for each row shown in chart
Client views on the timing of PACE services
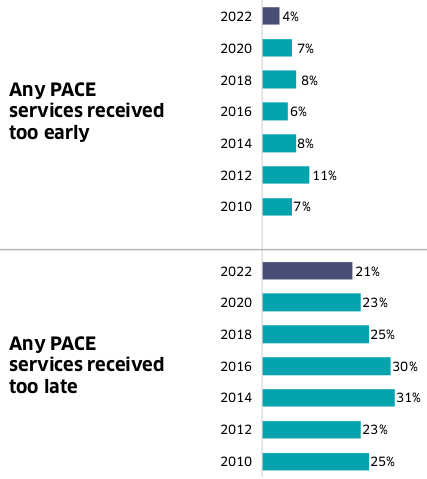
3.25 Another key indicator of satisfaction with PACE services is whether clients feel they were provided at the right stage of their redundancy. Clients were asked whether they felt support was offered too early, too late, at around the right time, or at the perfect time for them.
3.26 In line with previous years, the majority of clients felt that services were offered at about, or exactly, the right time. Overall, just 4% reported that any PACE services were received too early (a fall from 7% in 2020, as shown in Figure 3.6). This is compared with 21% who reported any being received too late. Though not a statistically significant reduction from 2020, this is the lowest proportion of clients reporting receiving a service too late since measurement began in 2010 and a significant reduction from 31% in 2014, 30% in 2016 and 25% in 2018.
3.27 Table 3.1 below details clients’ views on the timing of delivery for each individual service received. Almost all (96%) of clients receiving help with reading writing and numbers felt this was offered at a good timing (i.e. timing perfect or about right), as did 90% of those receiving help with understanding tax responsibilities.
3.28 Over 80% of clients felt timing was good for all other services offered, except for the PACE presentation and guide (78% felt timing was good) and information about training and funding sources (77% felt timing was good). Indeed, 17% and 16% respectively felt that the PACE presentation guide and information about training and funding sources were offered too late.
Base: All clients (2022 – 852); (2020 – 729; 2018 – 1,065; 2016 – 1,045; 2014 – 879; 2012 – 505; 2010 – 405)
| View on timing of service offer | ||||||||
|---|---|---|---|---|---|---|---|---|
| Base | Timing perfect | Timing about right | Too early | Too late | Don’t know/prefer not to say | NET: Good timing | ||
| Help with reading writing and numbers | (35) | % | 35 | 60 | 0 | 4 | 0 | 96 |
| Help with understanding tax responsibilities | (50) | % | 44 | 46 | 0 | 7 | 3 | 90 |
| Help with Pensions from Pension Wise | (115) | % | 34 | 53 | 4 | 8 | 2 | 87 |
| Money Advice Service | (142) | % | 39 | 46 | 1 | 10 | 3 | 85 |
| Mental health / wellbeing support | (87) | % | 40 | 45 | 1 | 12 | 2 | 85 |
| Help with interviews and job search strategies | (274) | % | 38 | 47 | 1 | 10 | 4 | 85 |
| Help with CVs, applications and letters | (362) | % | 38 | 46 | 1 | 12 | 3 | 84 |
| Career Guidance Interview | (316) | % | 35 | 48 | 3 | 11 | 4 | 83 |
| Handbook titled ‘Positive Steps to your Future’ | (164) | % | 35 | 47 | 2 | 11 | 5 | 83 |
| Advice on Business Start-up | (98) | % | 23 | 58 | 4 | 9 | 7 | 81 |
| Benefits Information | (336) | % | 30 | 52 | 1 | 14 | 4 | 81 |
| PACE Presentation and Guide | (423) | % | 28 | 50 | 2 | 17 | 2 | 78 |
| Information about training and funding sources | (526) | % | 31 | 46 | 2 | 16 | 5 | 77 |
Base: All who have accessed each PACE service (as shown for each row) Note: Data is shown as row percentages
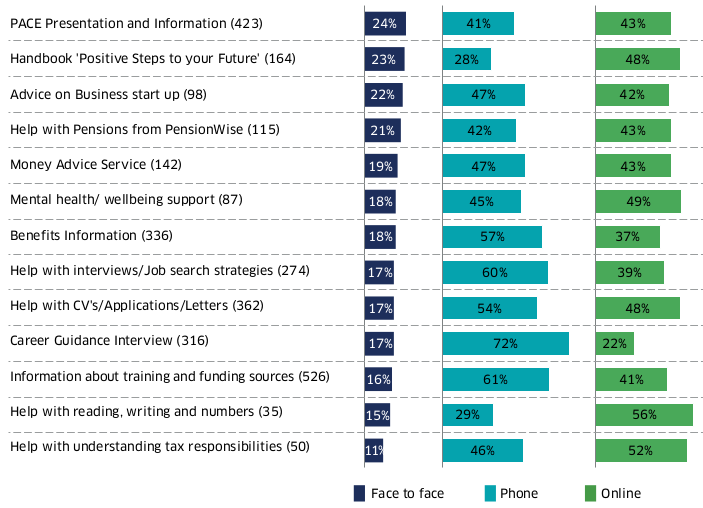
Existing and preferred format for receiving PACE services
3.29 For the first time in the PACE Survey series, clients were invited to feed back on the formats in which they had received PACE services and how they would prefer to access services in the future. As previously discussed, the majority of PACE services moved to a remote or virtual service as a result of the COVID-19 pandemic, resulting in a reduction in the proportion of clients receiving face-to-face services over the two years preceding the survey.
3.30 As shown in figure 3.7, the majority of clients reported that they had accessed services by phone or online. Help with reading, writing and numbers and help with understanding tax responsibilities were the most likely to have been accessed online (56% and 52% respectively), whereas career guidance interviews and help with interviews and job searches were the most likely to be accessed by phone (72% and 60% respectively).
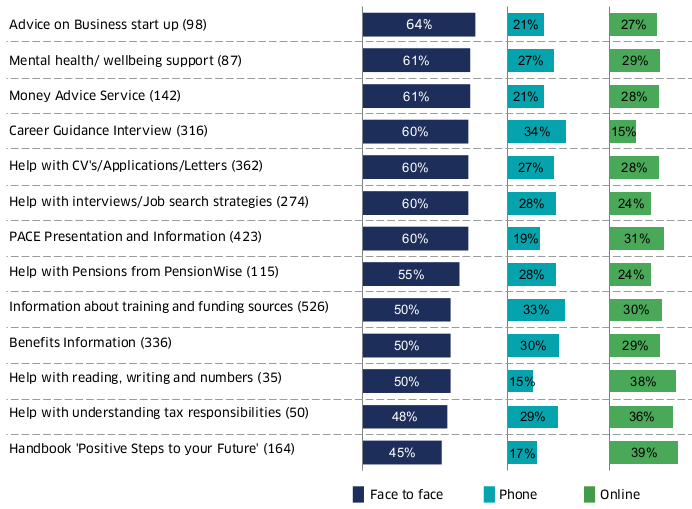
3.31 For each service, a minority reported accessing this face-to-face. This was typically before the pandemic, rather than after. For example, those who first engaged with PACE services before the March 2020 lockdown were much more likely to have accessed the PACE presentation and information pack face-to-face (78% compared to 11% of those who engaged with services after March 2020).
3.32 Clients were also invited to indicate their preferred format for accessing services. Around half (45% to 64%) of clients expressed a preference for face-to-face delivery for each of the listed services. The services clients would most commonly prefer to access face-to-face were advice on businesses start-up (64%), support with mental health and wellbeing (61%) and the money advice service (61%). Despite still being the most popular channel for delivery, a relatively low proportion wanted to access the ‘Positive Steps to Your Future’ handbook and help with understanding their tax responsibilities face-to-face (45% and 48% respectively).
Base: All clients accessing each service: sample size for each row shown in chart
Note ‘don’t know’ responses are not shown. Clients could select more than one format
3.33 As shown in Figure 3.8, there was a relatively even split for preferences between online and phone for most services. One exception included ‘career guidance interviews’, where 34% said they would prefer to access this service over the phone, compared with 15% online.
3.34 There were differences in service delivery preferences by age, with those in the 50 and over age bracket more likely than any other age group to prefer to access services face-to-face. For example, 71% of clients aged 50 and over would prefer to receive the PACE presentation and information pack face-to-face, compared with 48% of those age 30 or under. By contrast almost half (49%) of those aged 30 or under would prefer to access this online, compared with just 19% of those aged 50 and over.
Engagement and satisfaction with PACE online services
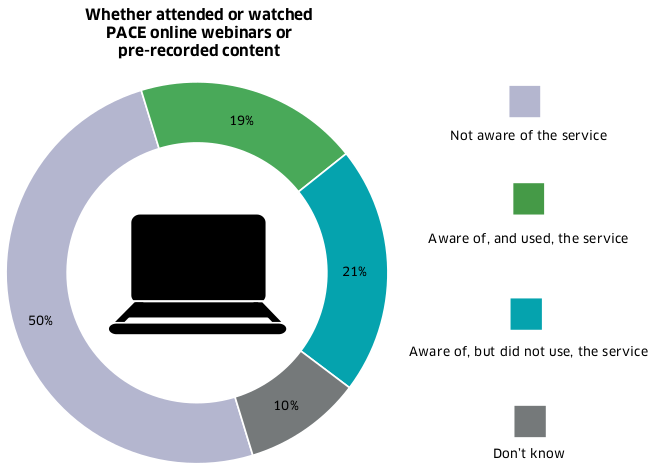
3.35 To explore the increased use of online and virtual engagement with PACE services, clients were asked if they were aware of, or had watched any PACE online webinars or pre-recorded content.
Base: All clients accessing each service: sample size for each row shown in chart
Note ‘don’t know’ responses are not shown. Clients could select more than one format
3.36 As shown in figure 3.9 below, among those who had used PACE services from 13th January 2021 (when webinars were made available), 19% of clients said they had engaged with these online services, and a further 21% were aware but had not engaged.
3.37 Half (50%) of clients were not aware of this online offer, and a further 10% were unsure – suggesting a potential need for increased promotion of online webinars and pre-recorded content.
3.38 Among those who had used the service, the vast majority (91%) said they were satisfied with this experience, with 43% reporting they were very satisfied. This high satisfaction score reinforces that an increased awareness of these services could have an additional positive impact on clients.
3.39 While there was no difference by gender in the proportions reporting they were satisfied with this online offer, females were more likely than males to report being very satisfied (72% compared to 29%).
Base. All who used PACE services from 13th January 2021 (88)
Contact
Email: margaret.sutor@gov.scot