Partnership Action for Continuing Employment: client experience survey 2022
Research into the experiences of clients receiving redundancy support services through Partnership Action for Continuing Employment (PACE). This research is the seventh iteration of research assessing client experiences of PACE.
5 Post-redundancy outcomes and the influence of PACE – longitudinal study
Chapter summary
The findings in this chapter are based on clients who accessed PACE services in the period of January 2018 to January 2020 and took part in the 2020 Client Experience Survey. This chapter explores the longer-term outcomes of this cohort. The key findings from this chapter are reported below:
More than nine in ten (94%) clients had secured post-redundancy work, similar to 2020 levels (93%), but significantly more than in 2018 (88%). Younger clients were more likely than older clients to have secured work.
Just under half of those that secured work in 2022 had found work in the same industry (25%) or a broadly similar industry (22%); this is similar to 22% and 26% respectively in 2020. More than half (53%) found work or self-employment in a different industry to the role from which they were made redundant, similar to the proportion in 2020 (51%).
Three in ten (30%) clients were still working in the same organisation and job role that they had secured initially post-redundancy, while one in ten (9%) had changed roles but were still working for the same employer. Of the 13 clients interviewed who were solely in self-employment following redundancy, all were still working for themselves at the time of the longitudinal survey.
As in 2020, clients who had moved position or role post-redundancy had tended to find better positions in terms of the skills required, responsibility and pay.
Fewer than half of clients (45%) who secured a paid job with an employer post-redundancy reported that PACE had helped them move back into employment.
5.1 This chapter presents findings from the longitudinal survey of clients previously interviewed for the 2020 new clients’ study. As for previous longitudinal studies, results presented in this chapter are unweighted. The 2022 longitudinal survey followed up on 242 clients who had accessed PACE services in the period from January 2018 to January 2020. This chapter examines the longer-term labour market outcomes of recipients of PACE services and the influence of PACE on individuals’ careers and engagement with education, as well as on their confidence and motivation more broadly.
Moving back into work post-redundancy
5.2 The longitudinal survey asked individuals about whether they had secured any new work either before or after being made redundant. More than nine in ten (94%) clients had secured any post-redundancy work, which is similar to the 93% that had done so in the 2020 cohort, but more than in 2018 (88%).
5.3 In terms of the type of work secured in their first role post-redundancy, Figure 5.1 shows that nearly three quarters (73%) of clients had managed to secure paid work with an employer. This is higher than in 2020, when just over three in five (63%) had done so, and 2018, when three in five (61%) had done so. Fewer clients in the 2022 cohort had secured work through a temping agency than in 2020 or 2018 (11% in 2022), pursued self-employment (8% in 2022), or took on voluntary work (2% in 2022).
5.4 As in previous waves, there were key differences in the type of work secured depending on age. As shown in Figure 5.1, clients under 40 were more likely to have secured some form of work following their redundancy compared with those aged 50 or older. Only one per cent of clients aged under 40 had not secured any work, compared to 10% of clients aged over 50.
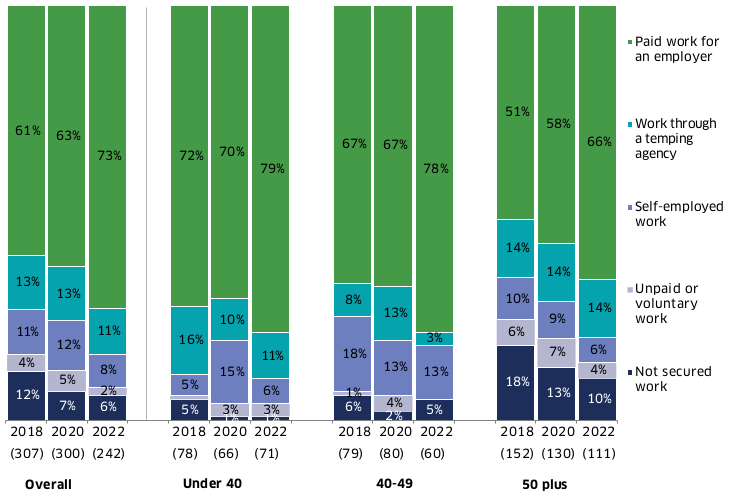
Base: All longitudinal survey clients: 2022 (242), 2020 (300), 2018 (307)
5.5 There were also some gender differences in terms of the type of work that was secured post-redundancy. Female clients (84%) were more likely than males (68%) to move into paid work for an employer, while males (11%) were more likely than females (3%) to move into paid work for an employer after first doing temporary or voluntary work.
Length of time spent out of work post-redundancy
5.6 The longitudinal strand of the research allows for an assessment of how long people were unemployed post-redundancy.
5.7 The time between leaving employment and securing work is displayed in Figure 5.2. The top set of horizontal bars shows the time elapsed between clients leaving their role and entering any type of work (i.e. including self-employment, temping or voluntary work). The bottom set of horizontal bars shows the same analysis but filtered on clients who managed to secure paid work with an employer.
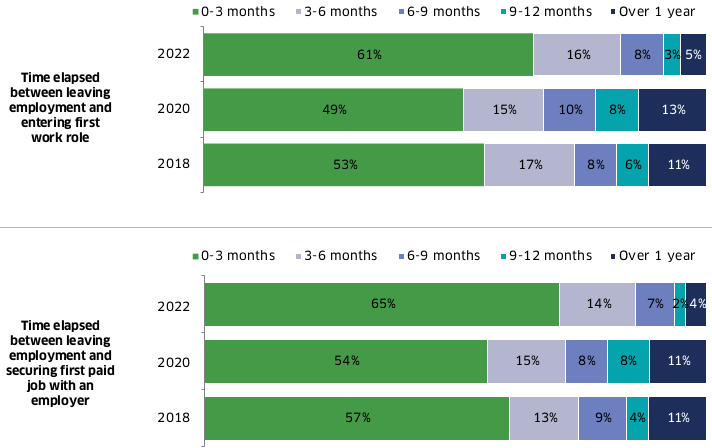
Base: All longitudinal survey clients who had secured work (including self-employment, temping and voluntary work) employer since leaving role selected for redundancy: 2022 (227), 2020 (278), 2018 (270)
Base: All longitudinal survey clients who had secured paid work with an employer since leaving role selected for redundancy: 2022 (176), 2020 (188), 2018 (186)
Note ‘don’t know’ responses are not shown
5.8 It took less time for PACE clients in the 2022 cohort to secure work, compared with the 2020 and 2018 cohorts. Three in five (61%) clients in 2022 had secured work within the first three months of being made redundant, more than in 2020 (49%) or 2018 (53%). Just under one in five (16%) clients secured work between three and six months after redundancy, eight per cent secured work within six to nine months, three per cent within nine to months to a year, and five per cent took over a year to secure their first work role. The proportion that took over a year to secure work was lower than in 2020 (13%) and 2018 (11%).
5.9 The same comparisons can be drawn in terms of the time it took clients to secure a paid job with an employer. Just under two thirds (65%) of the 2022 cohort secured paid work with an employer within the first few months, compared to fewer than three in five in 2020 (54%) or 2018 (57%). Only four per cent took over a year to secure a paid job with an employer in 2022, compared to one in ten (11%) in 2020 and 2018.
5.10 Younger clients were more likely to find paid employment with an employer within the first three months after being made redundant than those aged 50 or older (70% under 40 had done so within this timescale, compared to only 52% of those aged 50 or older).
Details of the first work role secured post-redundancy
5.11 Around four in five (78%) clients that had secured a paid job with an employer had gained full-time employment in their first post-redundancy role, with the remaining 22% gaining part-time employment. This is similar to the 82% that gained full-time employment in the 2020 and 2018 cohorts.
5.12 Among those who had secured either self-employment or employment following redundancy, just under half of those that secured work had found work in the same industry (25%) or a broadly similar industry (22%); this is similar to 22% and 26% respectively in 2020. More than half (53%) found work or self-employment in a different industry to the role from which they were made redundant, similar to the proportion in 2020 (51%).
5.13 In terms of the characteristics of the employment first secured following redundancy, Figure 5.3 details clients’ assessments on the level of skills required by the first role secured following redundancy (relative to the job they were made redundant from), the level of responsibility and the level of pay. Around two thirds of clients had found an initial job post-redundancy that required a higher or similar level of skills (64%) and responsibility (66%), while half (50%) found an initial position with higher or the same level of pay.
5.14 As Figure 5.3 shows, the proportion of clients in 2022 who, post-redundancy, had secured a role with the same or higher level of skills, responsibility or pay was similar to the levels seen in 2020, but higher than for the 2018 longitudinal cohort.
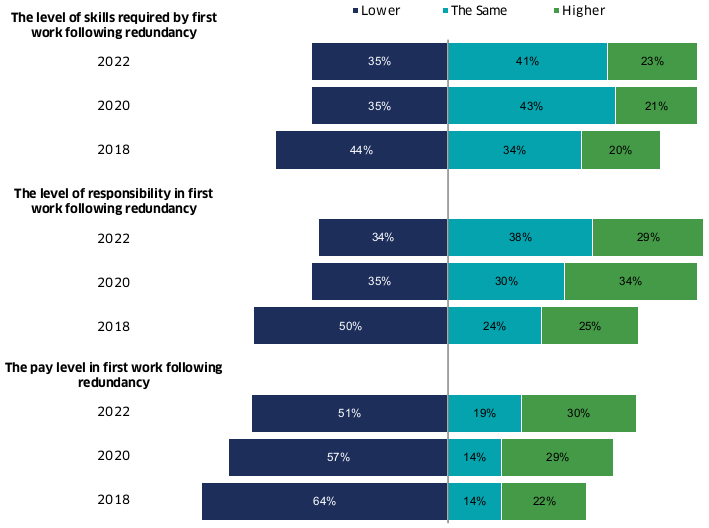
Base: All longitudinal survey clients who had secured a paid job or self-employment since leaving role selected for redundancy: 2022 (216), 2020 (263), 2018 (254)
Note ‘don’t know’ responses are not shown
5.15 As in 2020, clients aged over 50 were less likely than their younger counterparts to report that their new role was better in terms of skills, responsibility or pay compared to the one they were made redundant from:
- 16% of those aged 50 or older had secured a job requiring a higher level of skills, compared to 34% of those aged under 40;
- 18% of those 50 or older had found a job with higher levels of responsibility compared to 43% of those aged under 40; and
- 16% of those 50 or older had found a higher paid job compared to 47% of those aged under 40 and 32% aged 40 to 49.
5.16 When it comes to gender, male clients were more likely than their female counterparts to describe the level of skills required (27% compared to 14%, respectively) and the level of responsibility (34% compared to 17%, respectively) as higher in their new role than the one they were made redundant from.
The influence of PACE services on the move back into work
5.17 Fewer than half of clients (45%) who secured a paid job with an employer post-redundancy reported that PACE had helped them move back into employment, with six per cent saying PACE made all the difference and two in five (39%) saying PACE helped to some extent. More than half (54%) indicated that PACE made no difference in moving back into employment.
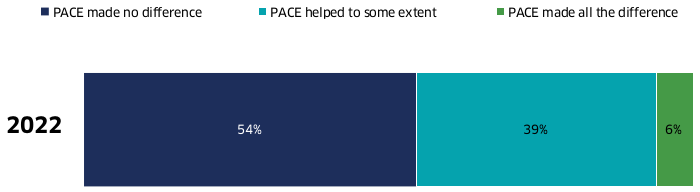
Base: All longitudinal survey clients who had secured a paid job with an employer since leaving role selected for redundancy: 2022 (203)
5.18 Clients who felt that PACE had helped at least a little in returning to employment were asked to report which aspect of the service they believed had helped them the most. As shown in Figure 5.5, the standout service mentioned was help with CVs, job applications, or letters (44%) – this service was also the most helpful for clients in the 2020 study, when a third (33%) said it was such. Around one in ten found the career guidance interview; information about training and funding sources; or help with interviews / job search strategies to have been the most helpful service (each mentioned by 11%).
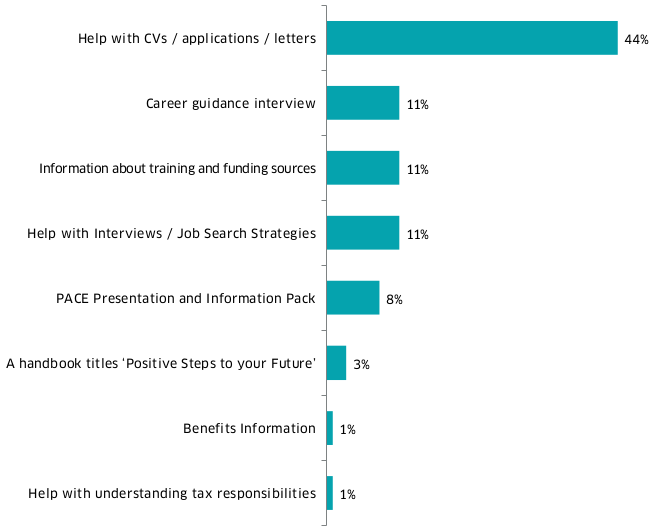
Base: All longitudinal survey clients who had secured a paid job with an employer since leaving role selected for redundancy and felt that PACE had helped them to do this: 2022 (91)
Current employment status
5.19 This section of the report explores what clients were doing at the time of the longitudinal interview, a minimum of two years on from accessing PACE services.
5.20 Three in five clients (60%) said that they were working full-time for an employer, while 14% were working part-time; this is consistent with 2020 (59% and 12%, respectively). A more detailed breakdown of these figures is provided in Appendix B.
5.21 Figure 5.6 combines work outcomes into more general categories. This shows that three quarters (74%) of clients were working in a paid job for an employer, 11% were self-employed or temping, three per cent were actively seeking work and 10% were ‘economically inactive’ (i.e. retired or not working due to a long-term health condition or disability). These proportions are consistent with previous years.
5.22 Older clients were less likely to be working in a paid job for an employer than their younger counterparts. Three in five (62%) of those 50 or older were working for an employer, compared to just under nine in ten (87%) of those under 40.
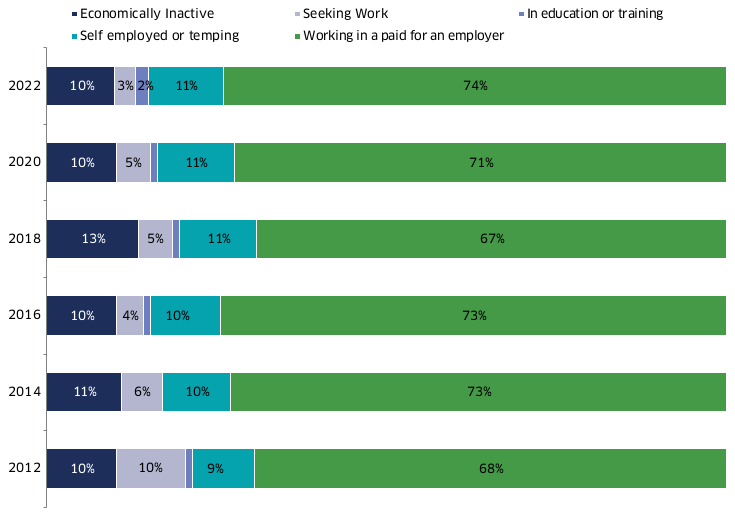
Base: All longitudinal survey clients: 2022 (242), 2020 (300), 2018 (307), 2016 (285), 2014 (194), 2012 (268)
The incidence of sustained employment
5.23 The longitudinal survey allows for analysis of the extent to which clients secured sustained employment over the period since they were made redundant (or had maintained self-employment).
5.24 Three in ten (30%) clients gained work with an employer and were still working in the same organisation and job role that they had secured initially post-redundancy, while one in ten (9%) were still working for the same employer but had changed roles. Of the 13 clients interviewed who were solely in self-employment following redundancy, all were still working for themselves at the time of the longitudinal survey.
5.25 Figure 5.7 shows the characteristics of the job roles of clients interviewed for the 2022 longitudinal survey. Mirroring results from the 2020 survey, while the first job secured following redundancy tended to require lower level of skills, responsibilities and/or pay, these aspects tended to improve in the longer term, after moving into another role. This suggests some clients may have initially taken a job requiring a lower level of skills, responsibilities and/or pay as a stopgap measure, prior to finding a more suitable role.
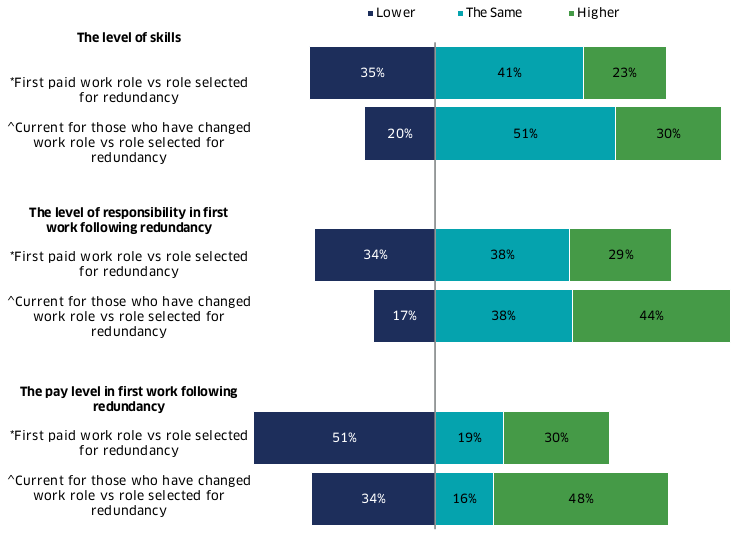
Base * All longitudinal survey clients whose first role post-redundancy was paid work: 2022 (216)
Base ^ All longitudinal survey clients currently in a different paid work role from their initial role: 2022 (87)
Engagement with learning, training and development post-redundancy
5.26 Only two per cent of clients interviewed for the 2022 longitudinal survey were in full-time or part-time education at the time of the survey. However, three in ten clients (30%) had undertaken some form of education or training since being made redundant. This represents a decrease from 2020 levels (39%), returning to a similar level reported in 2018 (33%).
5.27 Of those who had undertaken education or training at any point since redundancy, seven in ten (69%) had done this on a part-time basis and most (71%) said their training was a longer course lasting a week or more.
5.28 Just under eight in ten (79%) of those that took part in education or training gained or were working towards qualifications. This included over 22% that were undertaking job specific qualifications, 17% Scottish Highers or equivalent level qualifications, and 13% degree-level or equivalent qualifications.
5.29 When asked whether their training or development was reskilling or upskilling, over half (53%) described it as upskilling (i.e. gaining skills at a higher level), a third described it as reskilling (i.e. gaining different skills), and one in ten (10%) said it was neither.
5.30 In terms of the influence of PACE services, the proportion reporting that PACE helped them move into this education or training was lower than in 2020 or 2018. A quarter (26%) of clients in 2022 described PACE as helping them move into education or training, compared to three in ten in 2020 (30%) and 2018 (31%).
The influence of PACE on client motivation and confidence
5.31 All clients taking part in the longitudinal survey were asked to consider the extent to which PACE had helped them in their life and career post-redundancy. As Figure 5.8 shows, clients were evenly split between feeling PACE had helped them in this respect and feeling it made no difference (49% and 50% respectively).

Base: All longitudinal survey clients 2022 (242)
5.32 Among those that felt PACE had helped with their life and career since redundancy, the aspects considered most helpful were the help they had received with writing CVs and job applications (33%), information about training and funding sources and help with interviews / job search strategies (12%). These are broadly consistent with responses in previous surveys.
5.33 To further explore how PACE services have helped clients in their post-redundancy life, clients were asked to rate the extent to which PACE had helped them with specific aspects of their post-redundancy life. As shown in Figure 5.9: just under eight in ten (78%) felt that PACE had improved their confidence in getting a job; seven in ten (71%) thought it had improved the skills needed to apply for jobs; two thirds (65%) felt that it had improved their overall career prospects; and more than two in five (43%) felt PACE had improved their mental health / wellbeing during redundancy.
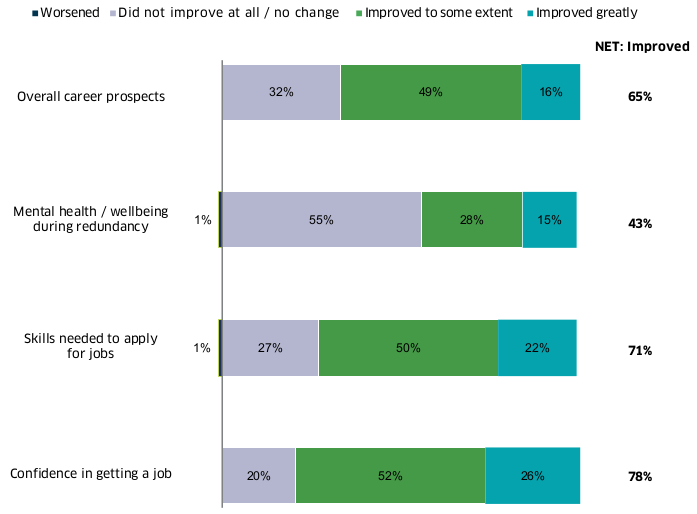
Base: All longitudinal survey clients who feel that PACE has helped them in their life and career post redundancy 2022 (119)
Satisfaction with PACE services
5.34 As a way of gauging client satisfaction two years on from the previous survey, clients were asked whether they would recommend PACE services to others going through redundancy and the extent to which PACE met their expectations.
5.35 Three quarters (76%) of clients were likely to recommend PACE services to others, including just under half (45%) that were very likely to do so (compared with 31% quite likely). Just over one in five (22%) were unlikely to recommend PACE, including one in ten (10%) not at all likely to do so.
5.36 Those who used the PACE presentation and information pack as well as other PACE services were more likely to recommend PACE services to others than those who had not used the presentation pack but used other services (91% compared to 76%, respectively).
5.37 Clients whose highest level of qualification was at degree level or equivalent were more unlikely to recommend PACE services than on average (33% compared to 22%, respectively).[7]
5.38 Overall, a third (34%) of clients who said PACE helped in their career or life since redundancy felt that PACE had exceeded their expectations of a redundancy service, while around three in five (58%) reported that it had matched their expectations. This is broadly similar to 2020, when just over a third (36%) said it exceeded their expectations and half (50%) said it matched them.
Contact
Email: margaret.sutor@gov.scot