Outer Hebrides Inshore Fisheries Pilot: year one report
The OHIFP is a stakeholder-led project developed collaboratively by the fishing industry, the scientific community and Scottish Government to test approaches to fisheries management within a significant area of sea to the east of the Outer Hebrides. This report summaries the first years findings.
5. Tracking and Monitoring
5.1 The Vessel Tracking Solution
As part of the work stream led by University of St Andrews, 40 vessels participating in the Pilot were fitted with a tracking solution. This solution utilised the Teltonika FMB204 tracker, which is widely used in the logistics sector (Figure 11). The device is fully configurable and, based on SIFIDS research, is set to capture vessel position, direction and speed of travel every 30 seconds. At the time of writing the unit cost of this device is £75, but it is likely that bulk purchase from the manufacturer might drive the cost lower.
Data captured by the device are transmitted via the mobile phone network to a secure Microsoft Azure cloud server. Data costs associated with this SIM card-based system were approximately £25 per unit annually. The data is stored in a relational database and automatically analysed to infer where fishing is taking place and to provide estimates of the number of creels being deployed.
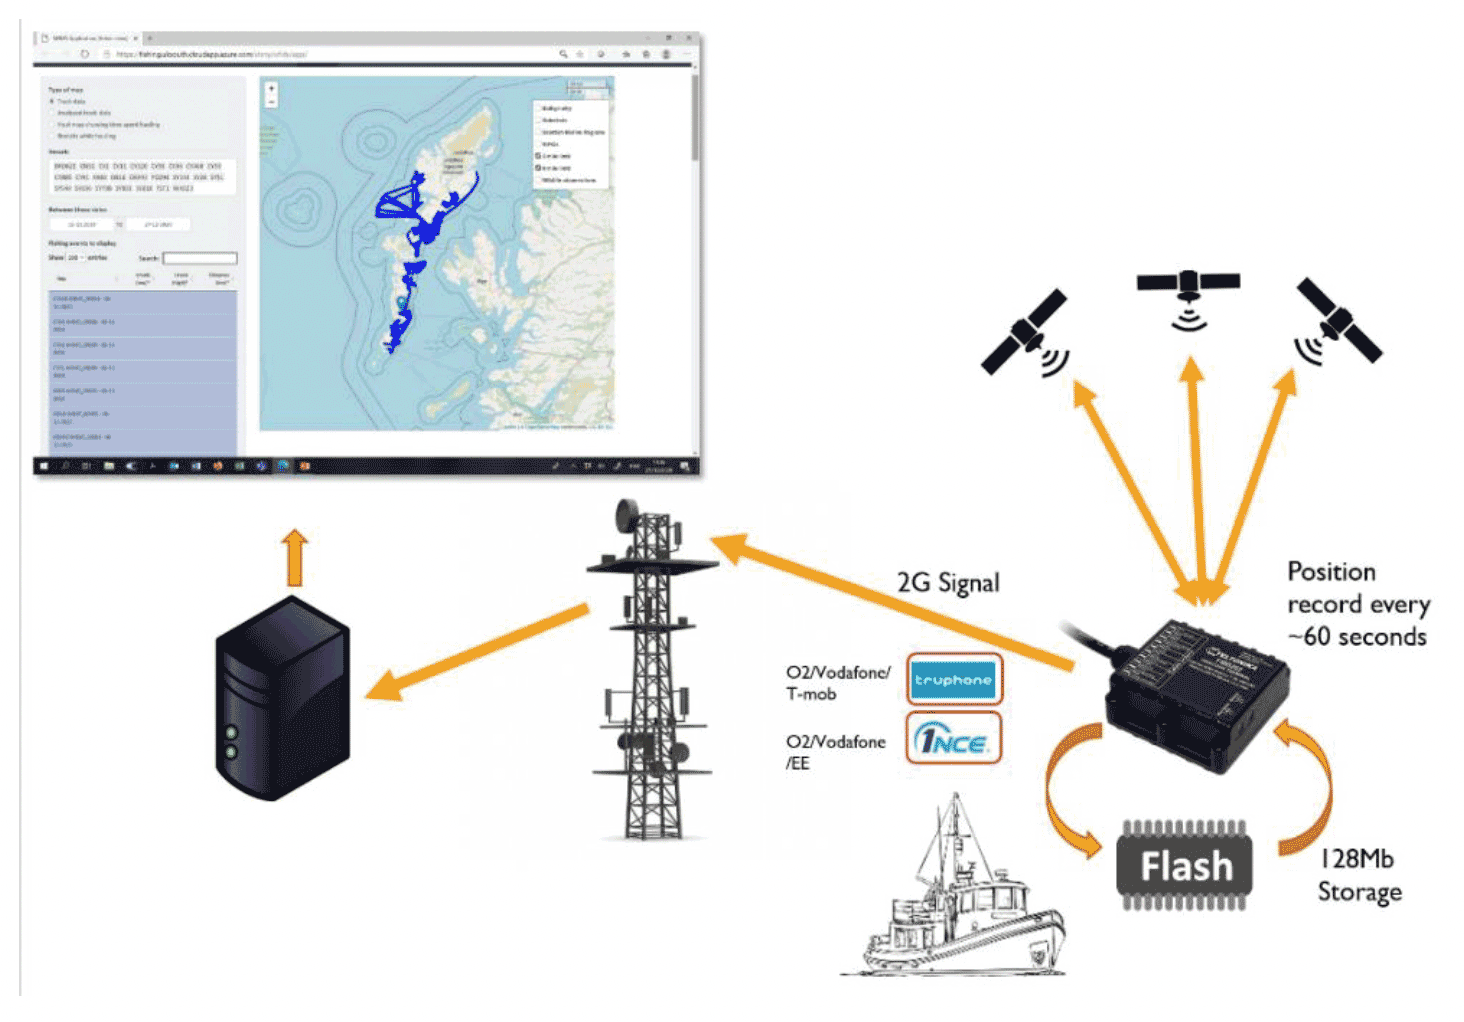
Fishers taking part in the Pilot, who had trackers fitted aboard their vessels were required to sign a data consent form and provide access to an engineer to enable installation. The majority of vessels (33) were fitted by the time the Pilot trial formally started on 5th November 2020.
The trackers are equipped with multi-network SIM cards for mobile communication of data. Five vessels operating to the south of Barra appeared to have network connection problems and a subset of these vessels were re-equipped with alternative SIMs with a view to resolving these issues. Whilst this does appear to have worked for some, there are still anomalies with the connections of at least two vessels that will require further investigation.
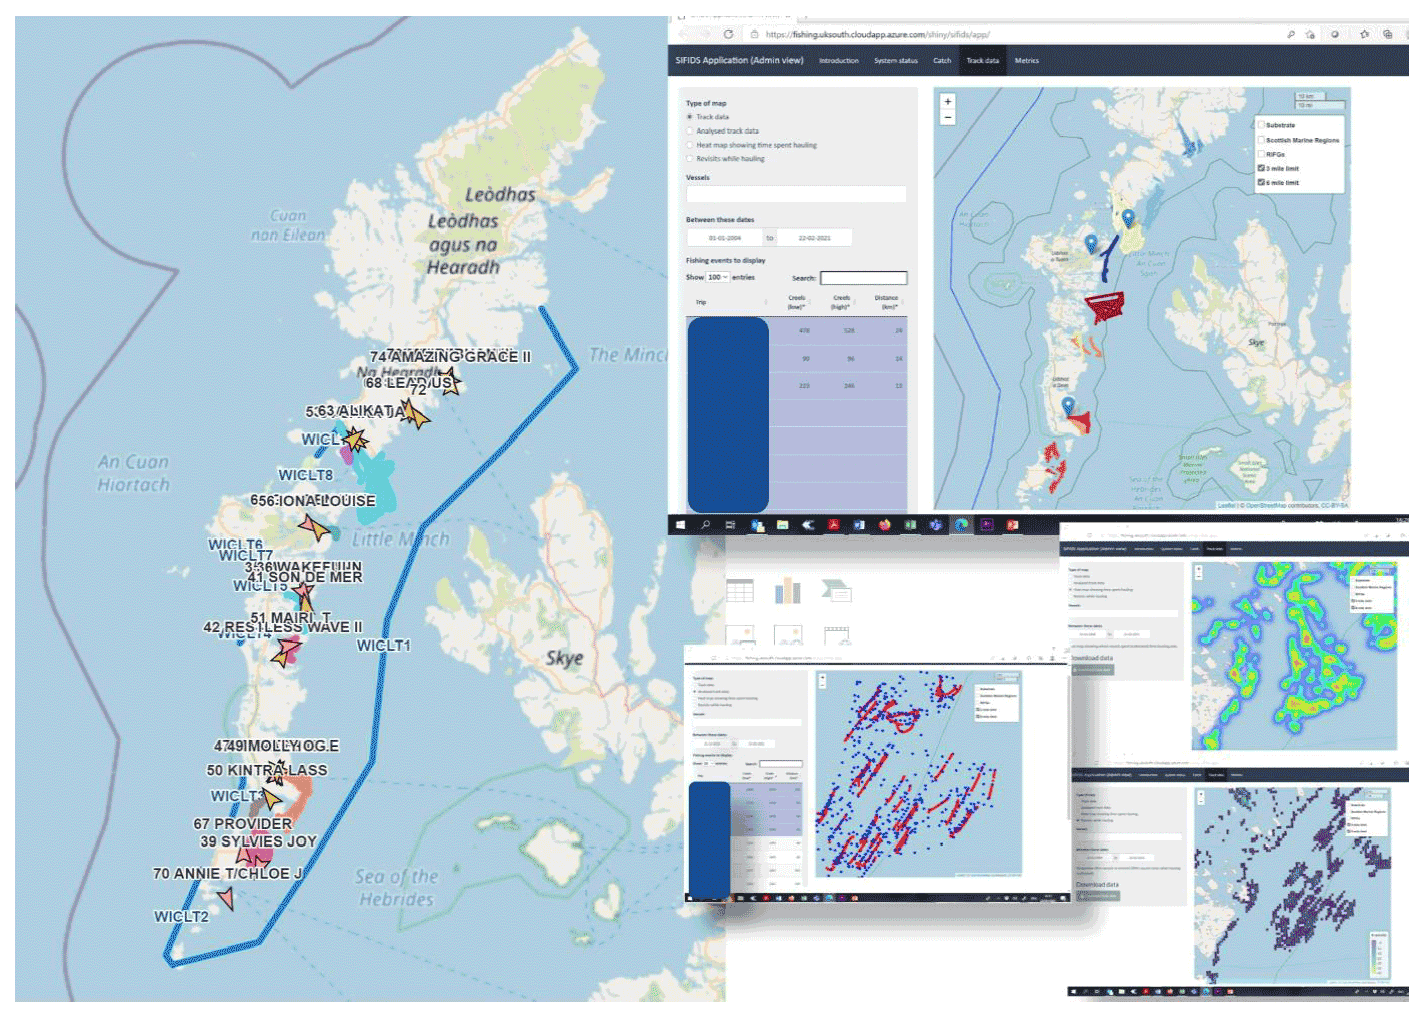
All fishers who have had trackers fitted to their vessels and provided a signed consent form have been issued with login credentials to allow them access to the online portal, where they can see their own track data. Marine Scotland Compliance Officers also have access to the tracks for all participant vessels (Figure 12.).
5.2 The Catching App
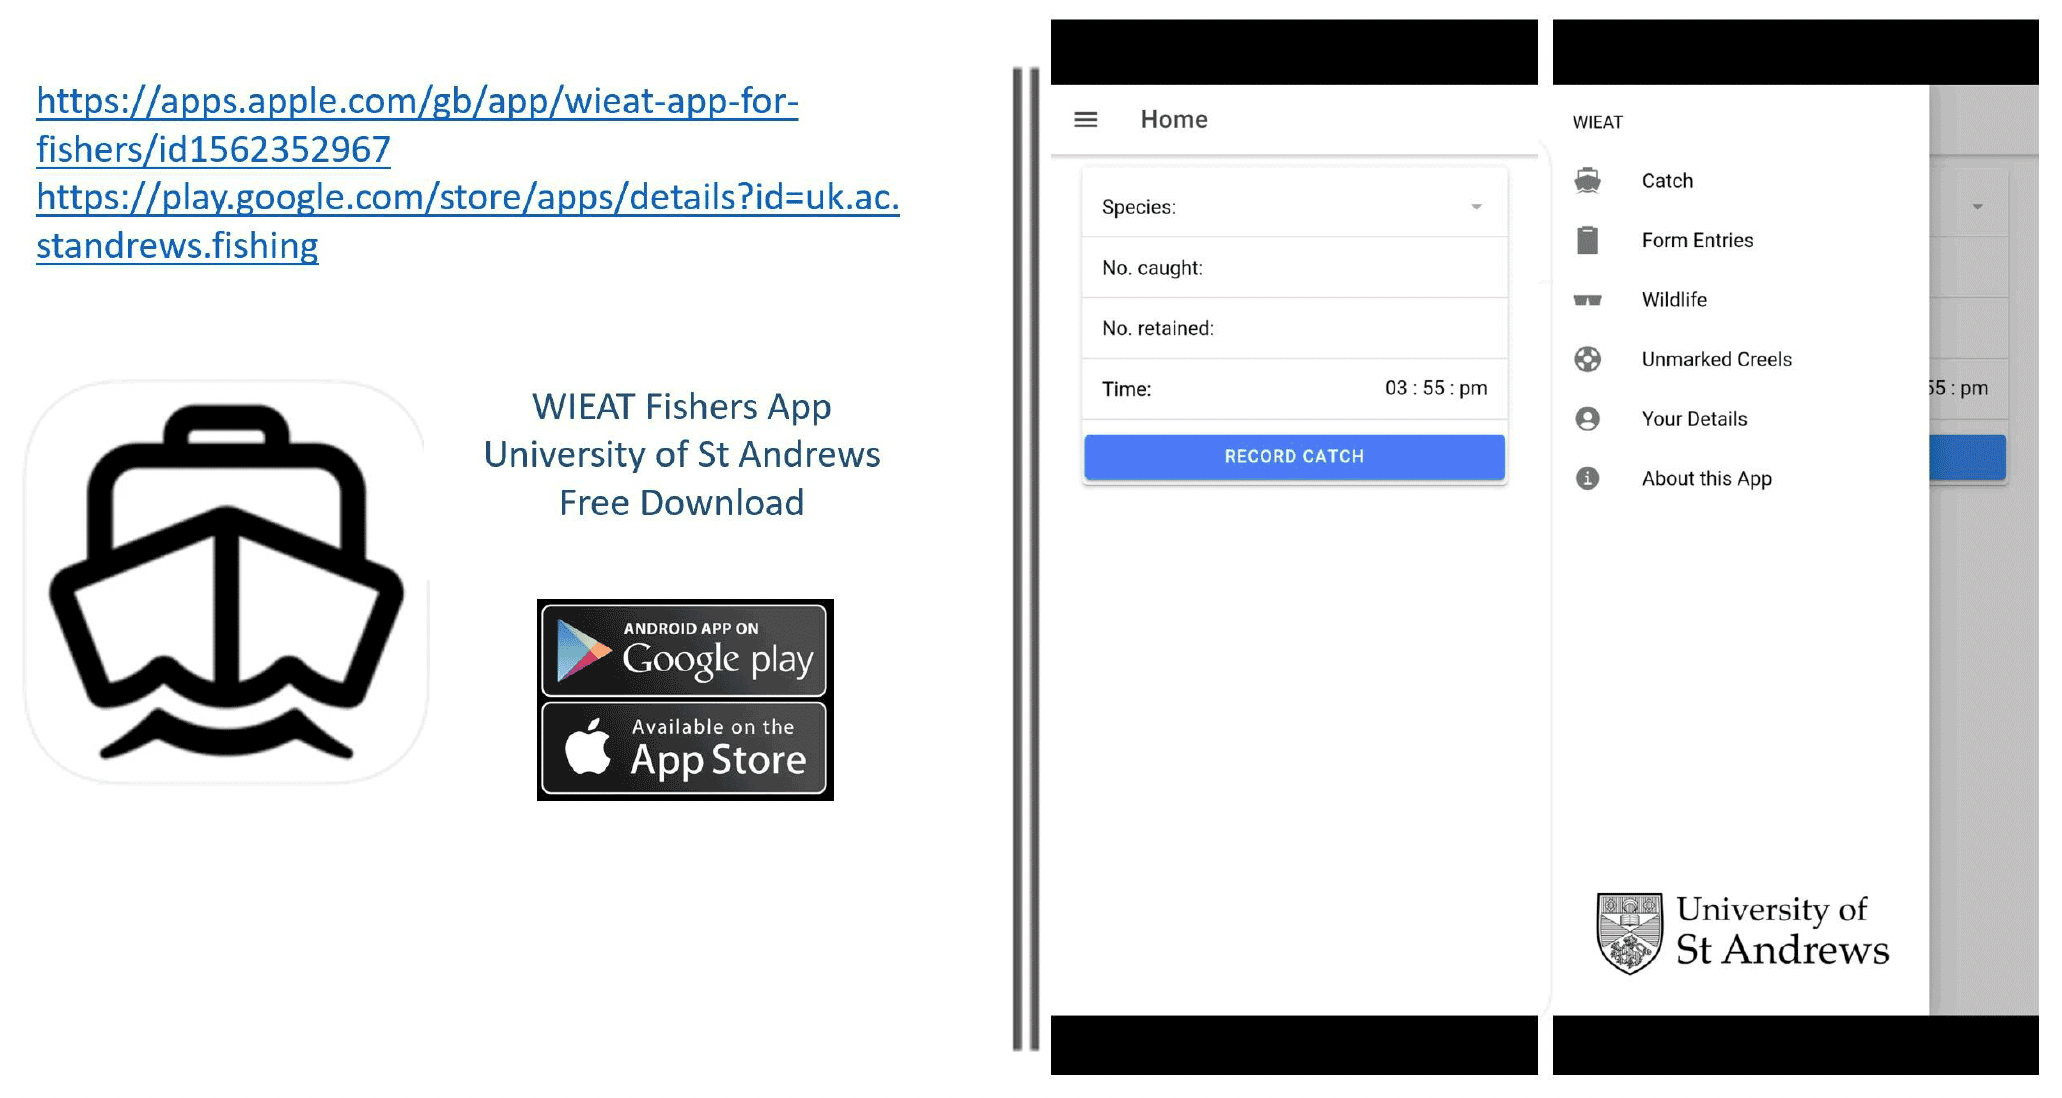
Marine Scotland are currently working on developing an online portal whereby fishers can submit FISH1 returns directly. However, as an interim measure to support collection of best quality data for the Pilot, the SIFIDS Catching App was redesigned for the Pilot. The App (Figure 13 A, B) was tested and released to participants in June 2021 with the approval of Marine Scotland and forms part of consideration of approaches to encouraging modernisation of the inshore fleet. The App is available for both Android and iOS mobile devices (phones) and is designed to capture data on catch and landings. The App has been introduced to the Pilot to provide an option to assist fishers in their statutory requirement to submit a weekly FISH1 form. While it remains the responsibility of the fisher to submit this information to their local Fishery Office as required, the app is able to record catch data in the required format, that can then be printed or emailed to the Fishery Office.
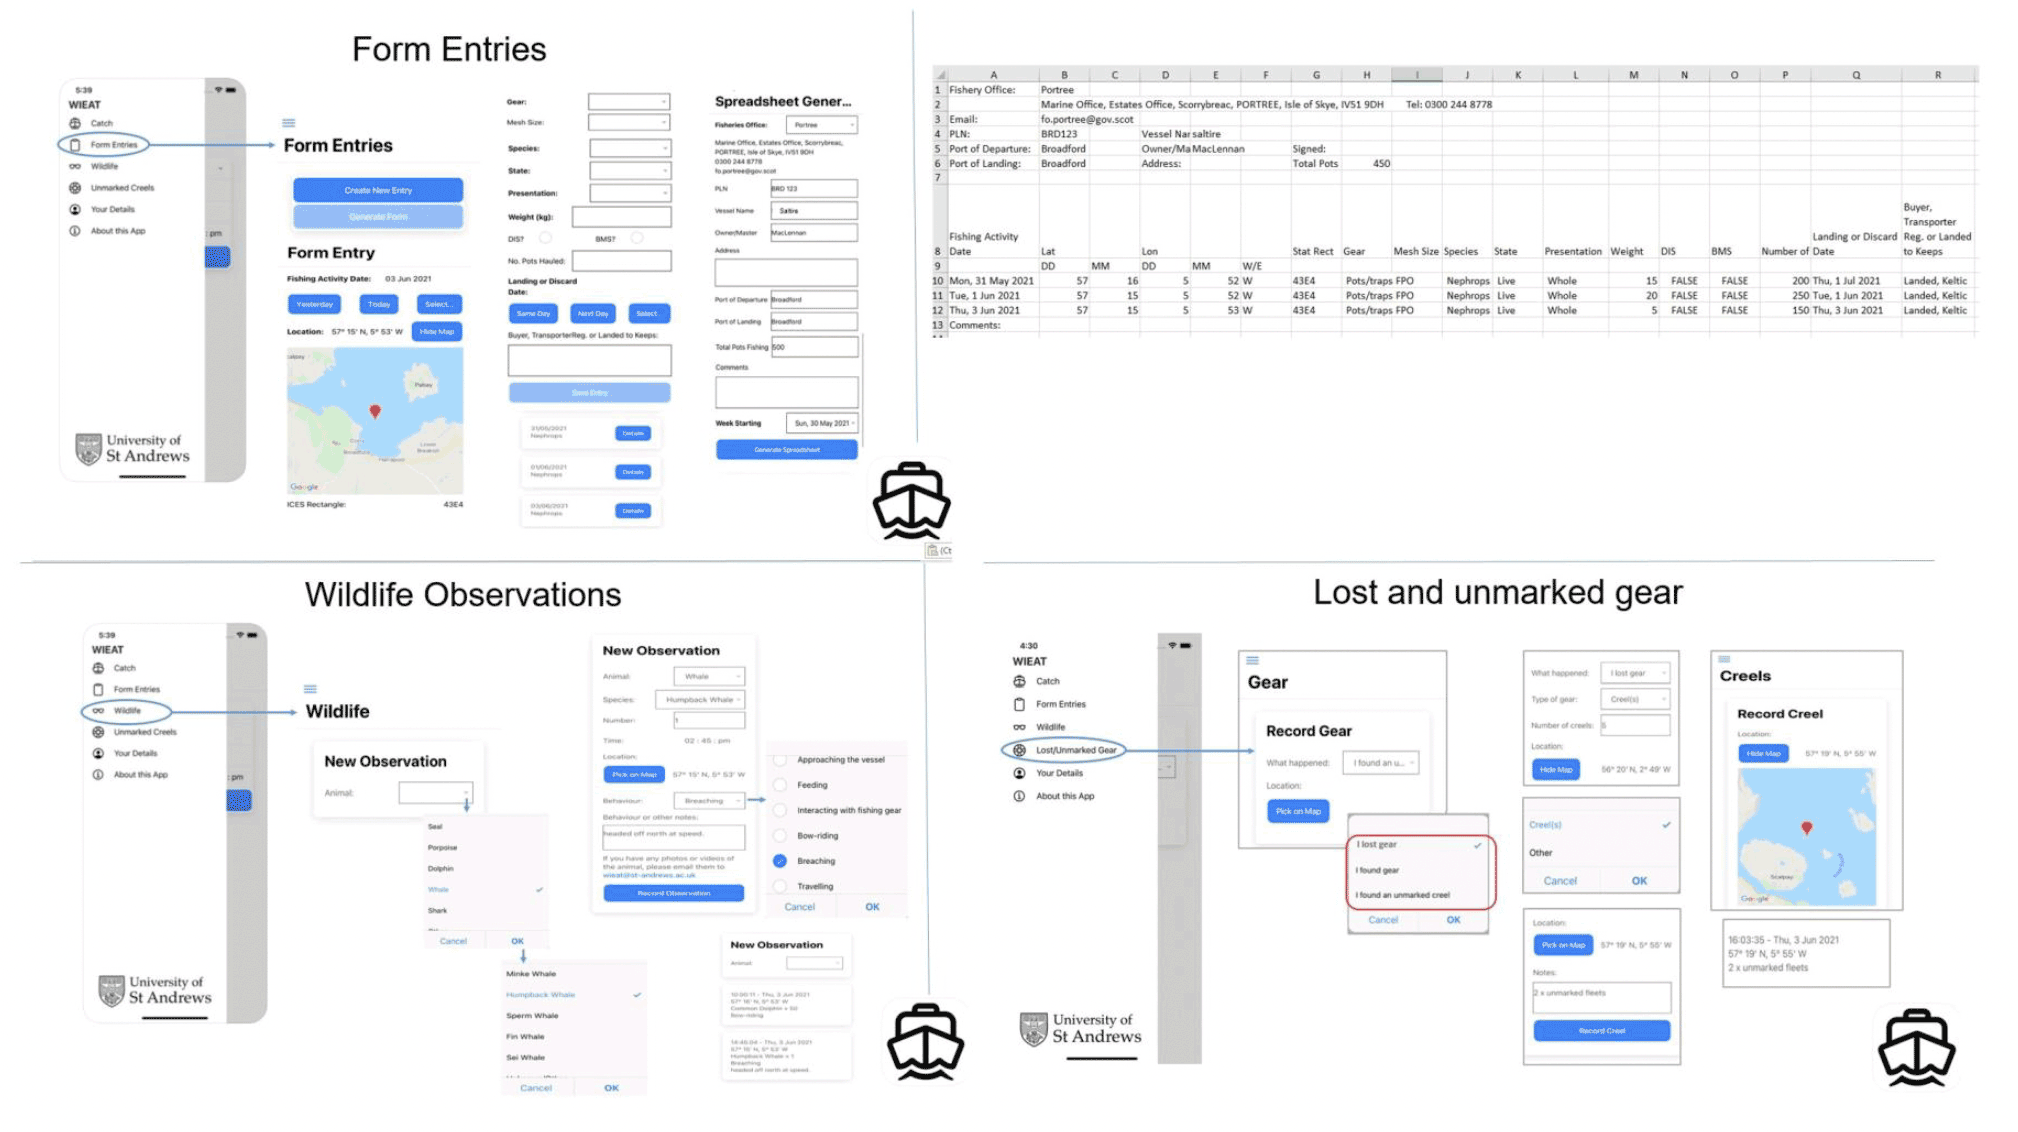
Data from the App is transmitted to the Azure cloud server database and combined with the relevant track data for each vessel. By combining track, catch and landings data, it should be possible to generate accurate metrics of fishing effort and catch (CPUE) and LPUE. The priority is to ensure that fishers with trackers fitted to their vessels use the App as soon as possible. To this end, the App was promoted by a demonstrative YouTube video as well as WIFA meetings with fishers in Barra, Benbecula and Tarbert in August 2021 and a further visit in November 2021 in association with WIFA training meetings.
Feedback thus far suggests that some fishers rely upon the return of catch weights from their buyer before they populate their FISH1 forms and so are reluctant to populate the App with estimates of weight on a daily basis. Providing estimates of daily catch was also considered by some respondents to represent additional work. Unfortunately, it is difficult to reconcile catch and landings data with track data unless fishers are willing to use the App to provide contemporary catch and landings data on at least a daily basis. During the second year of the trial the St Andrews team will continue to promote the App and analyse the data from registered users. Direct experience of observing fishers at sea, is that many manually record the number of lobsters and crabs that they retain per creel fleet.
5.3 Fitting of Trackers
The process of fitting vessels remotely using subcontractors has been extremely challenging, and a firm recommendation for any such roll-out in the future is that a dedicated team of fitters be contracted to manage both the logistics of fitting the vessels and the physical work. Further, that they are obliged to provide all necessary details of the process to the tracker database administrator at the time of fitting each vessel and that they undertake the necessary diagnostic tests to ensure that the tracker is functioning and reporting correctly. In addition, the engineer and the skipper of the vessel should undertake to provide the necessary consent as part of an online transaction prior to the tracker being fitted. Delays in communicating this information, together with poor documentation of the fitting process resulted in significant delays and additional staff resource requirements. In principle, this should be a straightforward process. Personal experience of the St Andrews team in fitting the Teltonika trackers to vessels is that this process usually takes less than one hour per vessel. Registering the skipper, vessel and tracker details on the database can be achieved in less than 30 minutes. Some of the steps required to register the tracker on the SIFIDS system need to be streamlined and automated checks implemented to prevent duplication or errors in data entry.
Throughout the course of the trial, it is of note that some vessels have either not gone to sea or have been laid up for extended periods due to ill-health, mechanical failure, or vessel owners having other employment preventing them from fishing. In addition, a number of vessels originally identified to be fitted with trackers have been sold or replaced during the course of the pilot. Keeping abreast of changes in the status of vessels could potentially represent a significant administrative challenge and any large scale roll out of tracking will need to put in place the necessary processes to screen for such changes in vessel status.
5.4 Tracker Performance
Trackers that have been correctly fitted have proved to be extremely reliable. Whilst there are clearly some areas of poor mobile network signal, the majority of vessels appear to be reporting track data in near real time when there is sufficient signal to both send a signal and forward any stored track data.
There do not appear to have been any tracker malfunctions, but there are at the time of reporting ~5 trackers that have not reported for extended periods where it does appear that some fishing has occurred. These trackers will be investigated as part of ongoing work.
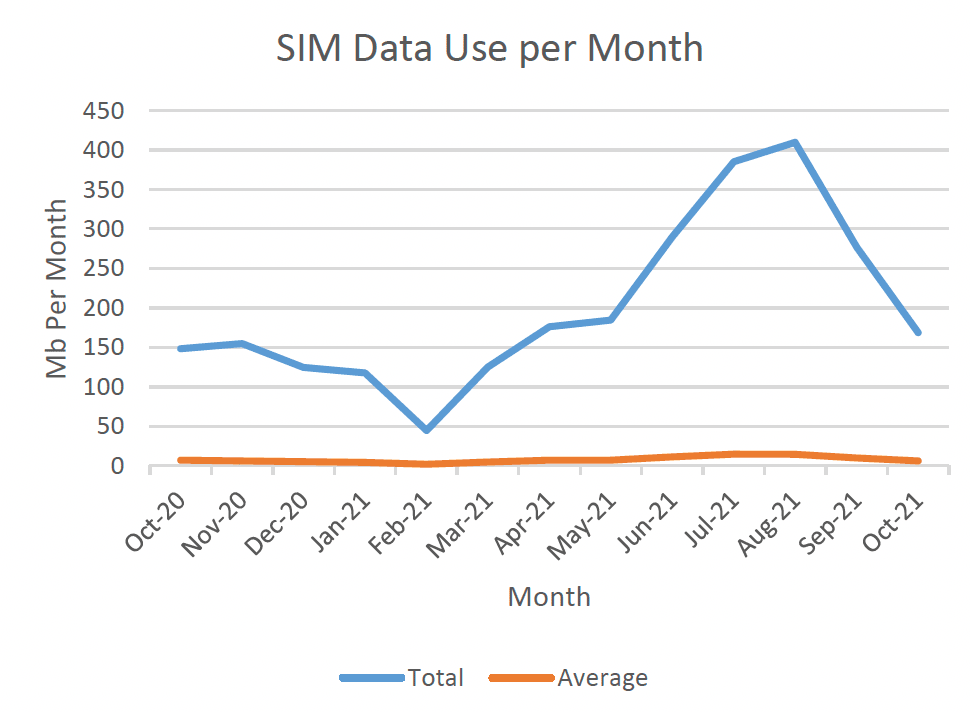
As part of the Pilot, SIM data use has also been monitored. The multi-network SIM cards used in the trackers are data only and have a limit of 400 Mb per SIM per month. The total data allocation across all SIMS can be balanced to maximise the efficiency of data use. Figure 14 shows SIM data use per month for all vessels tracked showing that no vessels exceed the monthly data limit and data use clearly mirrors fishing activity as illustrated in Figure 14. Monthly SIM Data use per vessel averages less than 6 Mb and the maximum recorded was 27 Mb SIMs cost ~£20 per year per vessel.
5.5 Tracker Data Analysis
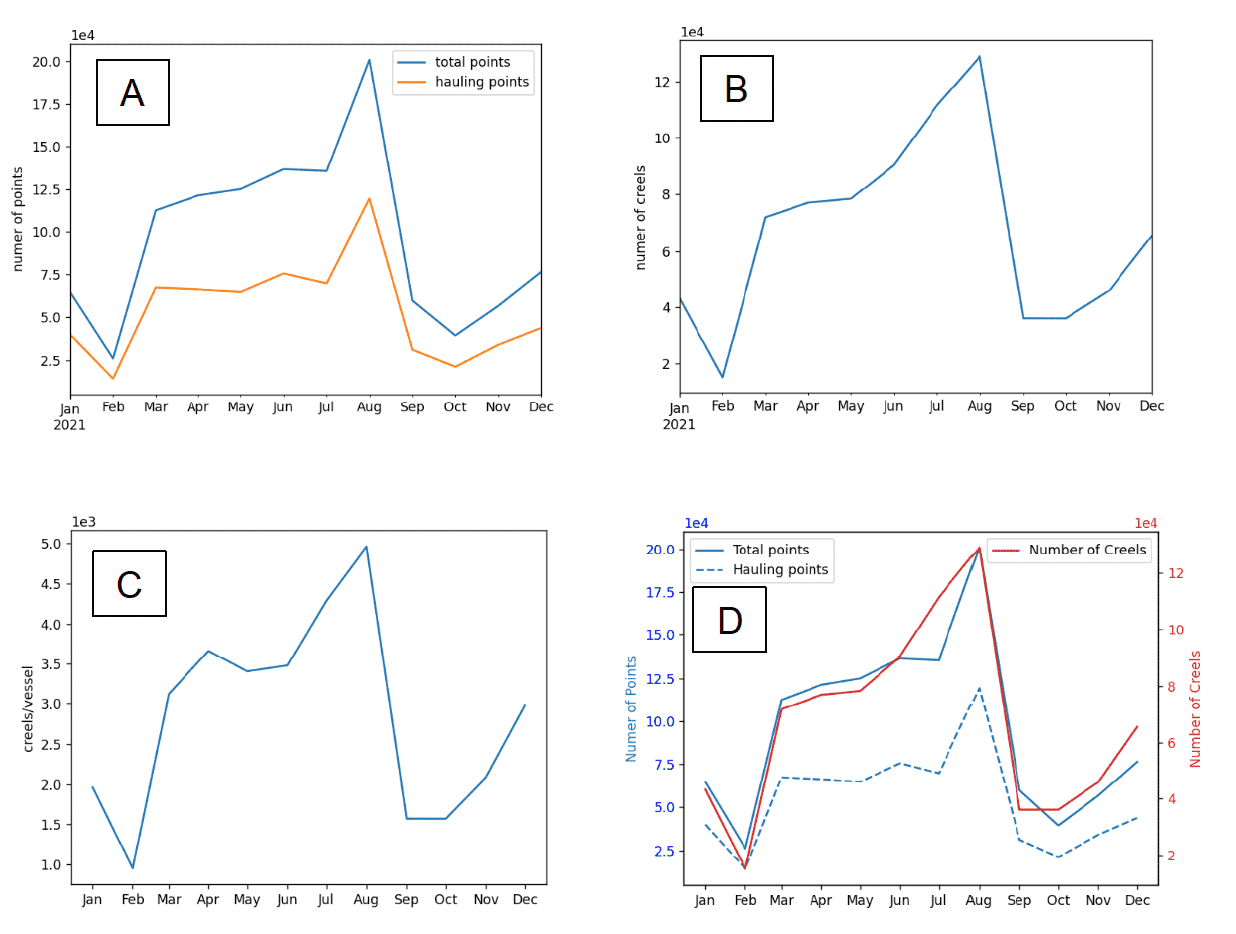
Between 1st January 2021 and 31st December 2021 a total of 1.15 million data points have been recorded. Analysis of these data is provided by month indicating the estimated number of creels deployed by the specified number of vessel for which track data is available for that month (See Table 2). The creel estimates remain to be verified, but the algorithm used to produce these estimates now automatically determines whether the vessel fished for Nephrops or crabs and lobsters and thus amends the creel separation per fleet/string accordingly.
| Month | Total No. Positional Records | Total No. of Positional Records for Hauling | Estimated Total No of Creels | Total Number of Vessels | Total No of Trips | Average Estimated No of Creels Hauled Per Trip Per Vessel |
|---|---|---|---|---|---|---|
| 01/01/2021 | 64675 | 39994 | 43234 | 22 | 140 | 330 |
| 01/02/2021 | 26016 | 14201 | 15159 | 16 | 54 | 303 |
| 01/03/2021 | 112490 | 67453 | 71731 | 23 | 232 | 345 |
| 01/04/2021 | 121265 | 66336 | 76920 | 21 | 257 | 334 |
| 01/05/2021 | 125001 | 64871 | 78301 | 23 | 248 | 359 |
| 01/06/2021 | 136622 | 75652 | 90444 | 26 | 254 | 371 |
| 01/07/2021 | 135557 | 69790 | 111502 | 26 | 367 | 324 |
| 01/08/2021 | 200852 | 119358 | 129017 | 26 | 381 | 355 |
| 01/09/2021 | 59856 | 31155 | 36150 | 23 | 113 | 341 |
| 01/10/2021 | 39433 | 21173 | 36135 | 23 | 152 | 260 |
| 01/11/2021 | 56726 | 34005 | 45866 | 22 | 166 | 288 |
| 01/12/2021 | 76488 | 43823 | 65527 | 22 | 226 | 306 |
Figure 15 A-D illustrates the seasonal changes in creeling activity, with little fishing in January to February rising to a peak in July to August, dropping dramatically in September to October, before increasing steadily in the run up to Christmas.
The estimate of creel numbers is based on the estimated separation of creels used for Nephrops and crab and lobster coupled to the length of the fleet calculated from the length of the fleet hauled. Further refinement of this model is required to take into account those vessels that are using parlour creels.
The ability to collect pilot scale data over an extended period has also enabled the necessary data cleaning steps to be automated updated to eliminate spurious data points that appear on land and interpolation errors that cause track lines to cross areas of land. Work to improve the prediction of the shooting of gear is ongoing but this will ultimately improve predictions of soak time – i.e. the difference between the time the gear is shot and hauled.
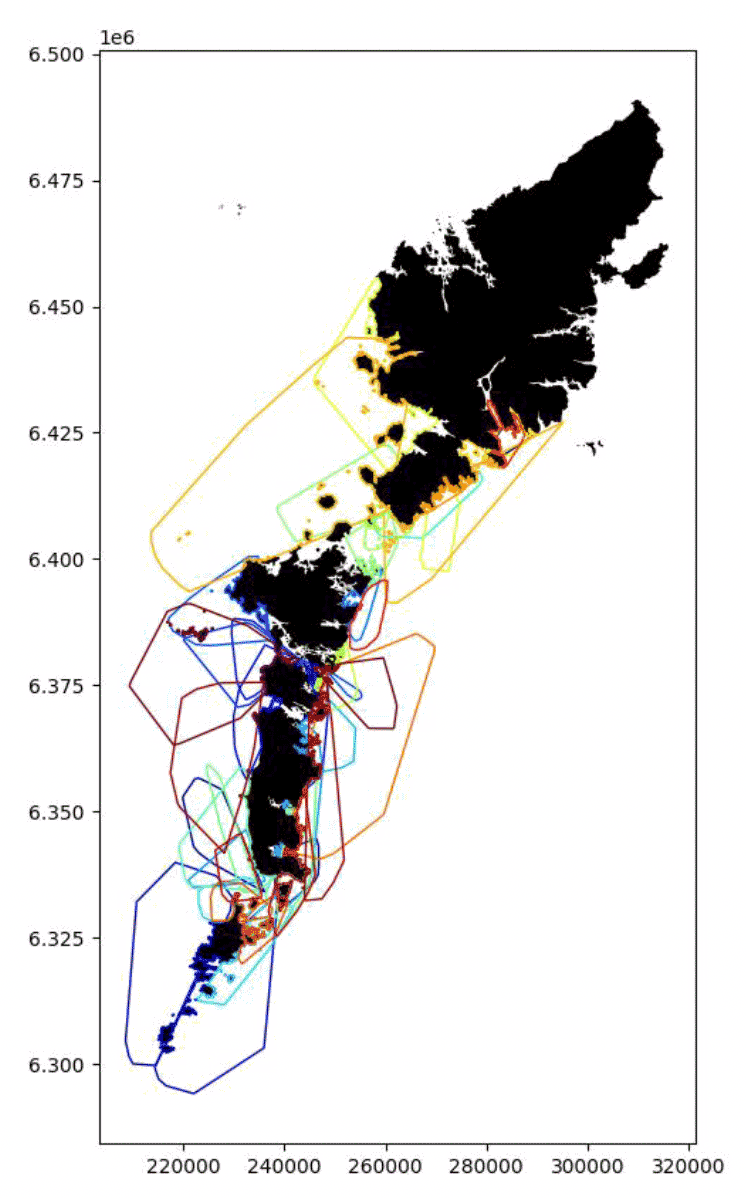
Vessel track data clearly shows that individual skippers tend to fish quite discrete areas that are, by and large, separate from other local fishers inferring some local agreement on the use of space and resource (Figure 16). In addition, there is a point at which fishers switch from fishing within the creel limitation area in the east, to fishing in the more open waters of the west (Figure 17 A, B).
If the average number of creels deployed per vessel is extrapolated to the total number of vessels participating in the creel limitation pilot (~140), it suggests that there have been in the order of 500,000 creels deployed in the 12 month period beginning 1st January 2021. Whilst this Figure is speculative it provides a measure of the level of creeling effort within the Pilot area and more broadly around the Outer Hebrides.
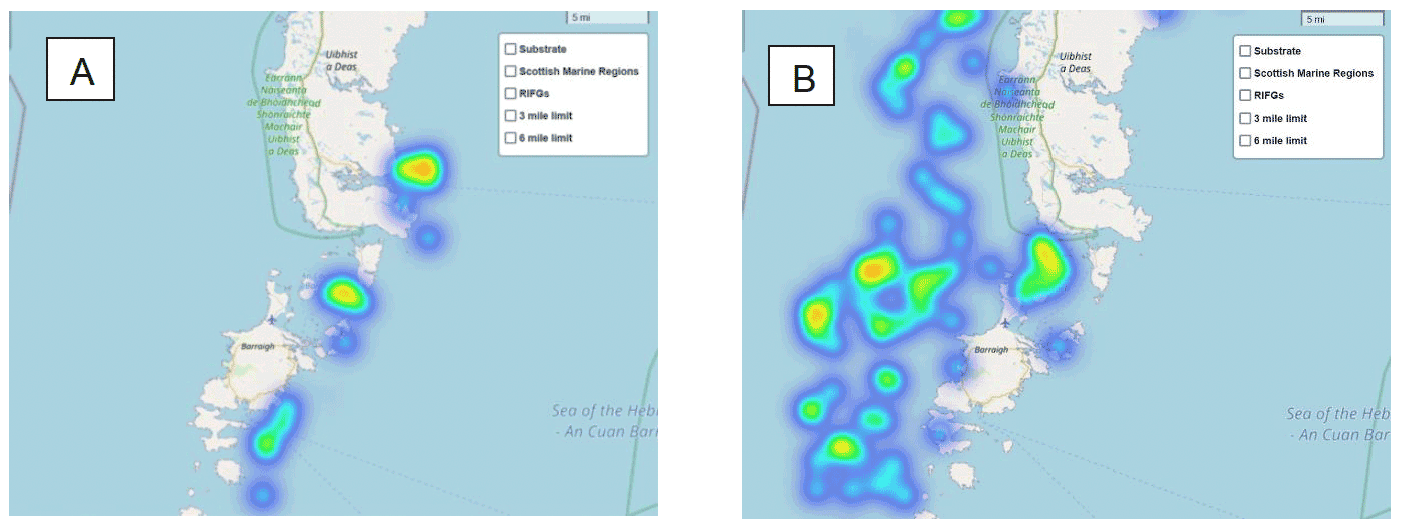
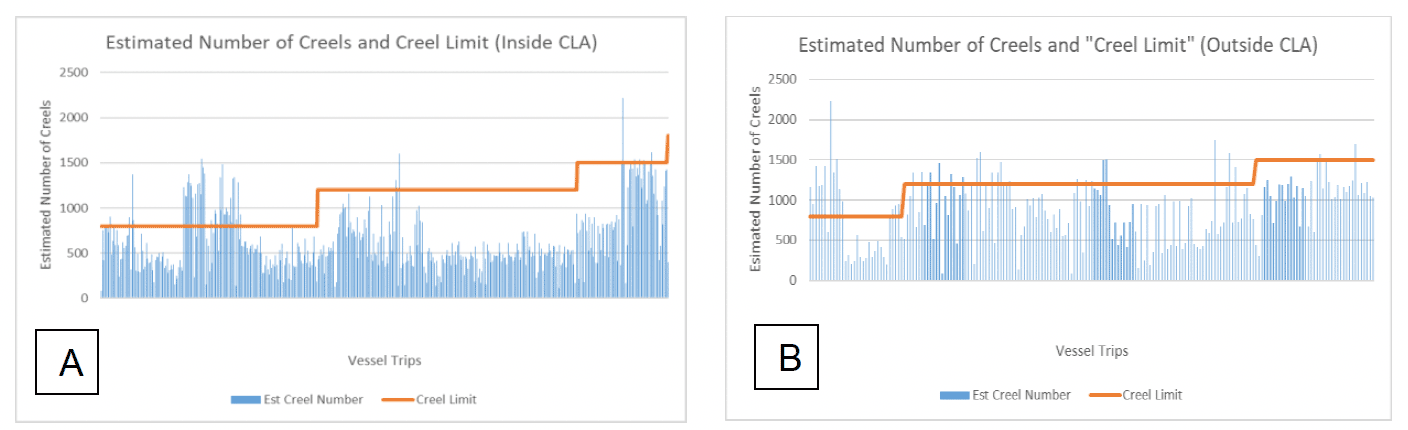
Analysis of individual vessel creel counts per day suggests that the vast majority of vessels are deploying fewer creels than their designated limit with only two vessels appearing to breach that limit (Figure 18A). Discussions with fishers involved in the trial suggests that this could be caused by "double hauling" which is when fishers deploy their creels and haul them more than once per day. The creel limitation rubric should preclude double hauling if the objective is to reduce creel effort. Based on some estimates of creel numbers deployed outside the Creel Limitation Pilot area to the west of the islands (Figure 8B) it is likely that similar creel limits would also not be exceeded.
5.6 Next Steps
Vessel tracking will continue until October 2022. Improvements in track data analysis are ongoing and refining soak time estimates will be a priority. We will attempt to verify soak time using uniquely identified active RFID tags that we will deploy on selected vessels to detect when and where specific creels are deployed and recovered.
The St Andrews team will also continue to promote the use of the App to provide the data needed to calculate highly spatially resolved CPUE and LPUE.
Evaluation and qualitative assessment of socio-economic implications
It is important to conduct monitoring and evaluation of the pilot and the key work streams in order to know how well they are working, identify any unintended impacts, and collect useful learning that may inform adaptations to the approach going forward. An evaluation and qualitative assessment of the pilot project will therefore be conducted during 2022. The main aims of the evaluation and qualitative assessment are therefore to:
- Broadly assess whether the Creel Limitation Pilot has achieved its objectives.
- Qualitatively assess experiences / perspectives of a some of those involved in the Pilot and the impact that it may have had on fishing practices.
- Qualitatively assess the impacts of the Pilot on fishers, covering both social and economic considerations.
- Provide insights and recommendations for future projects of this nature.
The findings will inform future management approaches, such as those proposed in the FFM Strategy and the marine outcomes of the Bute House Agreement.
Contact
Email: inshore@gov.scot