Outer Hebrides Inshore Fisheries Pilot: year one report
The OHIFP is a stakeholder-led project developed collaboratively by the fishing industry, the scientific community and Scottish Government to test approaches to fisheries management within a significant area of sea to the east of the Outer Hebrides. This report summaries the first years findings.
4. Assessment of Available Data
Marine Scotland Science analysed data that fishers statutorily provided between 2017 and 2021 (note that data for 2021 is provisional and incomplete) to advise on how the effects of measures introduced in the Pilot area could be evaluated. Available data included FISH1 forms for vessels of 10 metres and under, log sheets for vessels over 10 to 12 metres and electronic logbooks for vessels of over 12 metres in length. Analyses was carried out for:
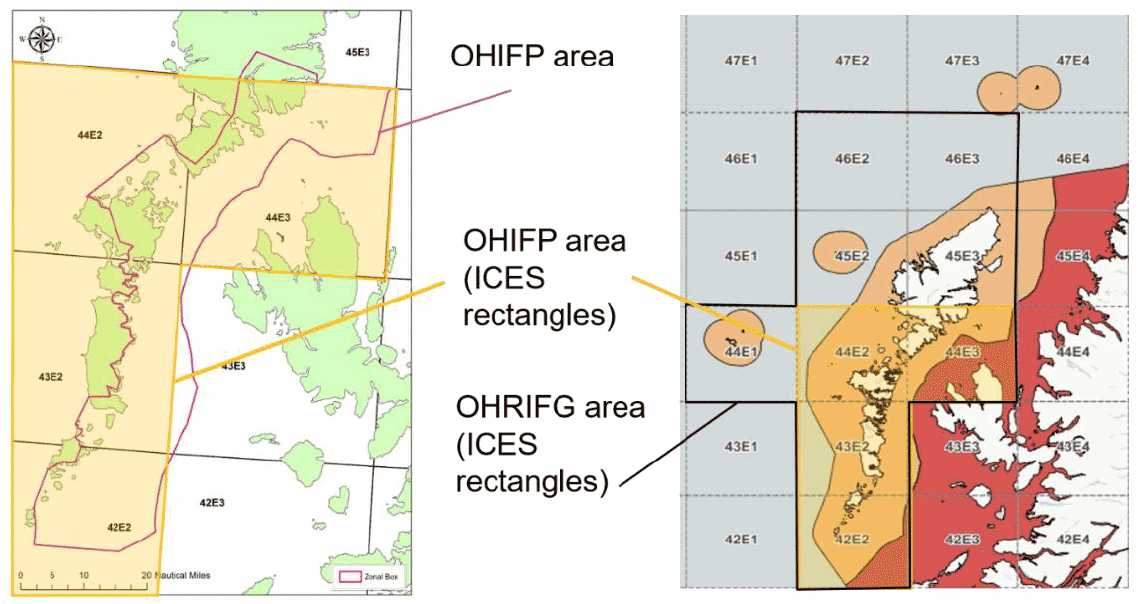
- All vessels fishing in the Outer Hebrides Regional Inshore Fishery Group (OHRIFG) area (ICES statistical rectangles 42E2, 43E2, 44E1, 44E2, 44E3, 45E2, 45E3, 46E2 and 46E3).
- Vessels fishing in the four ICES rectangles most relevant to the Pilot area (44E2, 44E3, 43E2 and 42E2) (Figure 2).
- Vessels with trackers.
The analyses summarised the data (number of vessels and trips), evaluated the data quality, and reported landings and landings per unit effort (LPUE) for edible crab, European lobster, Norway lobster and velvet crab for those vessels derogated to fish in the Pilot area. The spatial distribution of vessels fitted with trackers was also explored.
Marine Scotland Compliance Officers work tirelessly to ensure fishing returns are completed accurately and submitted timeously, but the self-certified nature of these returns mean there are weaknesses in the resultant data. These can stem from both inaccurate completion of FISH1 forms by the fisher, but also from operator error when they are entered onto the computer system used by Marine Scotland. Common issues include missing or unrealistic position reports and numbers of creels worked, gear types that are mismatched to the species caught and missing fishing trips. 7.6% of fishing trips featured extreme values for live weight, number of creels hauled and LPUE. Extreme values tended to be very low (zero or less than zero) or high enough that they could not realistically have been achieved on a single voyage.
4.1 Breakdown by Gear, ICES Rectangle and Species
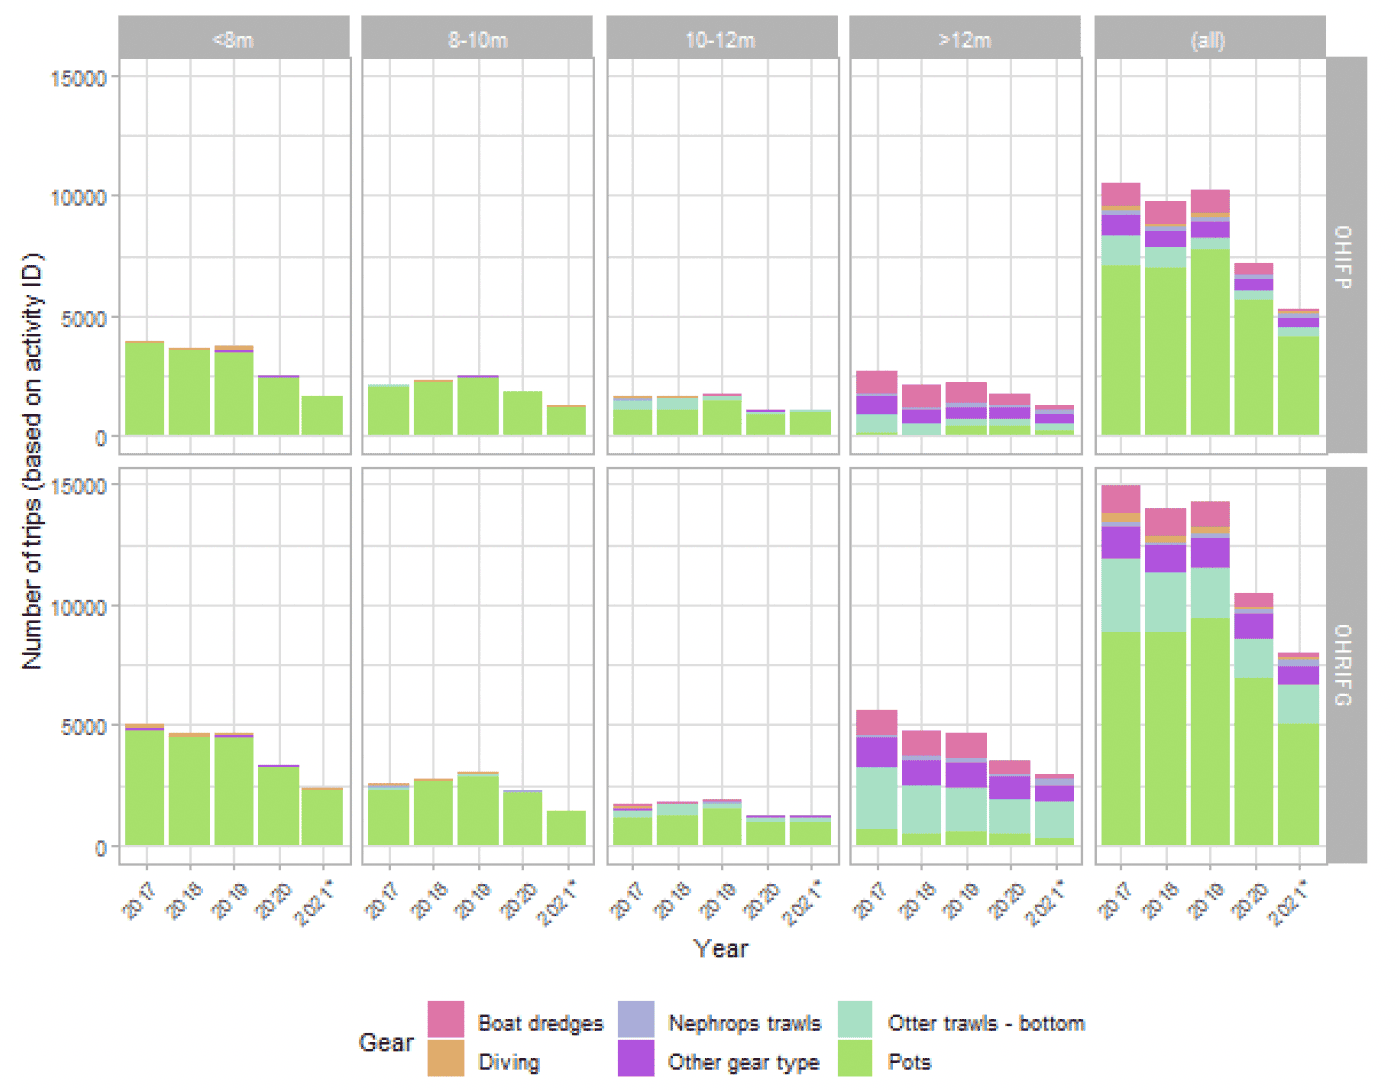
The most common gear reported in the OHRIFG and OHIFP areas are creels (Figure 3). The majority of trips for vessels smaller than 12 metres have creels as reported gear type. Vessels larger than 12 metres mainly use otter trawls, boat dredges and other gear types.
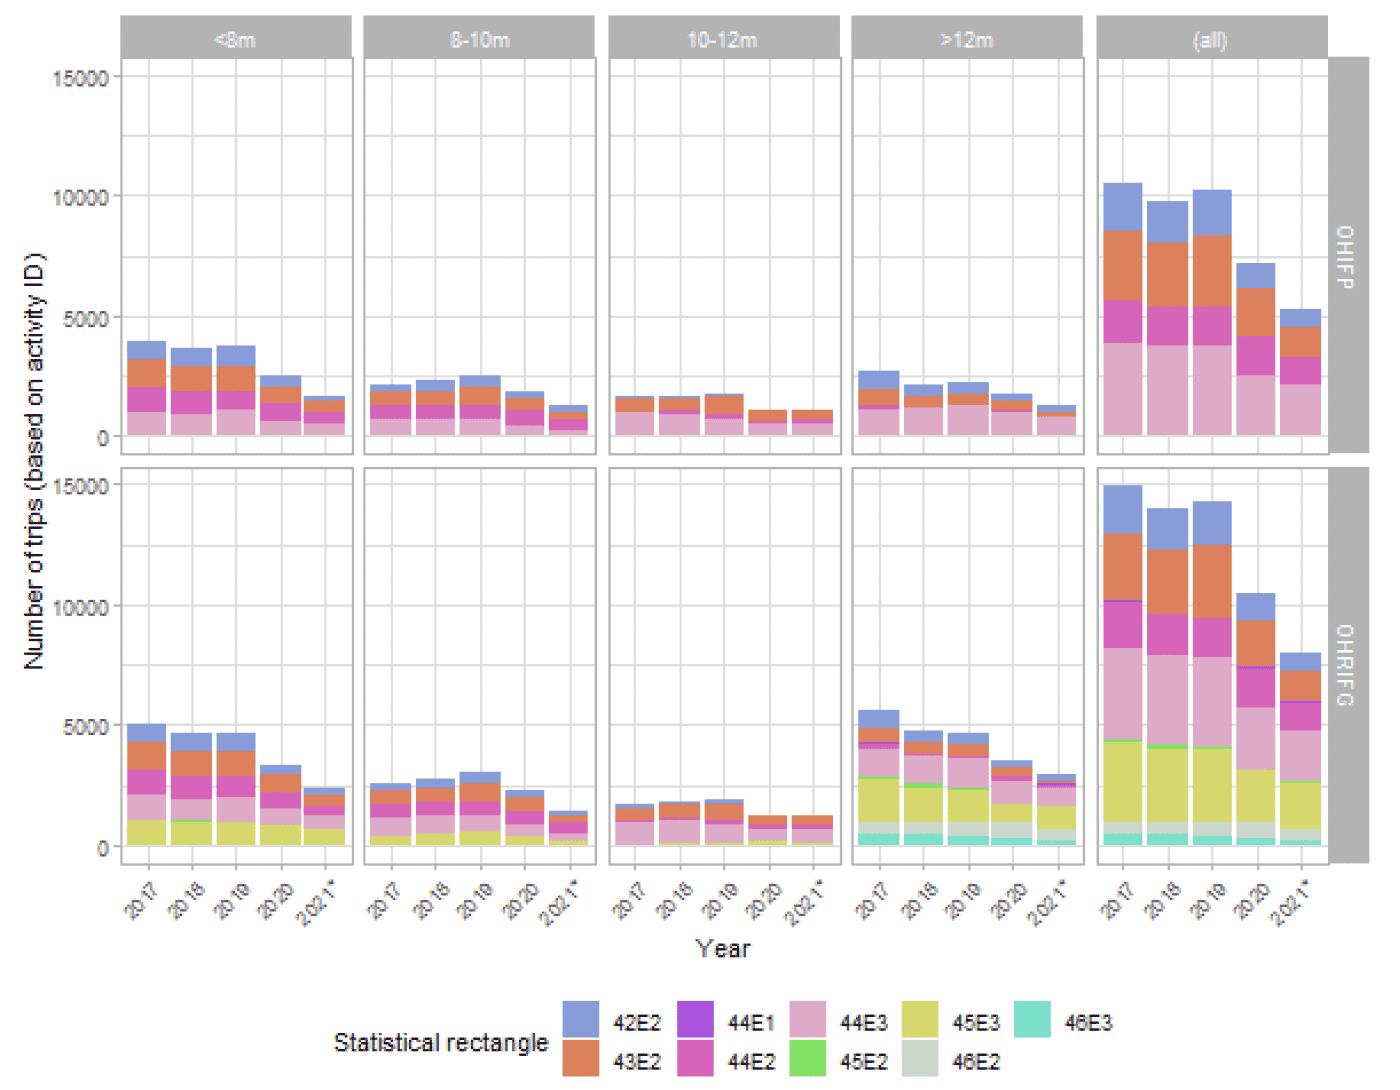
In the OHIFP area, the most commonly reported ICES rectangles fished are 44E3 and 43E2, followed by 44E2 and 42E2 (Figure 3). Vessels smaller than 12 metres mainly fish in the four ICES rectangles corresponding to the Pilot area, as well as 45E3. Vessels larger than 12 metres fish in the same rectangles and 46E2 and 46E3.
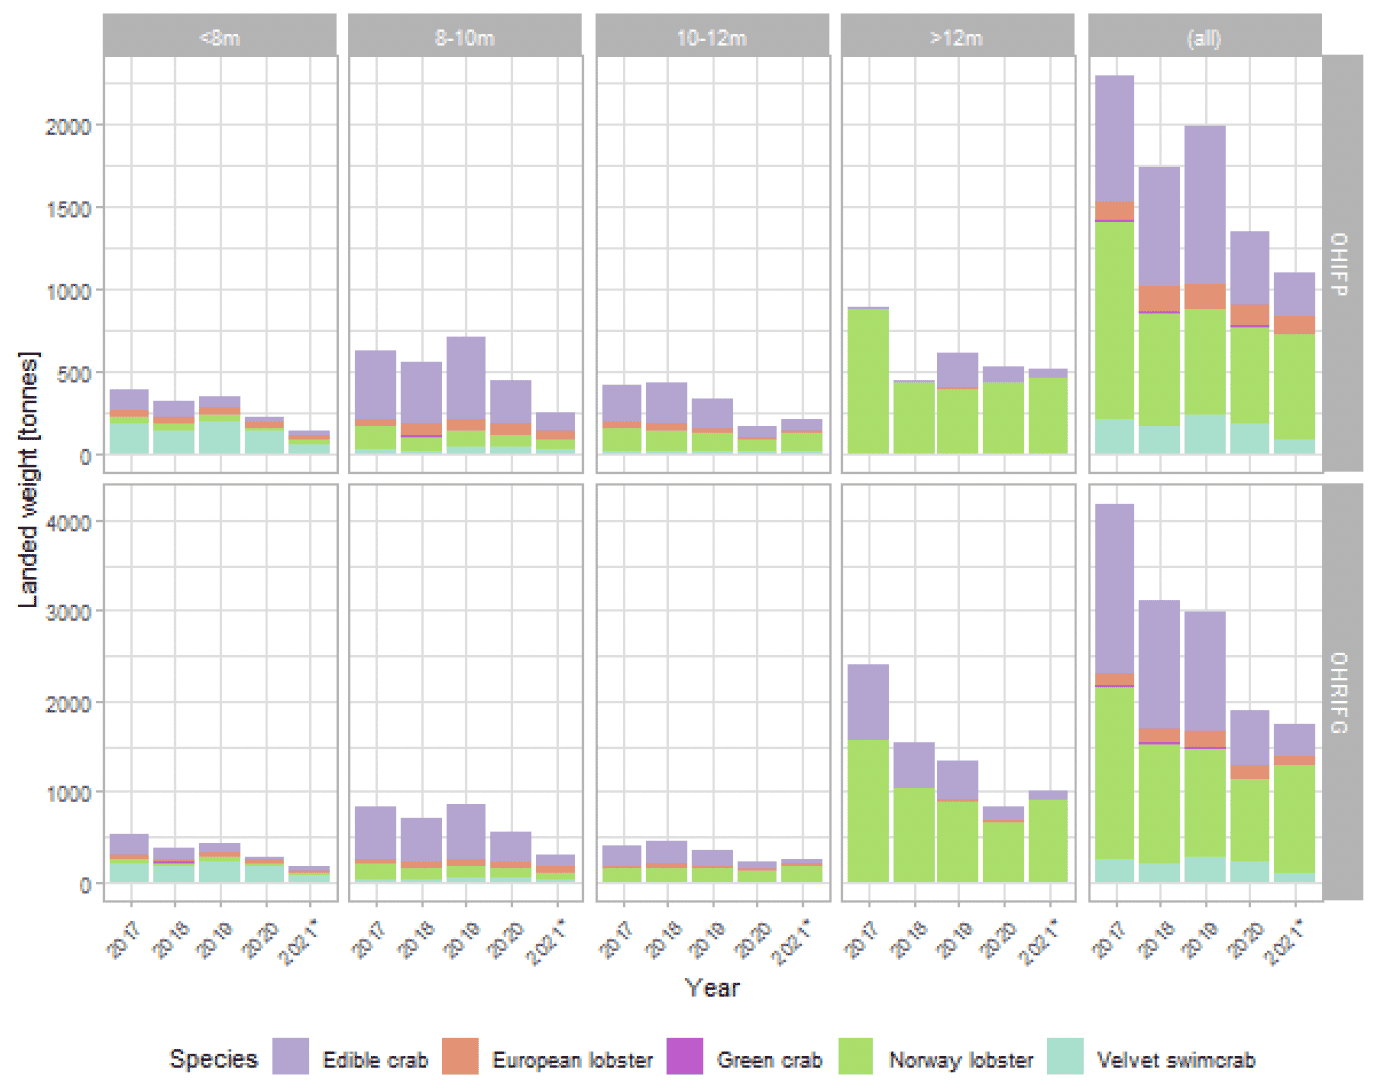
The highest recorded landed shellfish species by weight are edible crab and Norway lobster in both areas (Figure 5). The total landed weight of edible crab has decreased over the years from 2017 to 2020 (note that 2021 is based on provisional and incomplete data).
Vessels smaller than 8 metres in length mainly land velvet crab and edible crab, vessels between 8 and 10 metres, edible crab vessels 10 to 12 metres edible crab and Norway lobster (2020) and vessels larger than 12 metres typically land Norway lobster and edible crab.
4.2 Landings Per Unit Effort (LPUE)
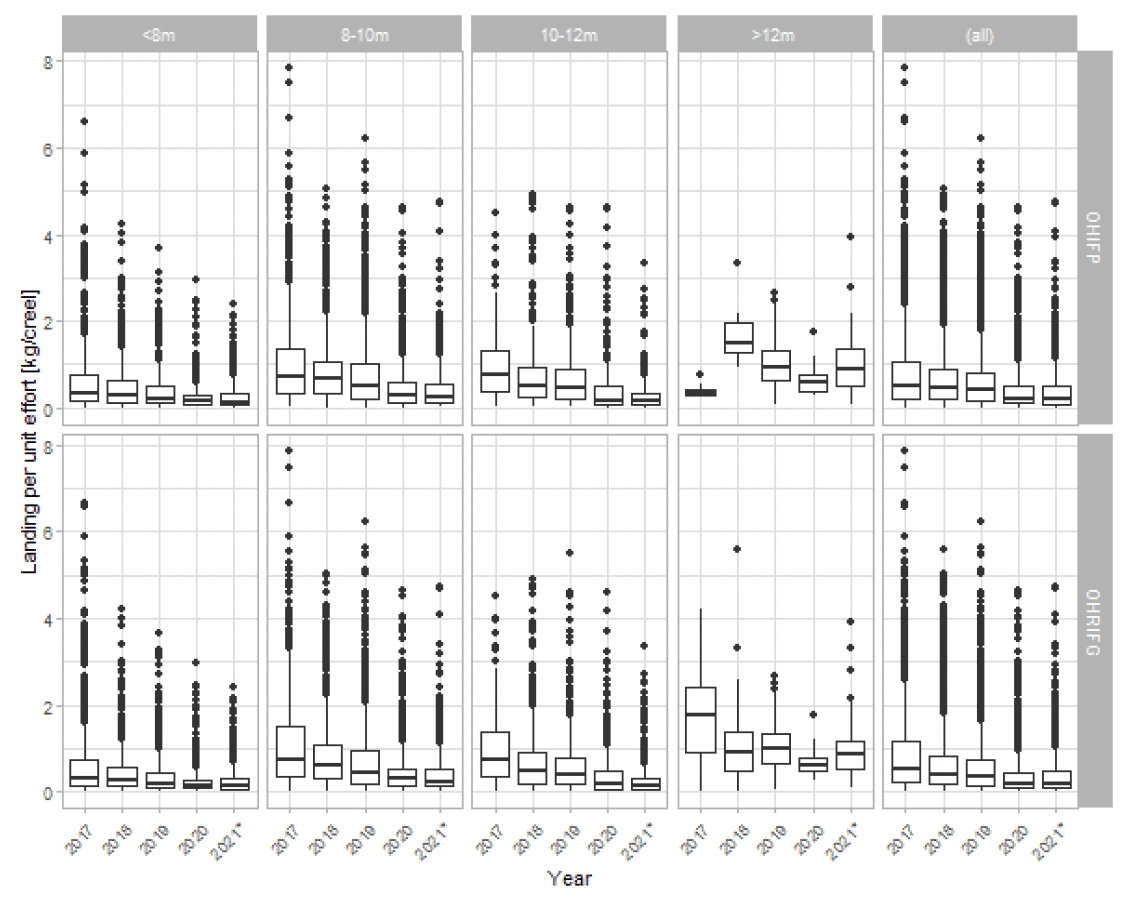
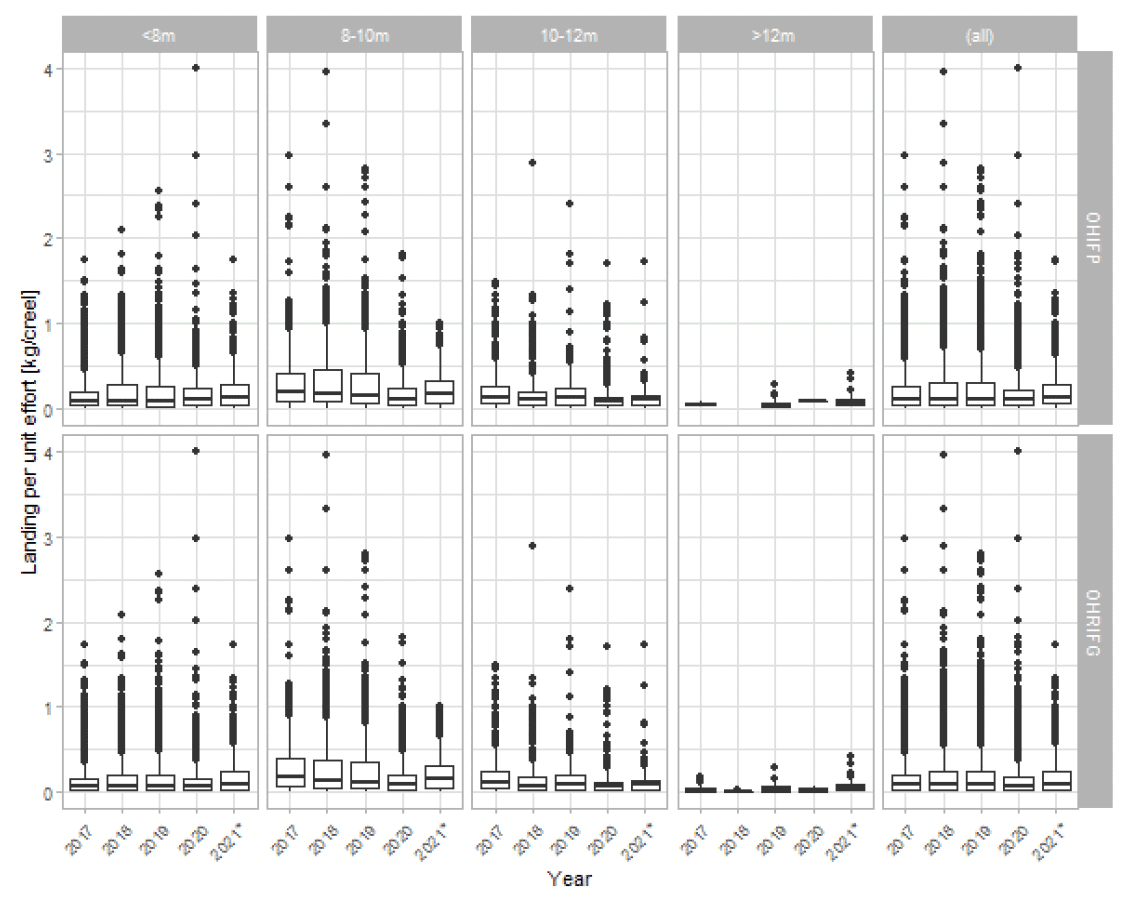
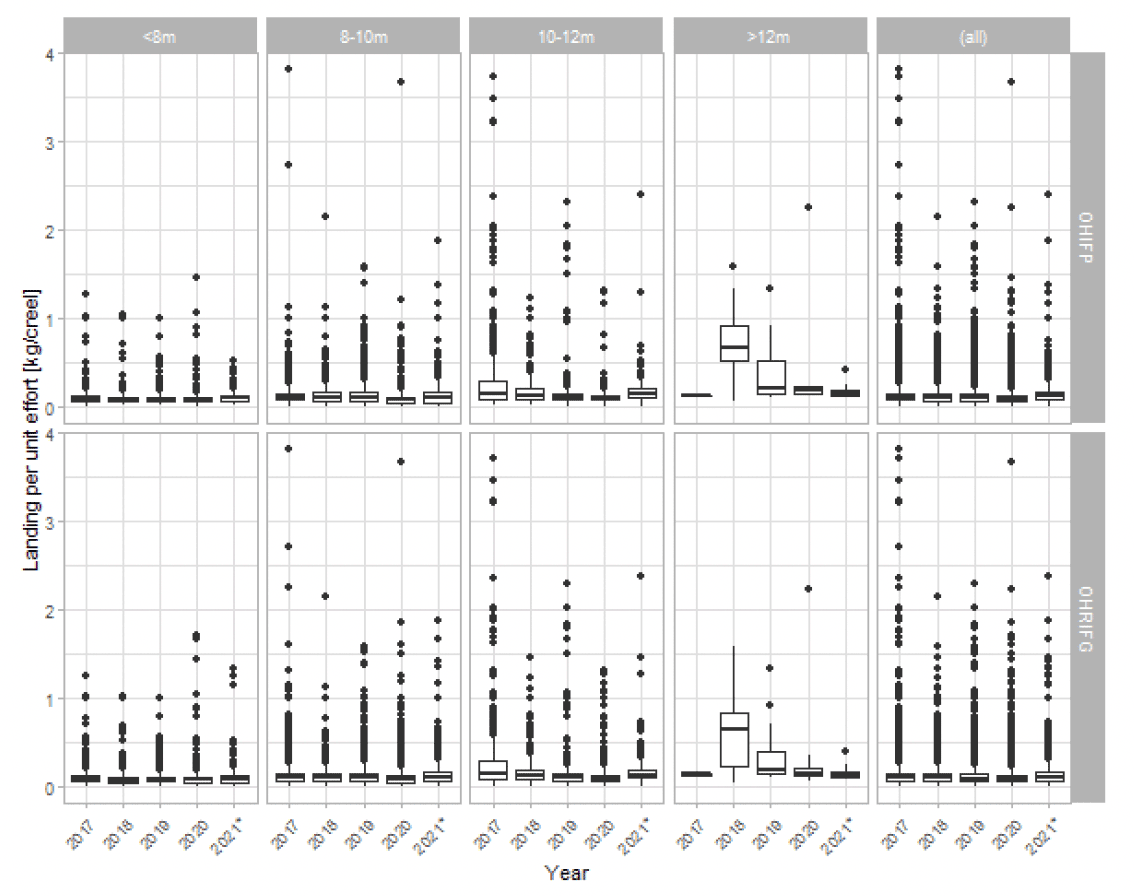
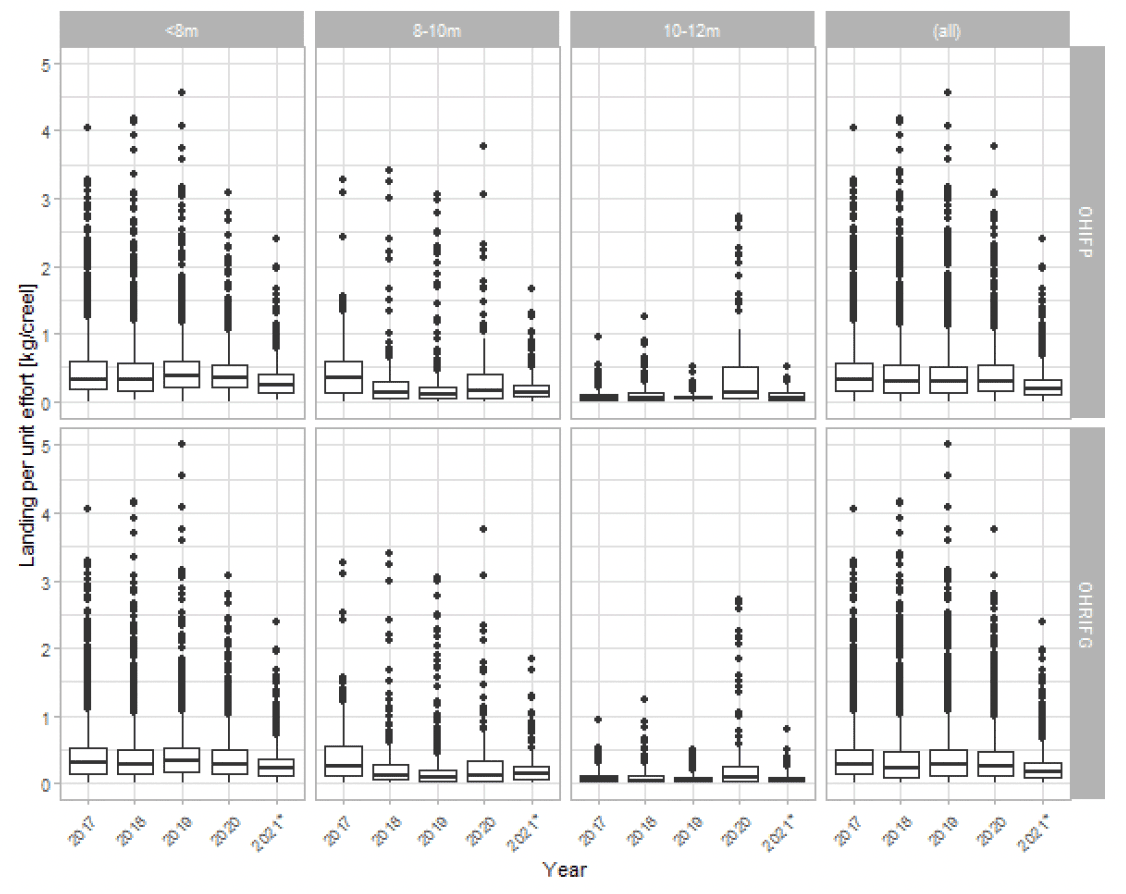
The LPUE was calculated as the ratio of the live weight and the number of creels hauled for each entry (row) in the dataset. The LPUE broken down by year and vessel length category for edible crab (Figure 6), European lobster (Figure 7), Norway lobster (Figure 8) and velvet crab (Figure 9) are shown below.
Edible crab has the highest LPUE among all five shellfish species (up to 8 kg/creel). The LPUE of edible crab has decreased over the years from a median of 0.54 kg/creel across all vessel length categories in 2017 to 0.21 kg/creel in 2020.
The LPUEs of European lobster and Norway lobster have also decreased slightly from 0.1 kg/creel in 2017 to 0.08 kg/creel for both species in 2020.
The LPUE of velvet crab has decreased from a median of 0.3 kg/creel in 2017 to 0.28 kg/creel in 2020.
4.3 Vessels with Trackers
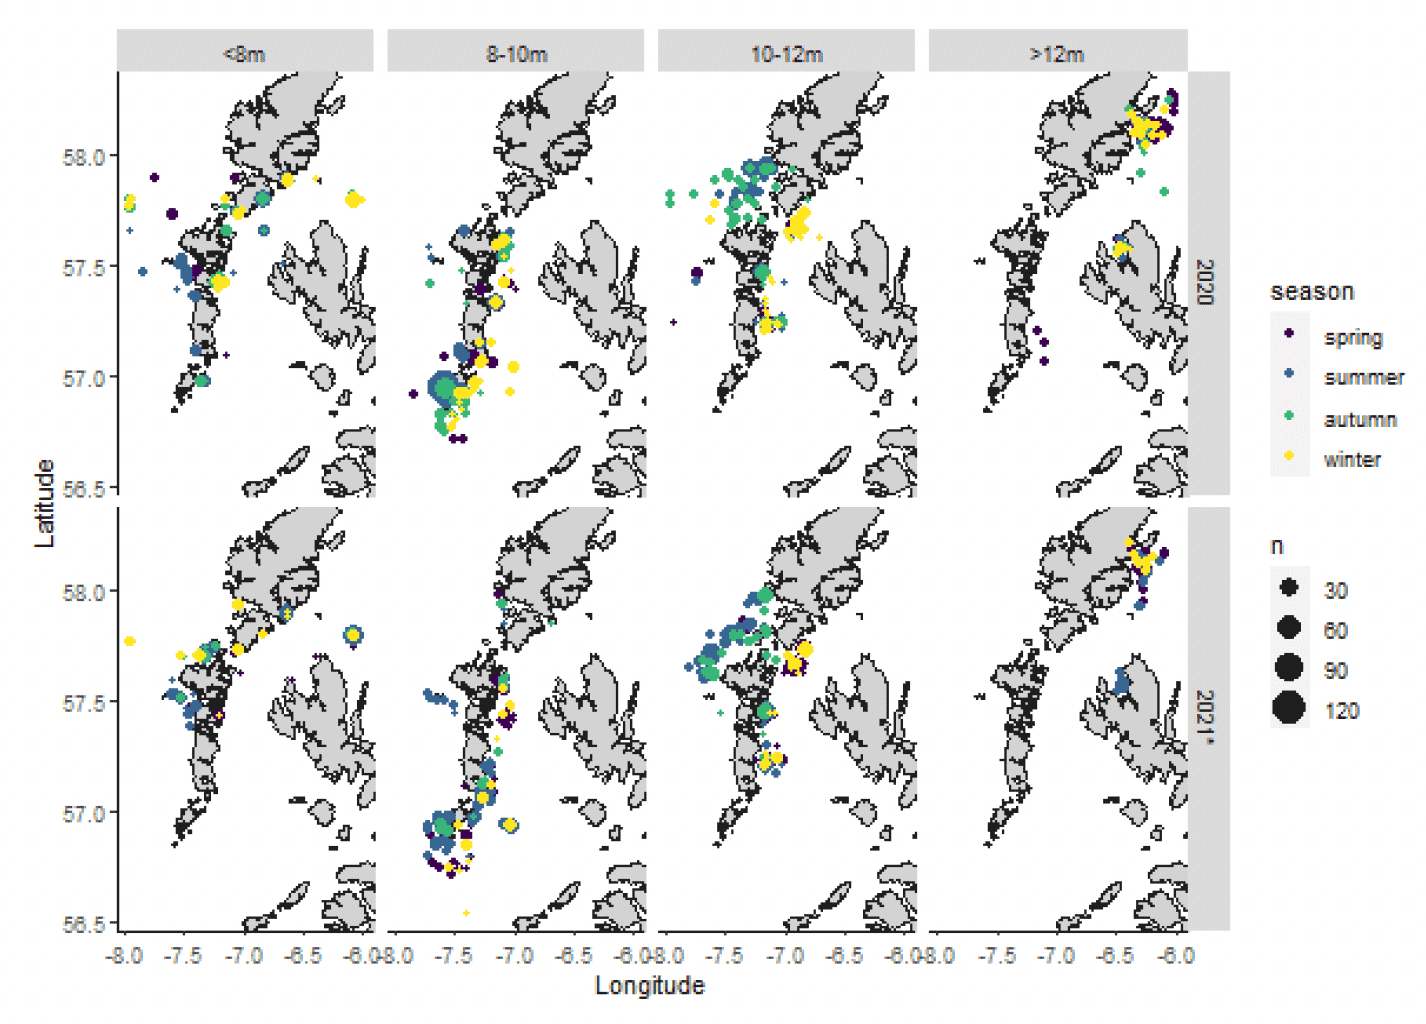
Figure 10 shows the spatial coordinates (as reported on FISH1 forms) of vessels fitted with trackers in 2020 and 2021 (spatial data for years 2017-2019 not available). Note that the coordinates for 2021 are provisional and incomplete. It is evident that each vessel length category uses distinctive fishing grounds. Vessels smaller than 8 metres fish close to land and mainly around North and South Uist. Vessels 8 to 10 metres are concentrated east and south of North and South Uist. Vessels 10 to 12 metres fish further from land in the area between North Uist and Harris. There is also fishing activity in the east of the islands in the winter and spring months and west of the islands in the summer and autumn months. Vessels larger than 12 metres in length tend to fish east of Lewis and west of Skye.
4.4 Notes
Number of creels hauled and total number of creels deployed/fishing
For most of the entries, the number of creels hauled should be a subset of the total number deployed/fishing. In certain circumstances, the number hauled might be higher than the total number deployed. This would typically be if they are hauled, baited and shot more than once in a day. Such situations might include the summer fishery where Nephrops enter the creels at a much quicker rate and also fishing businesses that do not have the resources to invest in more creels and so work the gear they do have more intensively.
Date of landing
Fishers might always land on a certain day of the week and this could potentially explain a gap between the voyage end date and date of landing. This is typical behaviour for shellfish operations as the catch can easily be retained alive and then landed in bulk.
Parlour creels
Some vessels use parlour creels, which can hold a higher catch than the traditional creels used in the OHRIFG area. Fishers use fewer creels and report a higher catch (higher LPUE) when using parlour creels. This distinction in type of creel used only became clear at the OHRIFG meeting on 3 December 2021. There is no field in the FISH1 form to make a distinction between the type of pot used. Consequently, no distinction between traditional and parlour creels has been made in the analyses of this report. This may mean that the LPUE presented here is skewed. Based on the number of trips with less than 40 creels reported, we suspect that ~4.6% of trips per year with gear type stated as "creels", may actually be parlour creels. However, these numbers have not been confirmed to date.
Contact
Email: inshore@gov.scot