National Test Programme - testing actions for sustainable farming phase one: survey report
Testing actions for sustainable farming phase 1 survey was to understand the current state of the uptake of sustainable farming practices and motivations/barriers for farmers and crofters to inform phase 2 of the National Test Programme.
2. Survey Answer Analysis
2.1 Survey Analysis - Overview
All figures below are a combination farmers and crofters who have completed the survey. A total of 803 farmers and 174 crofters completed the survey, which included 106 reactive volunteers. 125 respondents are Women in Agriculture and 84 participants identified as a Young Farmer (<41 years in age).
Not all questions were answered by each participant as the survey was designed to allow livestock and mixed enterprises to answer all sections whilst businesses which are solely arable answered the carbon audit, soil analysis, nutrient management, manure analysis and biodiversity sections. This means when analysing the answers of the survey we must take into account that each question will not have 977 respondents. As the business type was one of the stratification methods in which the target for the survey was based, the enterprise types provided by the respondents was cross checked with the Agricultural Census 2021 data to ensure the information supplied correlated with the Census. As part of the survey, respondents were allowed to pick as many enterprise types as they deemed fit to describe their business. The census data categorised each business by its predominant enterprise type (more than two thirds of the business).
Figure 6 shows the percentage of respondents undertaking actions covered in the survey i.e. specific audits, analysis or plans (Table 6 highlights the raw data of survey responses).
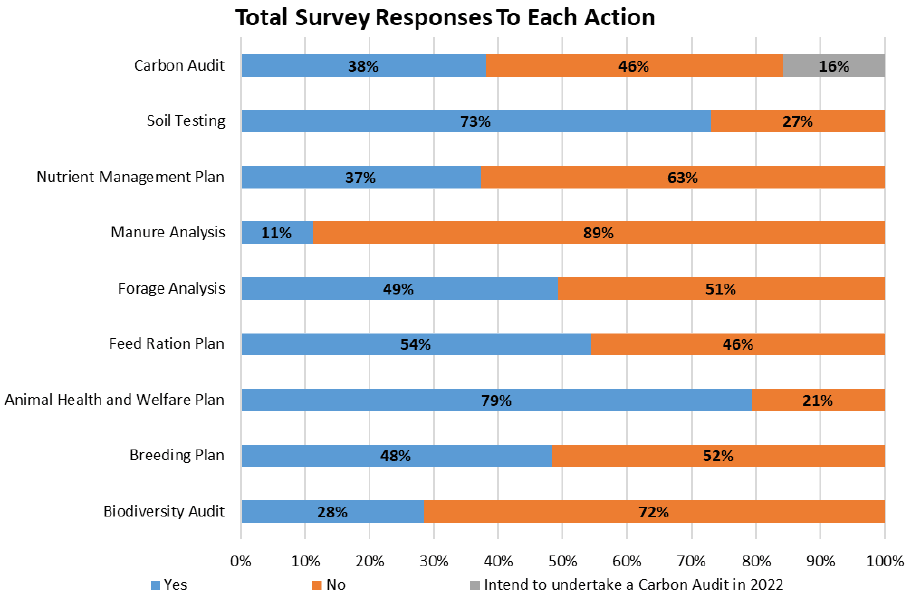
| Action Type | Yes | No | Total |
|---|---|---|---|
| Carbon Audit | 372 | 451 *154 respondents intend to undertake a Carbon Audit in 2022 but have not yet done so at the time of completing the survey. | 977 |
| Soil Testing | 713 | 264 | 977 |
| Nutrient Management Plan | 365 | 612 | 977 |
| Manure Analysis | 110 | 867 | 977 |
| Forage Analysis | 445 | 459 | 904 |
| Feed Ration Plan | 492 | 411 | 903 |
| Animal Health and Welfare Plan | 716 | 186 | 902 |
| Breeding Plan | 435 | 464 | 899 |
| Biodiversity Audit | 278 | 699 | 977 |
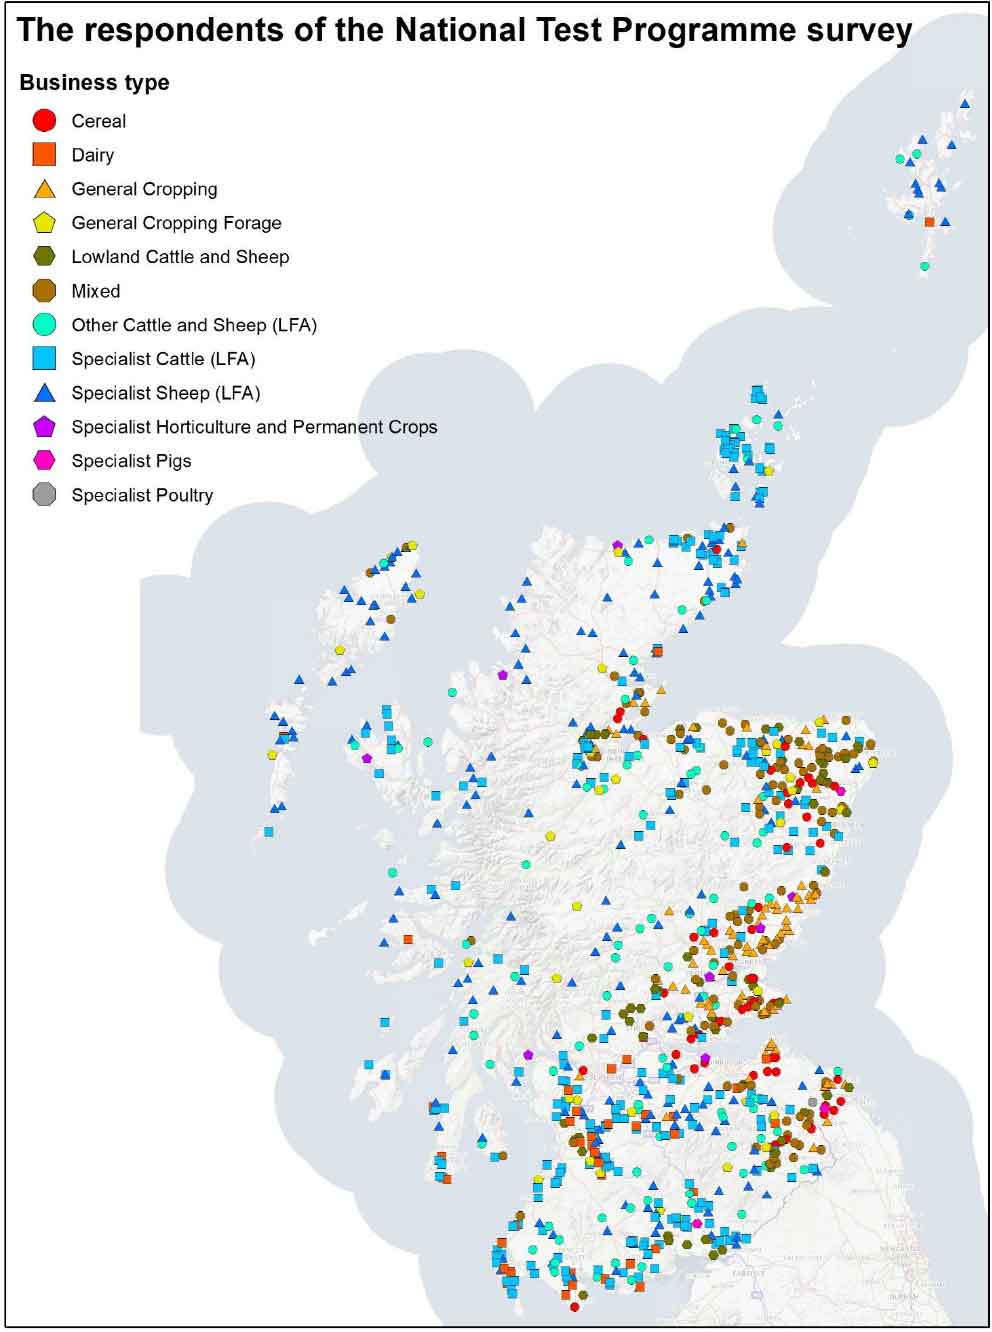
Figure 7 presents the geographic spread of survey respondents across Scotland. Each business type is represented by a different coloured shape. Cereal and Mixed farms which took part in the survey are found mostly in the eastern area of Scotland whilst Specialist Sheep and Specialist Cattle businesses are located across Scotland, though they are characteristic of the Highland & Islands. As part of the stratification methodology, Scotland was divided into five NUTS2 regions. Table 7 and Table 8 break down the total number of respondents by NUTS2 region against business type and SLR banding.
| Business Type | Eastern Scotland | Highlands & Islands | North East Scotland | South Scotland | West Central Scotland |
|---|---|---|---|---|---|
| Cereal (51) | 26 | 4 | 11 | 9 | 1 |
| 51.0% | 7.8% | 21.6% | 17.6% | 2.0% | |
| Dairy (43) | 3 | 7 | 0 | 30 | 3 |
| 7.0% | 16.3% | 0% | 69.8% | 7.0% | |
| General Cropping (81) | 49 | 10 | 13 | 8 | 1 |
| 60.5% | 12.3% | 16.0% | 9.9% | 1.2% | |
| General Cropping - Forage (39) | 4 | 15 | 7 | 13 | 0 |
| 10.3% | 38.5% | 17.9% | 33.3% | 0.0% | |
| Lowland Cattle & Sheep (58) | 17 | 8 | 15 | 18 | 0 |
| 29.3% | 13.8% | 25.9% | 31.0% | 0.0% | |
| Mixed (115) | 36 | 27 | 33 | 19 | 0 |
| 23.2% | 17.4% | 21.3% | 12.3% | 0.0% | |
| Other Cattle & Sheep (LFA) (95) | 17 | 38 | 4 | 34 | 2 |
| 17.9% | 40.0% | 4.2% | 35.8% | 2.1% | |
| Specialist Cattle (LFA) (255) | 18 | 109 | 24 | 96 | 8 |
| 7.1% | 42.7% | 9.4% | 37.6% | 3.1% | |
| Specialist horticulture & permanent crops (8) | 3 | 4 | 1 | 0 | 0 |
| 37.5% | 50.0% | 12.5% | 0.0% | 0.0% | |
| Specialist Pigs (3) | 0 | 0 | 1 | 2 | 0 |
| 0.0% | 0.0% | 33.3% | 66.7% | 0.0% | |
| Specialist Poultry (2) | 0 | 1 | 0 | 1 | 0 |
| 0.0% | 50.0% | 0.0% | 50.0% | 0.0% | |
| Specialist Sheep (LFA) (210) | 20 | 126 | 10 | 50 | 4 |
| 9.5% | 60.0% | 4.8% | 23.8% | 1.9% | |
| Unknown Business Type (17) | 0 | 10 | 3 | 3 | 1 |
| 0.0% | 58.8% | 17.6% | 17.6% | 5.9% | |
| Total (977)[12] | 193 | 359 | 122 | 283 | 19 |
| 19.8% | 36.7% | 12.5% | 29.0% | 1.9% |
| SLR Band | Eastern Scotland | Highlands & Islands | North East Scotland | South Scotland | West Central Scotland |
|---|---|---|---|---|---|
| 0 - <0.25 FTE (Extremely Small) (174) | 11 | 107 | 19 | 36 | 1 |
| 6.3% | 61.5% | 10.9% | 20.7% | 0.6% | |
| 0.25 - <1 FTE (Very Small) (155) | 21 | 73 | 29 | 26 | 6 |
| 13.5% | 47.1% | 18.7% | 16.8% | 3.9% | |
| 1 - <2 FTE (Small) (130) | 31 | 51 | 12 | 33 | 3 |
| 23.8% | 39.2% | 9.2% | 25.4% | 2.3% | |
| 2 - <3 FTE (Medium) (99) | 19 | 31 | 16 | 29 | 4 |
| 19.2% | 31.3% | 16.2% | 29.3% | 4.0% | |
| 3 - <5 FTE (Large) (155) | 38 | 41 | 17 | 58 | 1 |
| 24.5% | 26.5% | 11.0% | 37.4% | 0.6% | |
| 5 or more FTE (Very Large) (251) | 73 | 48 | 26 | 100 | 4 |
| 29.1% | 19.1% | 10.4% | 39.8% | 1.6% | |
| Unknown SLR (13)[13] | 0 | 8 | 3 | 1 | 0 |
| 0.0% | 61.5% | 23.1% | 7.7% | 0.0% | |
| Total (977) 13 | 193 | 359 | 122 | 283 | 19 |
| 19.8% | 36.7% | 12.5% | 29.0% | 1.9% |
Figure 8 and Figure 9 identify the different business types across Scotland that conduct management actions outlined in this survey. The total response rate (denominator) for each business type can be seen in brackets under each of the business type titles along the vertical axis (Table 9 highlights the raw data of survey responses).
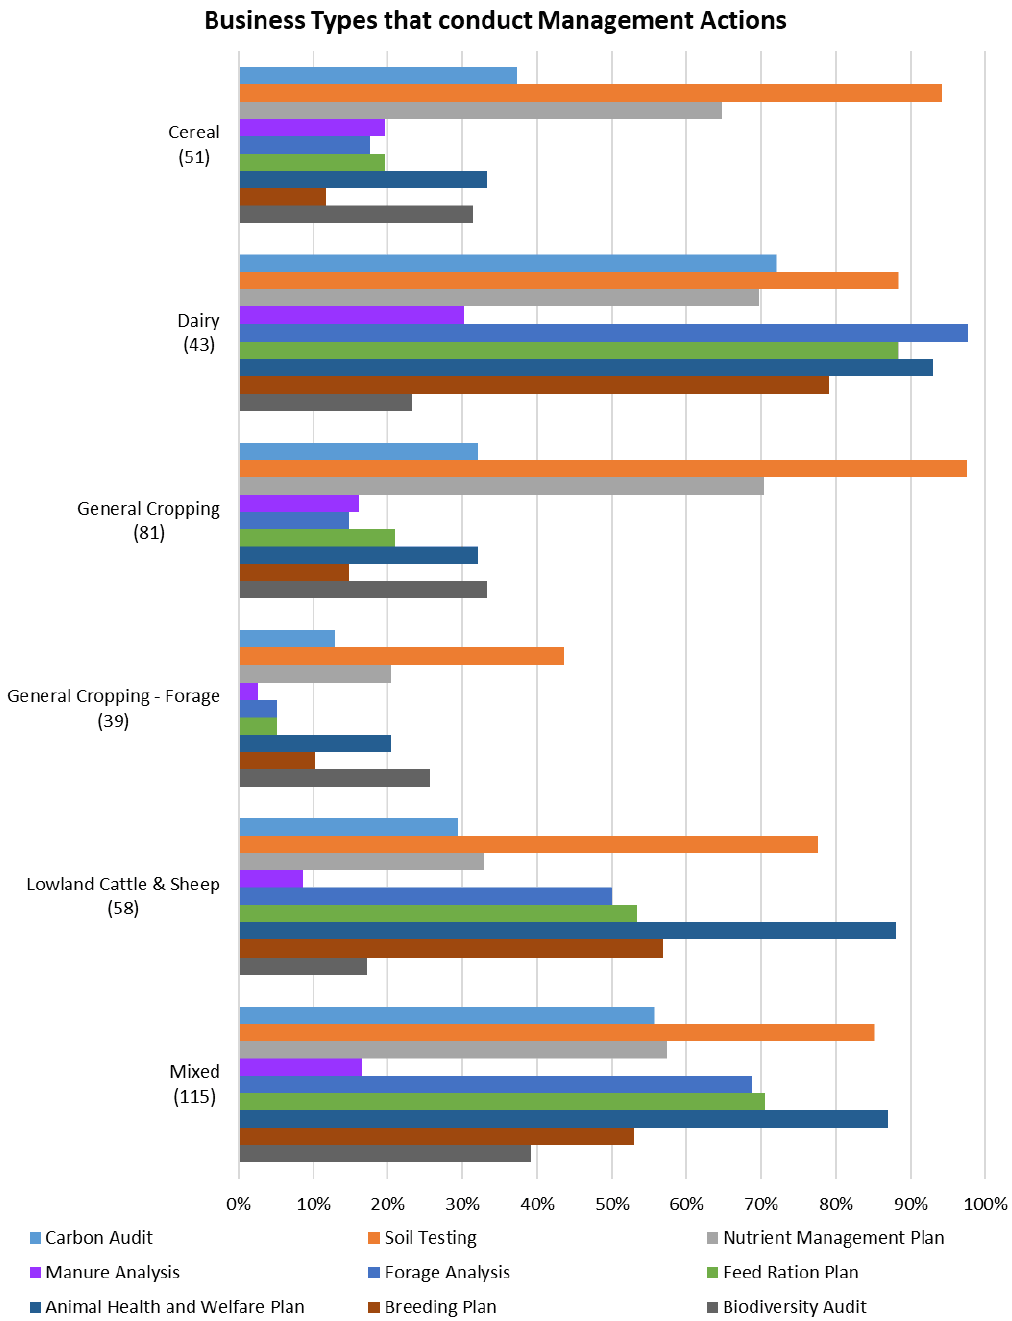
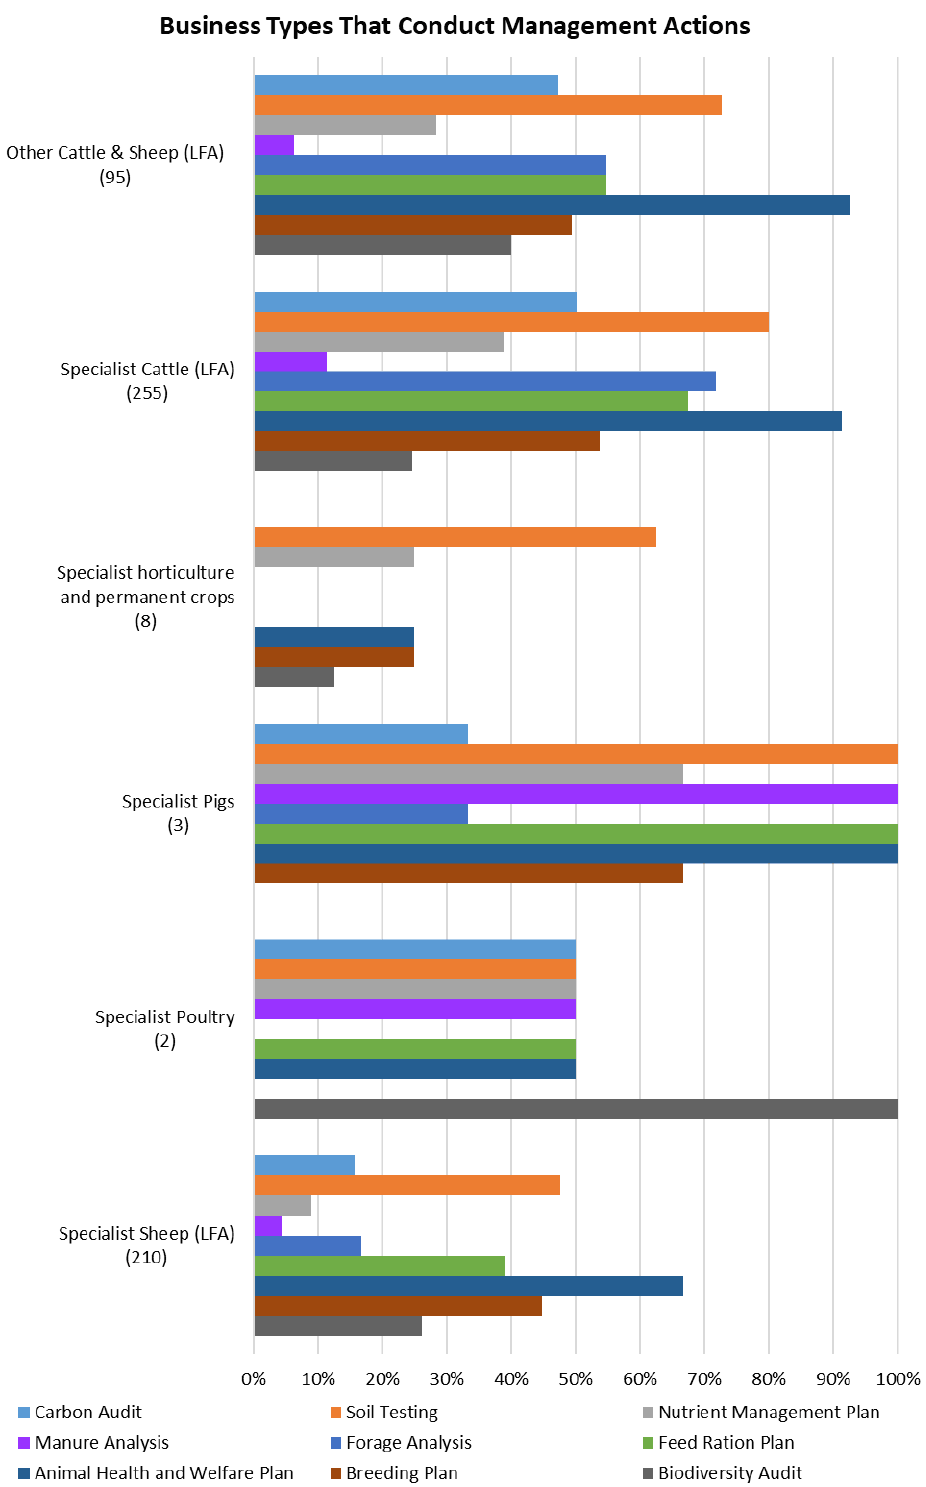
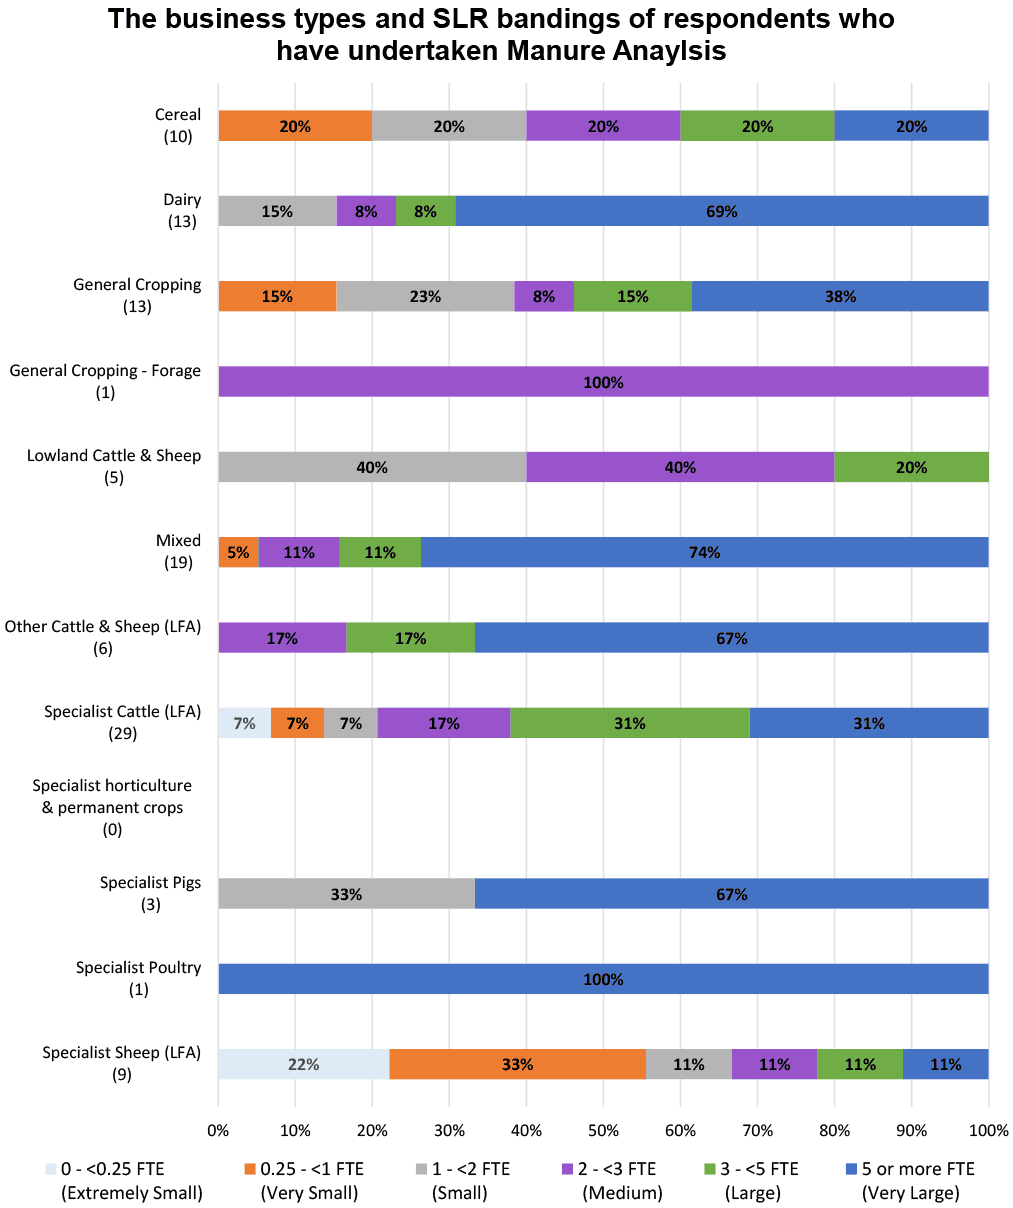
Soil Testing and Animal Health and Welfare Plans appear to be the most common practices across all enterprise types. Manure Analysis is the least common practice across all enterprise types. Specialised business types appear to undertake less management actions in comparison to businesses that focus on dairy or mixed enterprises.
| Business Type | Carbon Audit | Soil Testing | Nutrient Management Plan | Manure Analysis | Forage Analysis | Feed Ration Plan | Animal Health & Welfare Plan | Breeding Plan | Biodiversity Audit |
|---|---|---|---|---|---|---|---|---|---|
| Cereal (51) | 19 | 48 | 33 | 10 | 9 | 10 | 17 | 6 | 16 |
| 37.3% | 94.1% | 64.7% | 19.6% | 17.6% | 19.6% | 33.3% | 11.8% | 31.4% | |
| Dairy (43) | 31 | 38 | 30 | 13 | 42 | 38 | 40 | 34 | 10 |
| 72.1% | 88.4% | 69.8% | 30.2% | 97.7% | 88.4% | 93.0% | 79.1% | 23.3% | |
| General Cropping (81) | 26 | 79 | 57 | 13 | 12 | 17 | 26 | 12 | 27 |
| 32.1% | 97.5% | 70.4% | 16.0% | 14.8% | 21.0% | 32.1% | 14.8% | 33.3% | |
| General Cropping - Forage (39) | 5 | 17 | 8 | 1 | 2 | 2 | 8 | 4 | 10 |
| 12.8% | 43.6% | 20.5% | 2.6% | 5.1% | 5.1% | 20.5% | 10.3% | 25.6% | |
| Lowland Cattle & Sheep (58) | 17 | 45 | 19 | 5 | 29 | 31 | 51 | 33 | 10 |
| 29.3% | 77.6% | 32.8% | 8.6% | 50.0% | 53.4% | 87.9% | 56.9% | 17.2% | |
| Mixed (115) | 64 | 98 | 66 | 19 | 79 | 81 | 100 | 61 | 45 |
| 55.7% | 85.2% | 57.4% | 16.5% | 68.7% | 70.4% | 87.0% | 53.0% | 39.1% | |
| Other Cattle & Sheep (LFA) (95) | 45 | 69 | 27 | 6 | 52 | 52 | 88 | 47 | 38 |
| 47.4% | 72.6% | 28.4% | 6.3% | 54.7% | 54.7% | 92.6% | 49.5% | 40.0% | |
| Specialist Cattle (LFA) (255) | 128 | 204 | 99 | 29 | 183 | 172 | 233 | 137 | 63 |
| 50.2% | 80.0% | 38.8% | 11.4% | 71.8% | 67.5% | 91.4% | 53.7% | 24.7% | |
| Specialist horticulture & permanent crops (8) | 0 | 5 | 2 | 0 | 0 | 0 | 2 | 2 | 1 |
| 0.0% | 62.5% | 25.0% | 0.0% | 0.0% | 0.0% | 25.0% | 25.0% | 12.5% | |
| Specialist Pigs (3) | 1 | 3 | 2 | 3 | 1 | 3 | 3 | 2 | 0 |
| 33.3% | 100.0% | 66.7% | 100.0% | 33.3% | 100.0% | 100.0% | 66.7% | 0.0% | |
| Specialist Poultry (2) | 1 | 1 | 1 | 1 | 0 | 1 | 1 | 0 | 2 |
| 50.0% | 50.0% | 50.0% | 50.0% | 0.0% | 50.0% | 50.0% | 0.0% | 100.0% | |
| Specialist Sheep (LFA) (210) | 33 | 100 | 19 | 9 | 35 | 82 | 140 | 94 | 55 |
| 15.7% | 47.6% | 9.0% | 4.3% | 16.7% | 39.0% | 66.7% | 44.8% | 26.2% | |
| Unknown Business Type (17) | 2 | 6 | 2 | 1 | 1 | 3 | 7 | 3 | 1 |
| 11.8% | 35.3% | 11.8% | 5.9% | 5.9% | 17.6% | 41.2% | 17.6% | 5.9% | |
| Total (977) | 372 | 713 | 365 | 110 | 445 | 492 | 716 | 435 | 278 |
| 38.1% | 73.0% | 37.4% | 11.3% | 45.5% | 50.4% | 73.3% | 44.5% | 28.5% |
Figure 10 below identifies the percentage of businesses with a small to large Standard Labour Requirement (SLR) banding that conduct the various management actions outlined in the survey. The total response rate (denominator) for each SLR banding can be seen in brackets under each of the SLR band titles along the vertical axis (Table 10 highlights the raw data of survey responses).
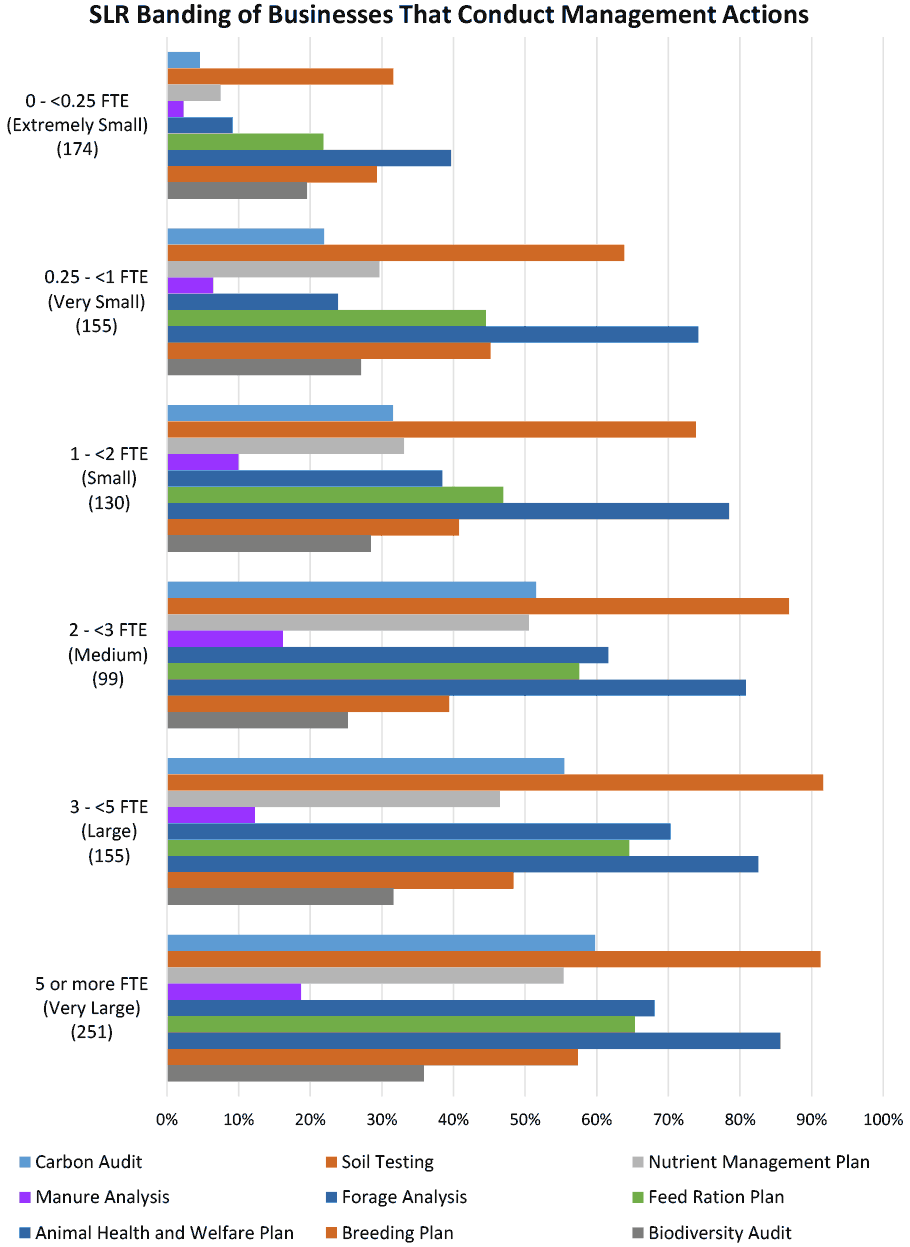
Soil Testing and Animal Health and Welfare Plans appear to be the most common practices across all SLR bands. Manure Analysis is the least common practice across all SLR bands. There is a trend between management actions taken and the size of the business. The smaller the enterprise as measured by labour input the less likely the business is to undertake management actions, the bigger the enterprise as measured by labour input the more likely the business is to undertake management actions. Although undertaking a Biodiversity Audit appears to be of equal importance no matter the size of the business.
| SLR Band | Carbon Audit | Soil Testing | Nutrient Management Plan | Manure Analysis | Forage Analysis | Feed Ration Plan | Animal Health & Welfare Plan | Breeding Plan | Biodiversity Audit |
|---|---|---|---|---|---|---|---|---|---|
| 0 - <0.25 FTE (Extremely Small) (174) | 9 | 37 | 12 | 3 | 11 | 29 | 50 | 36 | 26 |
| 8.6% | 35.2% | 11.4% | 2.9% | 10.5% | 27.6% | 47.6% | 34.3% | 24.8% | |
| 0.25 - <1 FTE (Very Small) (155) | 54 | 120 | 56 | 20 | 61 | 82 | 129 | 77 | 51 |
| 29.2% | 64.9% | 30.3% | 10.8% | 33.0% | 44.3% | 69.7% | 41.6% | 27.6% | |
| 1 - <2 FTE (Small) (130) | 36 | 95 | 36 | 7 | 47 | 56 | 98 | 54 | 41 |
| 27.5% | 72.5% | 27.5% | 5.3% | 35.9% | 42.7% | 74.8% | 41.2% | 31.3% | |
| 2 - <3 FTE (Medium) (99) | 47 | 84 | 48 | 13 | 52 | 61 | 85 | 46 | 25 |
| 44.8% | 80.0% | 45.7% | 12.4% | 49.5% | 58.1% | 81.0% | 43.8% | 23.8% | |
| 3 - <5 FTE (Large) (155) | 82 | 157 | 77 | 22 | 113 | 106 | 138 | 86 | 58 |
| 45.3% | 86.7% | 42.5% | 12.2% | 62.4% | 58.6% | 76.2% | 47.5% | 32.0% | |
| 5 or more FTE (Very Large) (251) | 141 | 213 | 133 | 44 | 159 | 152 | 208 | 131 | 77 |
| 54.9% | 82.9% | 51.8% | 17.1% | 61.9% | 59.1% | 80.9% | 51.0% | 30.0% | |
| Unknown SLR (13) | 3 | 7 | 3 | 1 | 2 | 6 | 8 | 5 | 0 |
| 23.1% | 53.8% | 23.1% | 7.7% | 15.4% | 46.2% | 61.5% | 38.5% | 0.0% | |
| Total (977) | 372 | 713 | 365 | 110 | 445 | 492 | 716 | 435 | 278 |
| 38.1% | 73.0% | 37.4% | 11.3% | 45.5% | 50.4% | 73.3% | 44.5% | 28.5% |
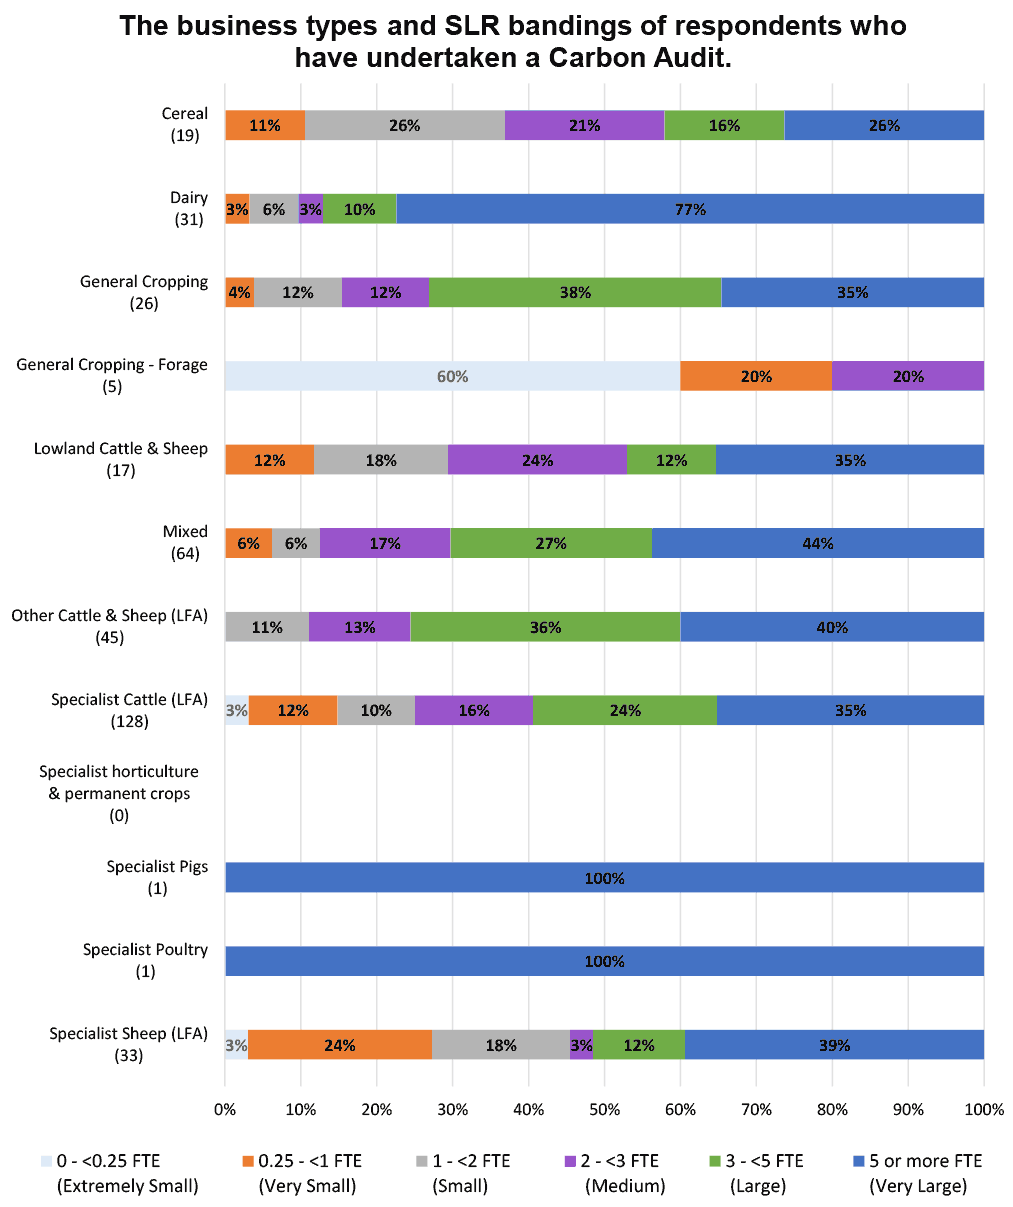
Each bar in Figure 11 below shows the estimated percentage share by farm size of all carbon audits undertaken by a given farm type. The total number of carbon audits (denominator) for each farm type is shown in brackets along the vertical axis. For example, of the 19 reported carbon audits undertaken by cereal farms, 26% were undertaken by very large cereal farms. This does not, however, necessarily imply that 26% of very large cereal farms undertake carbon audits. Table 11 shows the supporting data values.
| Business Type | 0 - <0.25 FTE (Extremely Small) | 0.25 - <1 FTE (Very Small) | 1 - <2 FTE (Small) | 2 - <3 FTE (Medium) | 3 - <5 FTE (Large) | 5 or more FTE (Very Large) | Unknown SLR |
|---|---|---|---|---|---|---|---|
| Cereal (19) | 0 | 2 | 5 | 4 | 3 | 5 | 0 |
| 0.0% | 10.5% | 26.3% | 21.1% | 15.8% | 26.3% | 0.0% | |
| Dairy (31) | 0 | 1 | 2 | 1 | 3 | 24 | 0 |
| 0.0% | 3.2% | 6.5% | 3.2% | 9.7% | 77.4% | 0.0% | |
| General Cropping (26) | 0 | 1 | 3 | 3 | 10 | 9 | 0 |
| 0.0% | 3.8% | 11.5% | 11.5% | 38.5% | 34.6% | 0.0% | |
| General Cropping - Forage (5) | 3 | 1 | 0 | 1 | 0 | 0 | 0 |
| 60.0% | 20.0% | 0.0% | 20.0% | 0.0% | 0.0% | 0.0% | |
| Lowland Cattle & Sheep (17) | 0 | 2 | 3 | 4 | 2 | 6 | 0 |
| 0.0% | 11.8% | 17.6% | 23.5% | 11.8% | 35.3% | 0.0% | |
| Mixed (64) | 0 | 4 | 4 | 11 | 17 | 28 | 0 |
| 0.0% | 6.3% | 6.3% | 17.2% | 26.6% | 43.8% | 0.0% | |
| Other Cattle & Sheep (LFA) (45) | 0 | 0 | 5 | 6 | 16 | 18 | 0 |
| 0.0% | 0.0% | 11.1% | 13.3% | 35.6% | 40.0% | 0.0% | |
| Specialist Cattle (LFA) (128) | 4 | 15 | 13 | 20 | 31 | 45 | 0 |
| 3.0% | 12.9% | 11.9% | 15.8% | 19.8% | 36.6% | 0.0% | |
| Specialist horticulture & permanent crops (0) | 0 | 0 | 0 | 0 | 0 | 0 | 0 |
| 0.0% | 0.0% | 0.0% | 0.0% | 0.0% | 0.0% | 0.0% | |
| Specialist Pigs (1) | 0 | 0 | 0 | 0 | 0 | 1 | 0 |
| 0.0% | 0.0% | 0.0% | 0.0% | 0.0% | 100.0% | 0.0% | |
| Specialist Poultry (1) | 0 | 0 | 0 | 0 | 0 | 1 | 0 |
| 0.0% | 0.0% | 0.0% | 0.0% | 0.0% | 100.0% | 0.0% | |
| Specialist Sheep (LFA) (33) | 1 | 8 | 6 | 1 | 4 | 13 | 0 |
| 3.0% | 24.2% | 18.2% | 3.0% | 12.1% | 39.4% | 0.0% | |
| Unknown Business Type (2) | 0 | 0 | 0 | 0 | 0 | 0 | 2 |
| 0.0% | 0.0% | 0.0% | 0.0% | 0.0% | 0.0% | 100.0% | |
| Total (372) | 8 | 34 | 41 | 51 | 86 | 150 | 2 |
| 2.2% | 9.1% | 11.0% | 13.7% | 23.1% | 40.3% | 0.5% |
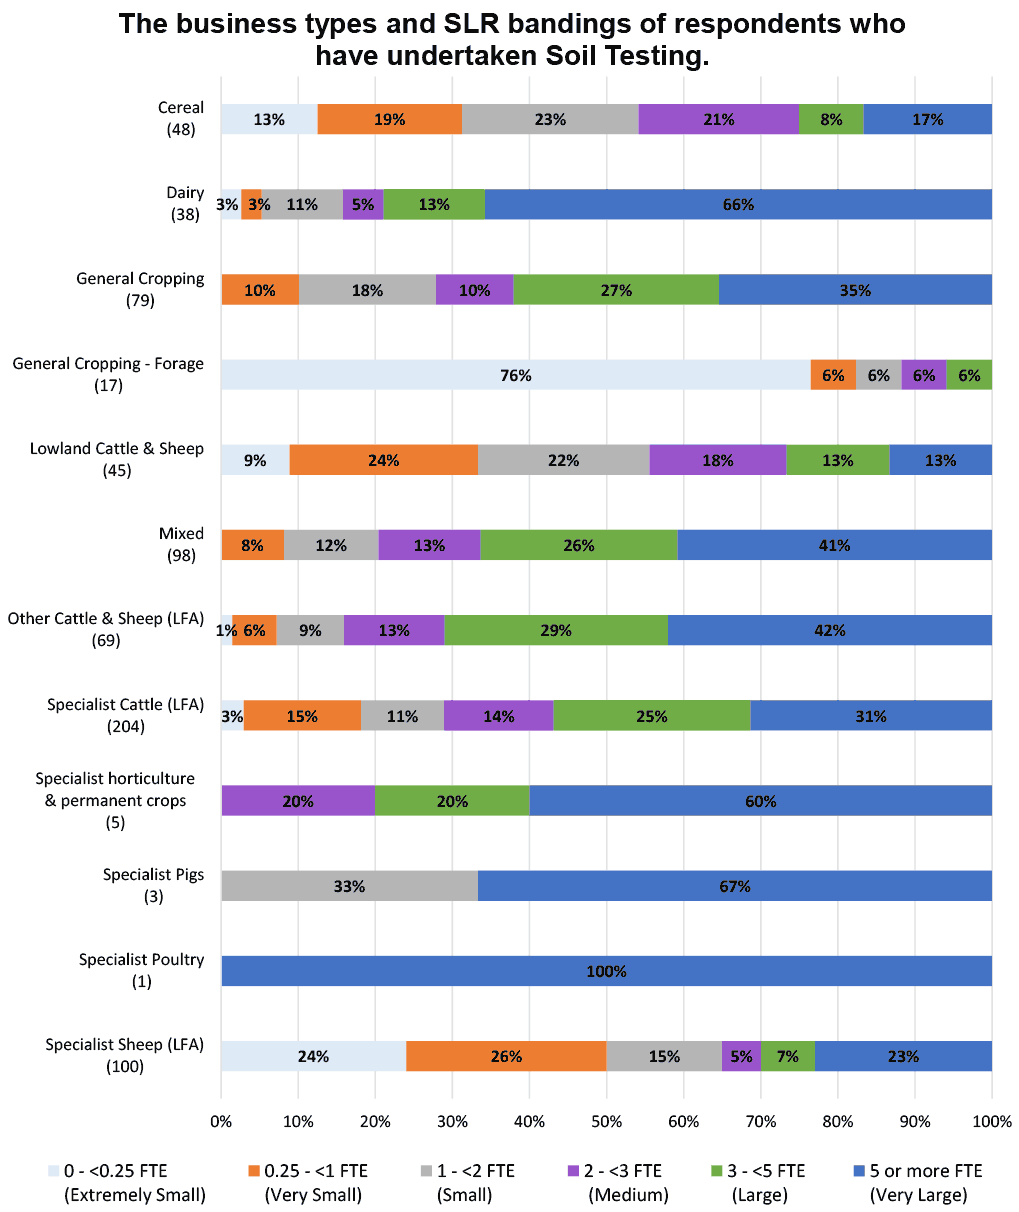
Each bar in Figure 12 below shows the estimated percentage share by farm size of all soil testing analysis undertaken by a given farm type. The total number of soil testing analyses (denominator) for each farm type is shown in brackets along the vertical axis. For example, of the 48 reported soil testing analyses undertaken by cereal farms, 17% were undertaken by very large cereal farms. This does not, however, necessarily imply that 17% of very large cereal farms undertake soil testing. Table 12 shows the supporting data values.
| Business Type | 0 - <0.25 FTE (Extremely Small) | 0.25 - <1 FTE (Very Small) | 1 - <2 FTE (Small) | 2 - <3 FTE (Medium) | 3 - <5 FTE (Large) | 5 or more FTE (Very Large) | Unknown SLR |
|---|---|---|---|---|---|---|---|
| Cereal (48) | 6 | 9 | 11 | 10 | 4 | 8 | 0 |
| 12.5% | 18.8% | 22.9% | 20.8% | 8.3% | 16.7% | 0.0% | |
| Dairy (38) | 1 | 1 | 4 | 2 | 5 | 25 | 0 |
| 2.6% | 2.6% | 10.5% | 5.3% | 13.2% | 65.8% | 0.0% | |
| General Cropping (79) | 0 | 8 | 14 | 8 | 21 | 28 | 0 |
| 0.0% | 10.1% | 17.7% | 10.1% | 26.6% | 35.4% | 0.0% | |
| General Cropping - Forage (17) | 13 | 1 | 1 | 1 | 1 | 0 | 0 |
| 76.5% | 5.9% | 5.9% | 5.9% | 5.9% | 0.0% | 0.0% | |
| Lowland Cattle & Sheep (45) | 4 | 11 | 10 | 8 | 6 | 6 | 0 |
| 8.9% | 24.4% | 22.2% | 17.8% | 13.3% | 13.3% | 0.0% | |
| Mixed (98) | 0 | 8 | 12 | 13 | 25 | 40 | 0 |
| 0.0% | 8.2% | 12.2% | 13.3% | 25.5% | 40.8% | 0.0% | |
| Other Cattle & Sheep (LFA) (69) | 1 | 4 | 6 | 9 | 20 | 29 | 0 |
| 1.4% | 5.8% | 8.7% | 13.0% | 29.0% | 42.0% | 0.0% | |
| Specialist Cattle (LFA) (204) | 6 | 31 | 22 | 29 | 52 | 64 | 0 |
| 2.9% | 15.2% | 10.8% | 14.2% | 25.5% | 31.4% | 0.0% | |
| Specialist horticulture & permanent crops (5) | 0 | 0 | 0 | 1 | 1 | 3 | 0 |
| 0.0% | 0.0% | 0.0% | 20.0% | 20.0% | 60.0% | 0.0% | |
| Specialist Pigs (3) | 0 | 0 | 1 | 0 | 0 | 2 | 0 |
| 0.0% | 0.0% | 33.3% | 0.0% | 0.0% | 66.7% | 0.0% | |
| Specialist Poultry (1) | 0 | 0 | 0 | 0 | 0 | 1 | 0 |
| 0.0% | 0.0% | 0.0% | 0.0% | 0.0% | 100.0% | 0.0% | |
| Specialist Sheep (LFA) (100) | 24 | 26 | 15 | 5 | 7 | 23 | 0 |
| 24.0% | 26.0% | 15.0% | 5.0% | 7.0% | 23.0% | 0.0% | |
| Unknown Business Type (6) | 0 | 0 | 0 | 0 | 0 | 0 | 6 |
| 0.0% | 0.0% | 0.0% | 0.0% | 0.0% | 0.0% | 100.0% | |
| Total (713) | 55 | 99 | 96 | 86 | 142 | 229 | 6 |
| 7.7% | 13.9% | 13.5% | 12.1% | 19.9% | 32.1% | 0.8% |
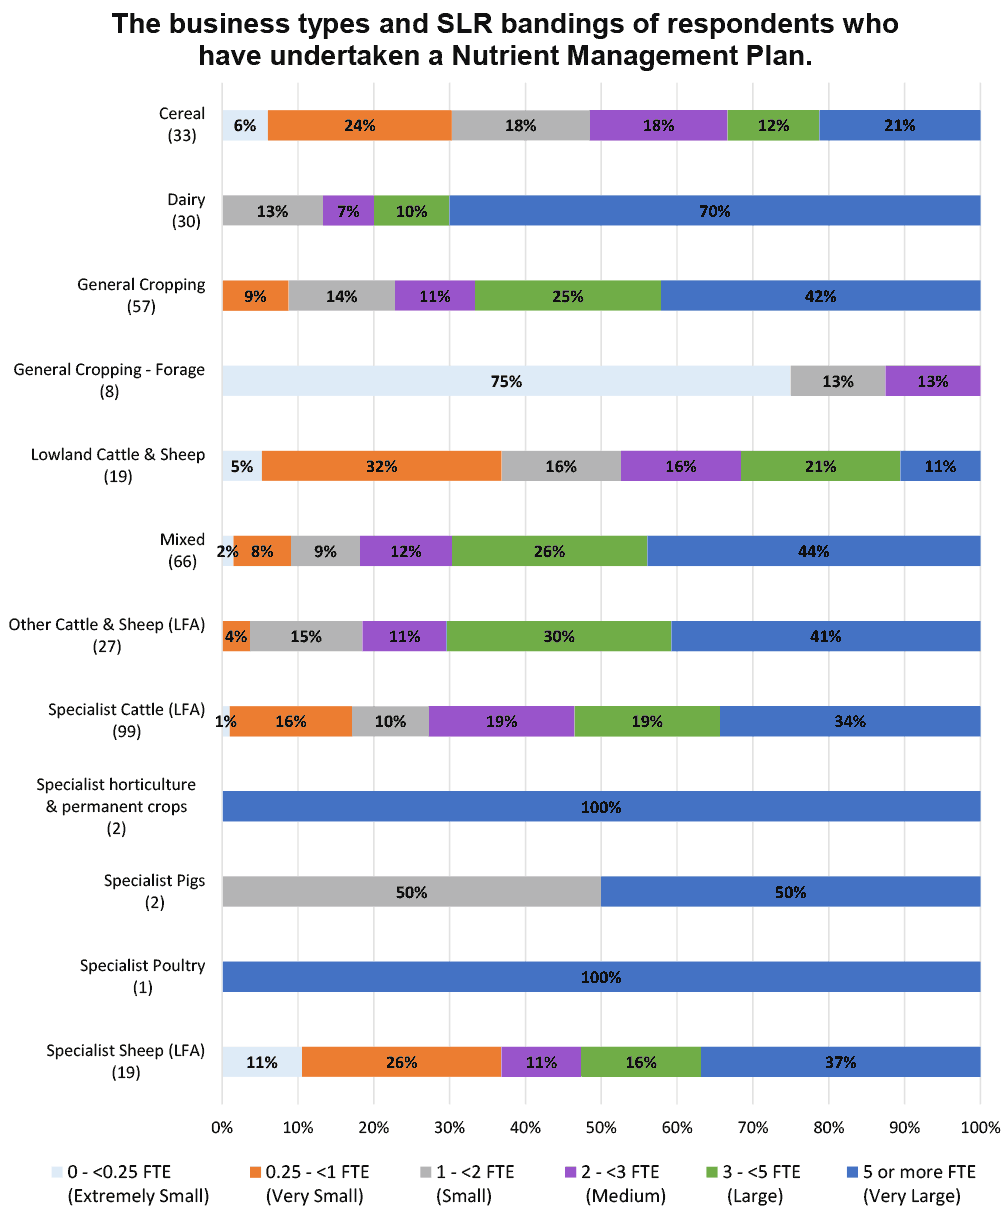
Each bar in Figure 13 below shows the estimated percentage share by farm size of all nutrient management plans undertaken by a given farm type. The total number of nutrient management plans (denominator) for each farm type is shown in brackets along the vertical axis. For example, of the 33 reported nutrient management plans undertaken by cereal farms, 21% were undertaken by very large cereal farms. This does not, however, necessarily imply that 21% of very large cereal farms undertake nutrient management plans. Table 13 shows the supporting data values.
| Business Type | 0 - <0.25 FTE (Extremely Small) | 0.25 - <1 FTE (Very Small) | 1 - <2 FTE (Small) | 2 - <3 FTE (Medium) | 3 - <5 FTE (Large) | 5 or more FTE (Very Large) | Unknown SLR |
|---|---|---|---|---|---|---|---|
| Cereal (33) | 2 | 8 | 6 | 6 | 4 | 7 | 0 |
| 6.1% | 24.2% | 18.2% | 18.2% | 12.1% | 21.2% | 0.0% | |
| Dairy (30) | 0 | 0 | 4 | 2 | 3 | 21 | 0 |
| 0.0% | 0.0% | 13.3% | 6.7% | 10.0% | 70.0% | 0.0% | |
| General Cropping (57) | 0 | 5 | 8 | 6 | 14 | 24 | 0 |
| 0.0% | 8.8% | 14.0% | 10.5% | 24.6% | 42.1% | 0.0% | |
| General Cropping - Forage (8) | 6 | 0 | 1 | 1 | 0 | 0 | 0 |
| 75.0% | 0.0% | 12.5% | 12.5% | 0.0% | 0.0% | 0.0% | |
| Lowland Cattle & Sheep (19) | 1 | 6 | 3 | 3 | 4 | 2 | 0 |
| 5.3% | 31.6% | 15.8% | 15.8% | 21.1% | 10.5% | 0.0% | |
| Mixed (66) | 1 | 5 | 6 | 8 | 17 | 29 | 0 |
| 1.5% | 7.6% | 9.1% | 12.1% | 25.8% | 43.9% | 0.0% | |
| Other Cattle & Sheep (LFA) (27) | 0 | 1 | 4 | 3 | 8 | 11 | 0 |
| 0.0% | 3.7% | 14.8% | 11.1% | 29.6% | 40.7% | 0.0% | |
| Specialist Cattle (LFA) (99) | 1 | 16 | 10 | 19 | 19 | 34 | 0 |
| 1.0% | 16.2% | 10.1% | 19.2% | 19.2% | 34.3% | 0.0% | |
| Specialist horticulture & permanent crops (2) | 0 | 0 | 0 | 0 | 0 | 2 | 0 |
| 0.0% | 0.0% | 0.0% | 0.0% | 0.0% | 100.0% | 0.0% | |
| Specialist Pigs (2) | 0 | 0 | 1 | 0 | 0 | 1 | 0 |
| 0.0% | 0.0% | 50.0% | 0.0% | 0.0% | 50.0% | 0.0% | |
| Specialist Poultry (1) | 0 | 0 | 0 | 0 | 0 | 1 | 0 |
| 0.0% | 0.0% | 0.0% | 0.0% | 0.0% | 100.0% | 0.0% | |
| Specialist Sheep (LFA) (19) | 2 | 5 | 0 | 2 | 3 | 7 | 0 |
| 10.5% | 26.3% | 0.0% | 10.5% | 15.8% | 36.8% | 0.0% | |
| Unknown Business Type (2) | 0 | 0 | 0 | 0 | 0 | 0 | 2 |
| 0.0% | 0.0% | 0.0% | 0.0% | 0.0% | 0.0% | 100.0% | |
| Total (365) | 13 | 46 | 43 | 50 | 72 | 139 | 2 |
| 3.6% | 12.6% | 11.8% | 13.7% | 19.7% | 38.1% | 0.5% |
Each bar in Figure 14 below shows the estimated percentage share by farm size of all manure analysis undertaken by a given farm type. The total number of manure analyses (denominator) for each farm type is shown in brackets along the vertical axis. For example, of the 10 reported manure analyses undertaken by cereal farms, 20% were undertaken by very large cereal farms. This does not, however, necessarily imply that 20% of very large cereal farms undertake manure analysis. Table 14 shows the supporting data values.
| Business Type | 0 - <0.25 FTE (Extremely Small) | 0.25 - <1 FTE (Very Small) | 1 - <2 FTE (Small) | 2 - <3 FTE (Medium) | 3 - <5 FTE (Large) | 5 or more FTE (Very Large) | Unknown SLR |
|---|---|---|---|---|---|---|---|
| Cereal (10) | 0 | 2 | 2 | 2 | 2 | 2 | 0 |
| 0.0% | 20.0% | 20.0% | 20.0% | 20.0% | 20.0% | 0.0% | |
| Dairy (13) | 0 | 0 | 2 | 1 | 1 | 9 | 0 |
| 0.0% | 0.0% | 15.4% | 7.7% | 7.7% | 69.2% | 0.0% | |
| General Cropping (13) | 0 | 2 | 3 | 1 | 2 | 5 | 0 |
| 0.0% | 15.4% | 23.1% | 7.7% | 15.4% | 38.5% | 0.0% | |
| General Cropping - Forage (1) | 0 | 0 | 0 | 1 | 0 | 0 | 0 |
| 0.0% | 0.0% | 0.0% | 100.0% | 0.0% | 0.0% | 0.0% | |
| Lowland Cattle & Sheep (5) | 0 | 0 | 2 | 2 | 1 | 0 | 0 |
| 0.0% | 0.0% | 40.0% | 40.0% | 20.0% | 0.0% | 0.0% | |
| Mixed (19) | 0 | 1 | 0 | 2 | 2 | 14 | 0 |
| 0.0% | 5.3% | 0.0% | 10.5% | 10.5% | 73.7% | 0.0% | |
| Other Cattle & Sheep (LFA) (6) | 0 | 0 | 0 | 1 | 1 | 4 | 0 |
| 0.0% | 0.0% | 0.0% | 16.7% | 16.7% | 66.7% | 0.0% | |
| Specialist Cattle (LFA) (29) | 2 | 2 | 2 | 5 | 9 | 9 | 0 |
| 6.9% | 6.9% | 6.9% | 17.2% | 31.0% | 31.0% | 0.0% | |
| Specialist horticulture & permanent crops (0) | 0 | 0 | 0 | 0 | 0 | 0 | 0 |
| 0.0% | 0.0% | 0.0% | 0.0% | 0.0% | 0.0% | 0.0% | |
| Specialist Pigs (3) | 0 | 0 | 1 | 0 | 0 | 2 | 0 |
| 0.0% | 0.0% | 33.3% | 0.0% | 0.0% | 66.7% | 0.0% | |
| Specialist Poultry (1) | 0 | 0 | 0 | 0 | 0 | 1 | 0 |
| 0.0% | 0.0% | 0.0% | 0.0% | 0.0% | 100.0% | 0.0% | |
| Specialist Sheep (LFA) (9) | 2 | 3 | 1 | 1 | 1 | 1 | 0 |
| 22.2% | 33.3% | 11.1% | 11.1% | 11.1% | 11.1% | 0.0% | |
| Unknown Business Type (1) | 0 | 0 | 0 | 0 | 0 | 0 | 1 |
| 0.0% | 0.0% | 0.0% | 0.0% | 0.0% | 0.0% | 100.0% | |
| Total (110) | 4 | 10 | 13 | 16 | 19 | 47 | 1 |
| 3.6% | 9.1% | 11.8% | 14.5% | 17.3% | 42.7% | 0.9% |
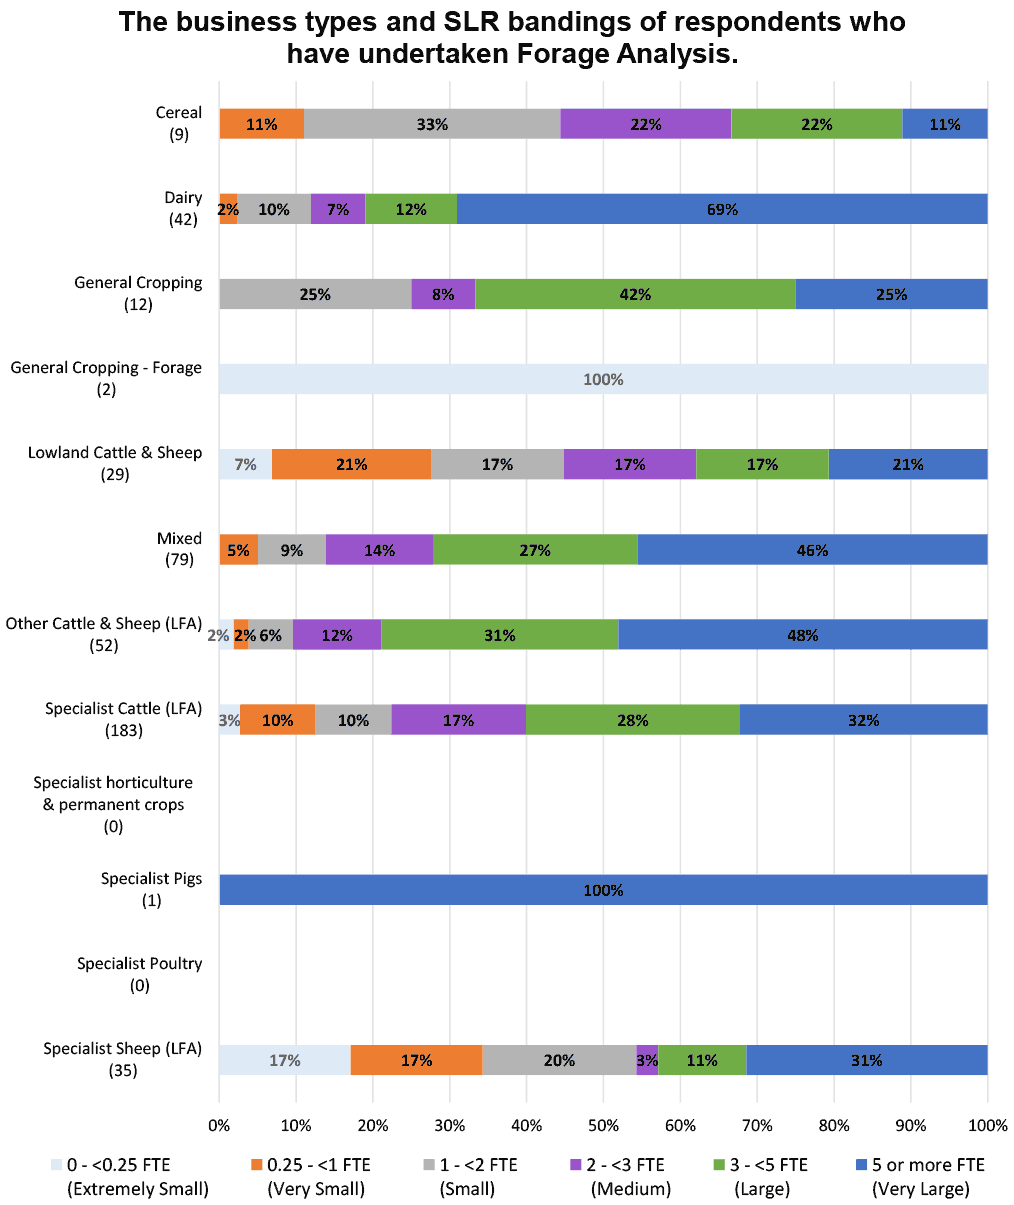
Each bar in Figure 15 below shows the estimated percentage share by farm size of all forage analysis undertaken by a given farm type. The total number of forage analyses (denominator) for each farm type is shown in brackets along the vertical axis. For example, of the 9 reported forage analyses undertaken by cereal farms, 11% were undertaken by very large cereal farms. This does not, however, necessarily imply that 11% of very large cereal farms undertake forage analysis. Table 15 shows the supporting data values.
| Business Type | 0 - <0.25 FTE (Extremely Small) | 0.25 - <1 FTE (Very Small) | 1 - <2 FTE (Small) | 2 - <3 FTE (Medium) | 3 - <5 FTE (Large) | 5 or more FTE (Very Large) | Unknown SLR |
|---|---|---|---|---|---|---|---|
| Cereal (9) | 0 | 1 | 3 | 2 | 2 | 1 | 0 |
| 0.0% | 11.1% | 33.3% | 22.2% | 22.2% | 11.1% | 0.0% | |
| Dairy (42) | 0 | 1 | 4 | 3 | 5 | 29 | 0 |
| 0.0% | 2.4% | 9.5% | 7.1% | 11.9% | 69.0% | 0.0% | |
| General Cropping (12) | 0 | 0 | 3 | 1 | 5 | 3 | 0 |
| 0.0% | 0.0% | 25.0% | 8.3% | 41.7% | 25.0% | 0.0% | |
| General Cropping - Forage (2) | 2 | 0 | 0 | 0 | 0 | 0 | 0 |
| 100.0% | 0.0% | 0.0% | 0.0% | 0.0% | 0.0% | 0.0% | |
| Lowland Cattle & Sheep (29) | 2 | 6 | 5 | 5 | 5 | 6 | 0 |
| 6.9% | 20.7% | 17.2% | 17.2% | 17.2% | 20.7% | 0.0% | |
| Mixed (79) | 0 | 4 | 7 | 11 | 21 | 36 | 0 |
| 0.0% | 5.1% | 8.9% | 13.9% | 26.6% | 45.6% | 0.0% | |
| Other Cattle & Sheep (LFA) (52) | 1 | 1 | 3 | 6 | 16 | 25 | 0 |
| 1.9% | 1.9% | 5.8% | 11.5% | 30.8% | 48.1% | 0.0% | |
| Specialist Cattle (LFA) (183) | 5 | 18 | 18 | 32 | 51 | 59 | 0 |
| 2.7% | 9.8% | 9.8% | 17.5% | 27.9% | 32.2% | 0.0% | |
| Specialist horticulture & permanent crops (0) | 0 | 0 | 0 | 0 | 0 | 0 | 0 |
| 0.0% | 0.0% | 0.0% | 0.0% | 0.0% | 0.0% | 0.0% | |
| Specialist Pigs (1) | 0 | 0 | 0 | 0 | 0 | 1 | 0 |
| 0.0% | 0.0% | 0.0% | 0.0% | 0.0% | 100.0% | 0.0% | |
| Specialist Poultry (0) | 0 | 0 | 0 | 0 | 0 | 0 | 0 |
| 0.0% | 0.0% | 0.0% | 0.0% | 0.0% | 0.0% | 0.0% | |
| Specialist Sheep (LFA) (35) | 6 | 6 | 7 | 1 | 4 | 11 | 0 |
| 17.1% | 17.1% | 20.0% | 2.9% | 11.4% | 31.4% | 0.0% | |
| Unknown Business Type (1) | 0 | 0 | 0 | 0 | 0 | 0 | 1 |
| 0.0% | 0.0% | 0.0% | 0.0% | 0.0% | 0.0% | 100.0% | |
| Total (445) | 16 | 37 | 50 | 61 | 109 | 171 | 1 |
| 3.6% | 8.3% | 11.2% | 13.7% | 24.5% | 38.4% | 0.2% |
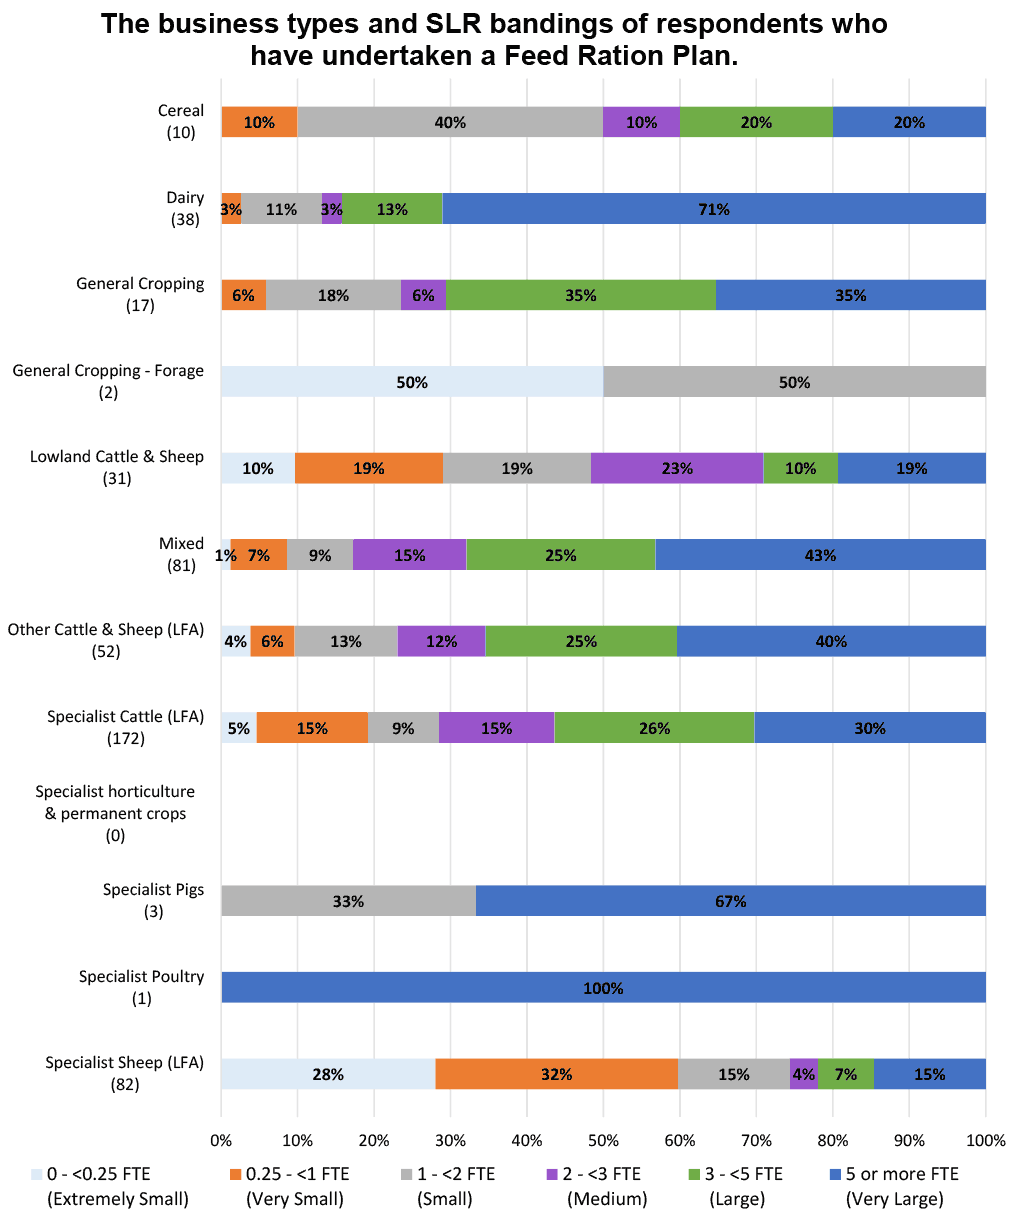
Each bar in Figure 16 below shows the estimated percentage share by farm size of all feed ration plans undertaken by a given farm type. The total number of feed ration plans (denominator) for each farm type is shown in brackets along the vertical axis. For example, of the 10 reported feed ration plans undertaken by cereal farms, 20% were undertaken by very large cereal farms. This does not, however, necessarily imply that 20% of very large cereal farms undertake feed ration plans. Table 16 shows the supporting data values.
| Business Type | 0 - <0.25 FTE (Extremely Small) | 0.25 - <1 FTE (Very Small) | 1 - <2 FTE (Small) | 2 - <3 FTE (Medium) | 3 - <5 FTE (Large) | 5 or more FTE (Very Large) | Unknown SLR |
|---|---|---|---|---|---|---|---|
| Cereal (10) | 0 | 1 | 4 | 1 | 2 | 2 | 0 |
| 0.0% | 10.0% | 40.0% | 10.0% | 20.0% | 20.0% | 0.0% | |
| Dairy (38) | 0 | 1 | 4 | 1 | 5 | 27 | 0 |
| 0.0% | 2.6% | 10.5% | 2.6% | 13.2% | 71.1% | 0.0% | |
| General Cropping (17) | 0 | 1 | 3 | 1 | 6 | 6 | 0 |
| 0.0% | 5.9% | 17.6% | 5.9% | 35.3% | 35.3% | 0.0% | |
| General Cropping - Forage (2) | 1 | 0 | 1 | 0 | 0 | 0 | 0 |
| 50.0% | 0.0% | 50.0% | 0.0% | 0.0% | 0.0% | 0.0% | |
| Lowland Cattle & Sheep (31) | 3 | 6 | 6 | 7 | 3 | 6 | 0 |
| 9.7% | 19.4% | 19.4% | 22.6% | 9.7% | 19.4% | 0.0% | |
| Mixed (81) | 1 | 6 | 7 | 12 | 20 | 35 | 0 |
| 1.2% | 7.4% | 8.6% | 14.8% | 24.7% | 43.2% | 0.0% | |
| Other Cattle & Sheep (LFA) (52) | 2 | 3 | 7 | 6 | 13 | 21 | 0 |
| 3.8% | 5.8% | 13.5% | 11.5% | 25.0% | 40.4% | 0.0% | |
| Specialist Cattle (LFA) (172) | 8 | 25 | 16 | 26 | 45 | 52 | 0 |
| 4.7% | 14.5% | 9.3% | 15.1% | 26.2% | 30.2% | 0.0% | |
| Specialist horticulture & permanent crops (0) | 0 | 0 | 0 | 0 | 0 | 0 | 0 |
| 0.0% | 0.0% | 0.0% | 0.0% | 0.0% | 0.0% | 0.0% | |
| Specialist Pigs (3) | 0 | 0 | 1 | 0 | 0 | 2 | 0 |
| 0.0% | 0.0% | 33.3% | 0.0% | 0.0% | 66.7% | 0.0% | |
| Specialist Poultry (1) | 0 | 0 | 0 | 0 | 0 | 1 | 0 |
| 0.0% | 0.0% | 0.0% | 0.0% | 0.0% | 100.0% | 0.0% | |
| Specialist Sheep (LFA) (82) | 23 | 26 | 12 | 3 | 6 | 12 | 0 |
| 28.0% | 31.7% | 14.6% | 3.7% | 7.3% | 14.6% | 0.0% | |
| Unknown Business Type (3) | 0 | 0 | 0 | 0 | 0 | 0 | 3 |
| 0.0% | 0.0% | 0.0% | 0.0% | 0.0% | 0.0% | 100.0% | |
| Total (492) | 38 | 69 | 61 | 57 | 100 | 164 | 3 |
| 7.7% | 14.0% | 12.4% | 11.6% | 20.3% | 33.3% | 0.6% |
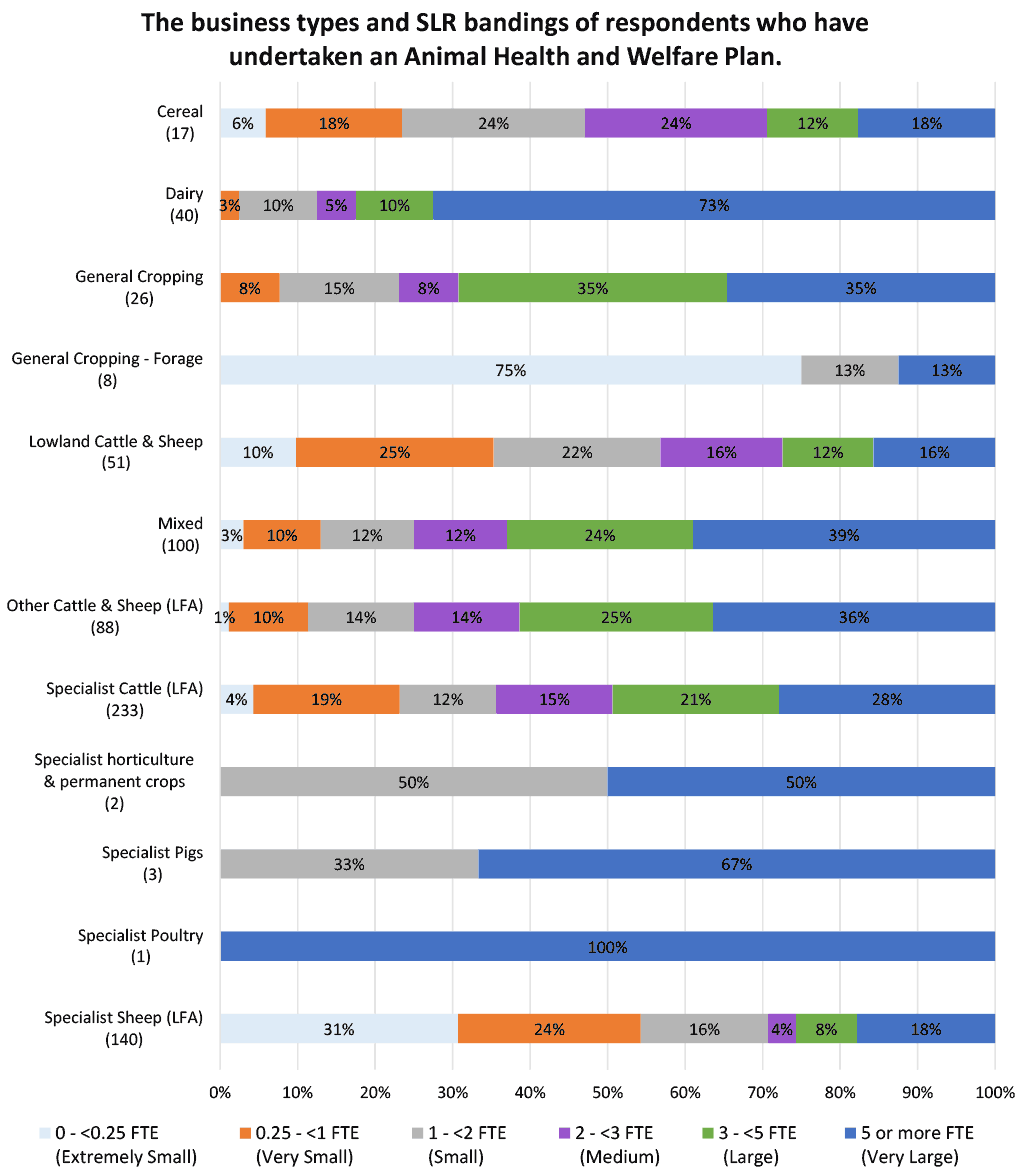
Each bar in Figure 17 below shows the estimated percentage share by farm size of all animal health and welfare plans undertaken by a given farm type. The total number of animal health and welfare plans (denominator) for each farm type is shown in brackets along the vertical axis. For example, of the 17 reported animal health and welfare plans undertaken by cereal farms, 18% were undertaken by very large cereal farms. This does not, however, necessarily imply that 18% of very large cereal farms undertake animal health and welfare plans. Table 17 shows the supporting data values.
| Business Type | 0 - <0.25 FTE (Extremely Small) | 0.25 - <1 FTE (Very Small) | 1 - <2 FTE (Small) | 2 - <3 FTE (Medium) | 3 - <5 FTE (Large) | 5 or more FTE (Very Large) | Unknown SLR |
|---|---|---|---|---|---|---|---|
| Cereal (17) | 1 | 3 | 4 | 4 | 2 | 3 | 0 |
| 5.9% | 17.6% | 23.5% | 23.5% | 11.8% | 17.6% | 0.0% | |
| Dairy (40) | 0 | 1 | 4 | 2 | 4 | 29 | 0 |
| 0.0% | 2.5% | 10.0% | 5.0% | 10.0% | 72.5% | 0.0% | |
| General Cropping (26) | 0 | 2 | 4 | 2 | 9 | 9 | 0 |
| 0.0% | 7.7% | 15.4% | 7.7% | 34.6% | 34.6% | 0.0% | |
| General Cropping - Forage (8) | 6 | 0 | 1 | 0 | 0 | 1 | 0 |
| 75.0% | 0.0% | 12.5% | 0.0% | 0.0% | 12.5% | 0.0% | |
| Lowland Cattle & Sheep (51) | 5 | 13 | 11 | 8 | 6 | 8 | 0 |
| 9.8% | 25.5% | 21.6% | 15.7% | 11.8% | 15.7% | 0.0% | |
| Mixed (100) | 3 | 10 | 12 | 12 | 24 | 39 | 0 |
| 3.0% | 10.0% | 12.0% | 12.0% | 24.0% | 39.0% | 0.0% | |
| Other Cattle & Sheep (LFA) (88) | 1 | 9 | 12 | 12 | 22 | 32 | 0 |
| 1.1% | 10.2% | 13.6% | 13.6% | 25.0% | 36.4% | 0.0% | |
| Specialist Cattle (LFA) (233) | 10 | 44 | 29 | 35 | 50 | 65 | 0 |
| 4.3% | 18.9% | 12.4% | 15.0% | 21.5% | 27.9% | 0.0% | |
| Specialist horticulture & permanent crops (2) | 0 | 0 | 1 | 0 | 0 | 1 | 0 |
| 0.0% | 0.0% | 50.0% | 0.0% | 0.0% | 50.0% | 0.0% | |
| Specialist Pigs (3) | 0 | 0 | 1 | 0 | 0 | 2 | 0 |
| 0.0% | 0.0% | 33.3% | 0.0% | 0.0% | 66.7% | 0.0% | |
| Specialist Poultry (1) | 0 | 0 | 0 | 0 | 0 | 1 | 0 |
| 0.0% | 0.0% | 0.0% | 0.0% | 0.0% | 100.0% | 0.0% | |
| Specialist Sheep (LFA) (140) | 43 | 33 | 23 | 5 | 11 | 25 | 0 |
| 30.7% | 23.6% | 16.4% | 3.6% | 7.9% | 17.9% | 0.0% | |
| Unknown Business Type (7) | 0 | 0 | 0 | 0 | 0 | 0 | 7 |
| 0.0% | 0.0% | 0.0% | 0.0% | 0.0% | 0.0% | 100.0% | |
| Total (716) | 69 | 115 | 102 | 80 | 128 | 215 | 7 |
| 9.6% | 16.1% | 14.2% | 11.2% | 17.9% | 30.0% | 1.0% |
Each bar in Figure 18 below shows the estimated percentage share by farm size of all breeding plans undertaken by a given farm type. The total number of breeding plans (denominator) for each farm type is shown in brackets along the vertical axis. For example, of the 6 reported breeding plans undertaken by cereal farms, 17% were undertaken by very large cereal farms. This does not, however, necessarily imply that 17% of very large cereal farms undertake breeding plans. Table 17 shows the supporting data values.
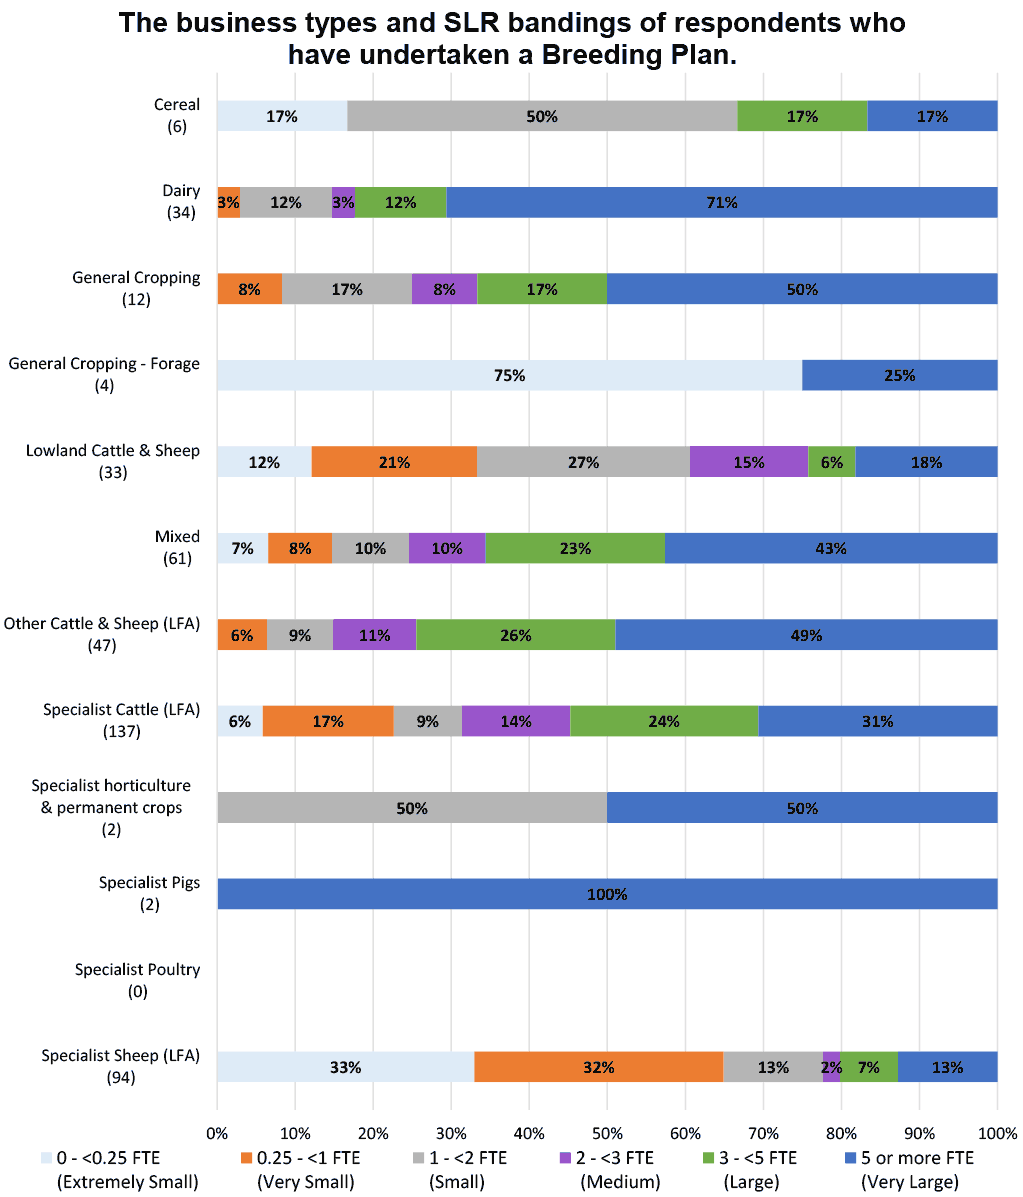
| Business Type | 0 - <0.25 FTE (Extremely Small) | 0.25 - <1 FTE (Very Small) | 1 - <2 FTE (Small) | 2 - <3 FTE (Medium) | 3 - <5 FTE (Large) | 5 or more FTE (Very Large) | Unknown SLR |
|---|---|---|---|---|---|---|---|
| Cereal (6) | 1 | 0 | 3 | 0 | 1 | 1 | 0 |
| 16.7% | 0.0% | 50.0% | 0.0% | 16.7% | 16.7% | 0.0% | |
| Dairy (34) | 0 | 1 | 4 | 1 | 4 | 24 | 0 |
| 0.0% | 2.9% | 11.8% | 2.9% | 11.8% | 70.6% | 0.0% | |
| General Cropping (12) | 0 | 1 | 2 | 1 | 2 | 6 | 0 |
| 0.0% | 8.3% | 16.7% | 8.3% | 16.7% | 50.0% | 0.0% | |
| General Cropping - Forage (4) | 3 | 0 | 0 | 0 | 0 | 1 | 0 |
| 75.0% | 0.0% | 0.0% | 0.0% | 0.0% | 25.0% | 0.0% | |
| Lowland Cattle & Sheep (33) | 4 | 7 | 9 | 5 | 2 | 6 | 0 |
| 12.1% | 21.2% | 27.3% | 15.2% | 6.1% | 18.2% | 0.0% | |
| Mixed (61) | 4 | 5 | 6 | 6 | 14 | 26 | 0 |
| 6.6% | 8.2% | 9.8% | 9.8% | 23.0% | 42.6% | 0.0% | |
| Other Cattle & Sheep (LFA) (47) | 0 | 3 | 4 | 5 | 12 | 23 | 0 |
| 0.0% | 6.4% | 8.5% | 10.6% | 25.5% | 48.9% | 0.0% | |
| Specialist Cattle (LFA) (137) | 8 | 23 | 12 | 19 | 33 | 42 | 0 |
| 5.8% | 16.8% | 8.8% | 13.9% | 24.1% | 30.7% | 0.0% | |
| Specialist horticulture & permanent crops (2) | 0 | 0 | 1 | 0 | 0 | 1 | 0 |
| 0.0% | 0.0% | 50.0% | 0.0% | 0.0% | 50.0% | 0.0% | |
| Specialist Pigs (2) | 0 | 0 | 0 | 0 | 0 | 2 | 0 |
| 0.0% | 0.0% | 0.0% | 0.0% | 0.0% | 100.0% | 0.0% | |
| Specialist Poultry (0) | 0 | 0 | 0 | 0 | 0 | 0 | 0 |
| 0.0% | 0.0% | 0.0% | 0.0% | 0.0% | 0.0% | 0.0% | |
| Specialist Sheep (LFA) (94) | 31 | 30 | 12 | 2 | 7 | 12 | 0 |
| 33.0% | 31.9% | 12.8% | 2.1% | 7.4% | 12.8% | 0.0% | |
| Unknown Business Type (3) | 0 | 0 | 0 | 0 | 0 | 0 | 3 |
| 0.0% | 0.0% | 0.0% | 0.0% | 0.0% | 0.0% | 100.0% | |
| Total (435) | 51 | 70 | 53 | 39 | 75 | 144 | 3 |
| 11.7% | 16.1% | 12.2% | 9.0% | 17.2% | 33.1% | 0.7% |
Each bar in Figure 19 below shows the estimated percentage share by farm size of all biodiversity audits undertaken by a given farm type. The total number of biodiversity audits (denominator) for each farm type is shown in brackets along the vertical axis. For example, of the 16 reported biodiversity audits undertaken by cereal farms, 13% were undertaken by very large cereal farms. This does not, however, necessarily imply that 13% of very large cereal farms undertake biodiversity audits. Table 19 shows the supporting data values.
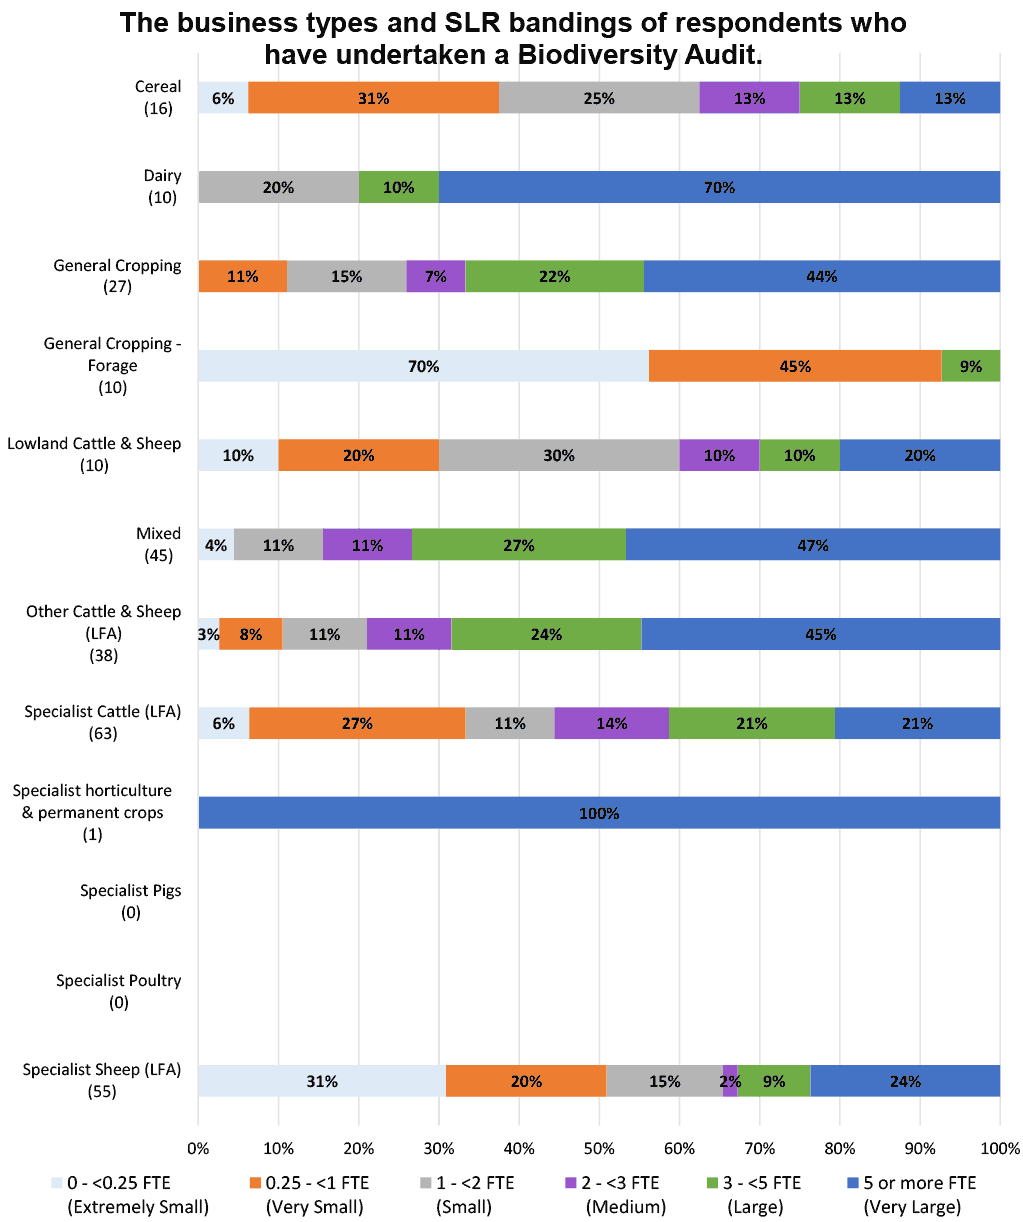
| Business Type | 0 - <0.25 FTE (Extremely Small) | 0.25 - <1 FTE (Very Small) | 1 - <2 FTE (Small) | 2 - <3 FTE (Medium) | 3 - <5 FTE (Large) | 5 or more FTE (Very Large) | Unknown SLR |
|---|---|---|---|---|---|---|---|
| Cereal (16) | 1 | 5 | 4 | 2 | 2 | 2 | 0 |
| 6.3% | 31.3% | 25.0% | 12.5% | 12.5% | 12.5% | 0.0% | |
| Dairy (10) | 0 | 0 | 2 | 0 | 1 | 7 | 0 |
| 0.0% | 0.0% | 20.0% | 0.0% | 10.0% | 70.0% | 0.0% | |
| General Cropping (27) | 0 | 3 | 4 | 2 | 6 | 12 | 0 |
| 0.0% | 11.1% | 14.8% | 7.4% | 22.2% | 44.4% | 0.0% | |
| General Cropping - Forage (10) | 7 | 1 | 0 | 1 | 0 | 1 | 0 |
| 70.0% | 45.5% | 0.0% | 0.0% | 9.1% | 0.0% | 0.0% | |
| Lowland Cattle & Sheep (10) | 1 | 2 | 3 | 1 | 1 | 2 | 0 |
| 10.0% | 20.0% | 30.0% | 10.0% | 10.0% | 20.0% | 0.0% | |
| Mixed (45) | 2 | 0 | 5 | 5 | 12 | 21 | 0 |
| 4.4% | 0.0% | 11.1% | 11.1% | 26.7% | 46.7% | 0.0% | |
| Other Cattle & Sheep (LFA) (38) | 1 | 3 | 4 | 4 | 9 | 17 | 0 |
| 2.6% | 7.9% | 10.5% | 10.5% | 23.7% | 44.7% | 0.0% | |
| Specialist Cattle (LFA) (63) | 4 | 17 | 7 | 9 | 13 | 13 | 0 |
| 6.3% | 27.0% | 11.1% | 14.3% | 20.6% | 20.6% | 0.0% | |
| Specialist horticulture & permanent crops (1) | 0 | 0 | 0 | 0 | 0 | 1 | 0 |
| 0.0% | 0.0% | 0.0% | 0.0% | 0.0% | 100.0% | 0.0% | |
| Specialist Pigs (0) | 0 | 0 | 0 | 0 | 0 | 0 | 0 |
| 0.0% | 0.0% | 0.0% | 0.0% | 0.0% | 0.0% | 0.0% | |
| Specialist Poultry (0) | 0 | 0 | 0 | 0 | 0 | 0 | 0 |
| 0.0% | 0.0% | 0.0% | 0.0% | 0.0% | 0.0% | 0.0% | |
| Specialist Sheep (LFA) (55) | 17 | 11 | 8 | 1 | 5 | 13 | 0 |
| 30.9% | 20.0% | 14.5% | 1.8% | 9.1% | 23.6% | 0.0% | |
| Unknown Business Type (1) | 0 | 0 | 0 | 0 | 0 | 0 | 1 |
| 0.0% | 0.0% | 0.0% | 0.0% | 0.0% | 0.0% | 100.0% | |
| Total (276) | 33 | 42 | 37 | 25 | 49 | 89 | 1 |
| 12.0% | 15.2% | 13.4% | 9.1% | 17.8% | 32.2% | 0.4% |
2.2 Business Overview Questions
This section breaks down the results of each question within the survey. Not all questions were answered by each respondent as the survey was designed to allow livestock and mixed enterprises to answer all sections whilst business which are solely arable/horticulture answered the carbon audit, soil analysis, nutrient management, manure analysis and biodiversity sections. This means when analysing the answers of the survey it must be taken into account that not all of the questions will have 977 responses.
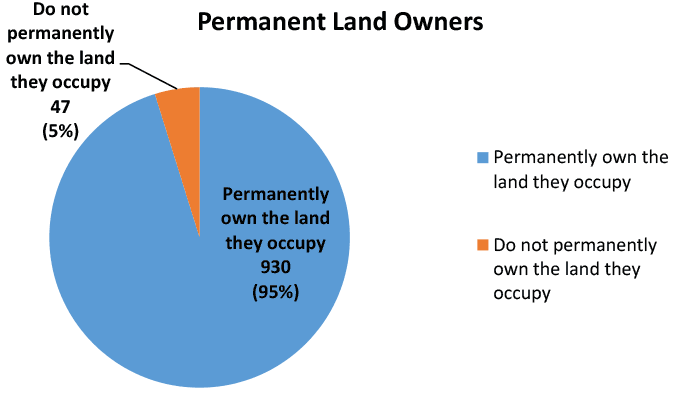
2.2.1 Land Permanently Owned by the Occupier
95.2% (930) of the respondents permanently or partially own the land they occupy (Figure 20). The areas range from 1 ha to 106745 ha in size.
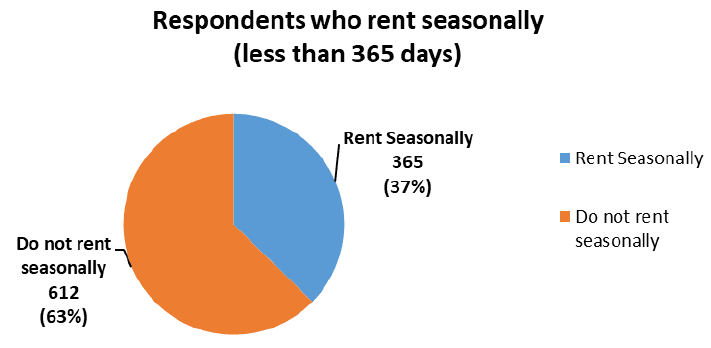
2.2.2 Land rented on a full or seasonal tenancy (365 days or more)
31.8% (311) of the respondents rented land on a full tenancy (Figure 21) with areas ranging from 1 ha to 14054 ha in size.

37.4% (365) of the respondents rent seasonally with areas (Figure 22) ranging from 1 ha to 4243 ha in size.
2.2.3 Types of enterprises
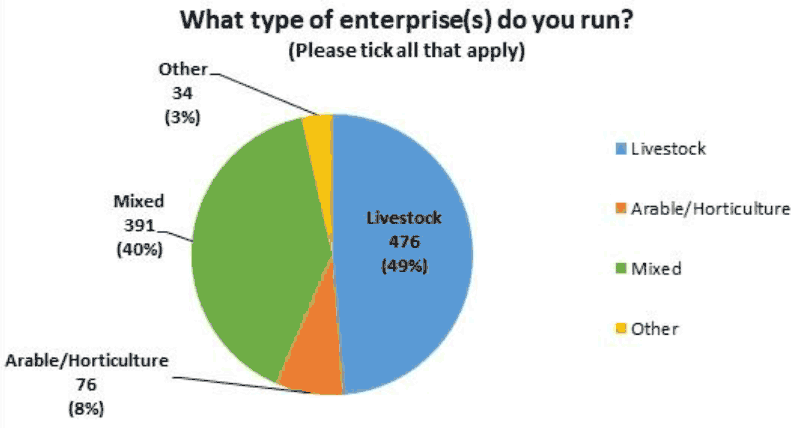
The majority of the survey respondents have a primarily livestock enterprise, accounting for 48.7% (476) of businesses (Figure 23). Respondents who have a primarily arable enterprise account for 7.8% (76) of the total number of participants.
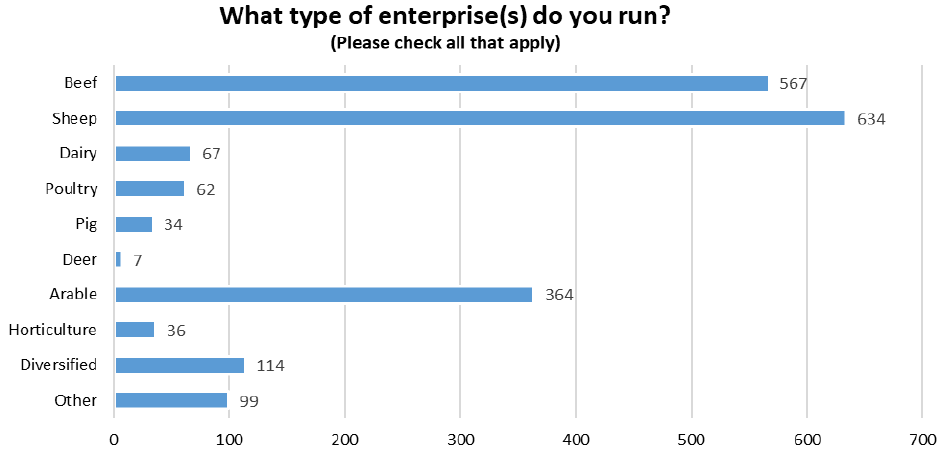
Beef (58%) and Sheep (64.9%) are the predominant enterprise types, closely followed by Arable farming (37.2%) (Figure 24 and Table 20).
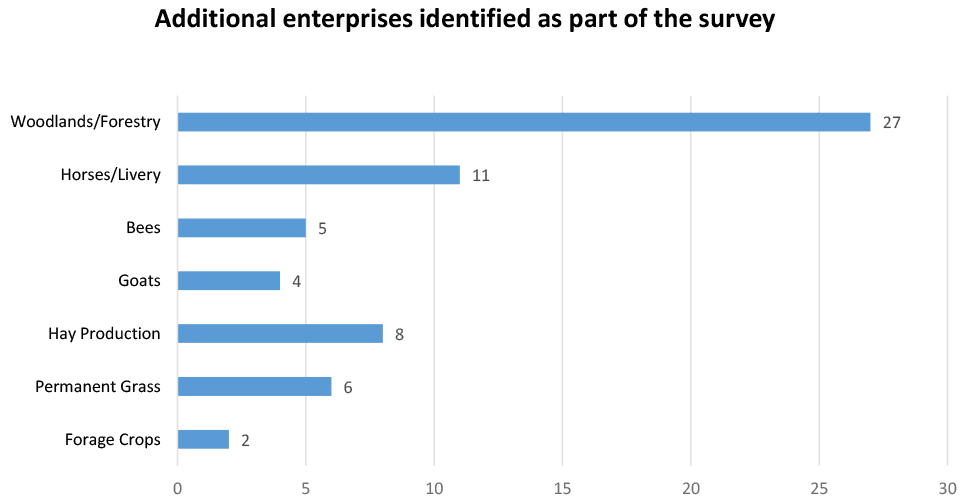
Other common enterprises identified that were not included in the list provided as part of the survey include woodlands/forestry (27 respondents), horses/livery (11 respondents) and hay production (8 respondents) (Figure 25 and Table 20).
| Enterprise Type | Total Respondents | Percentage (Denominator 977) |
|---|---|---|
| Beef | 567 | 58.0% |
| Sheep | 634 | 64.9% |
| Dairy | 67 | 6.9% |
| Poultry | 62 | 6.3% |
| Pig | 34 | 3.5% |
| Deer | 7 | 0.7% |
| Arable | 364 | 37.3% |
| Horticulture | 36 | 3.7% |
| Diversified | 114 | 11.7% |
| Forage Crops | 2 | 0.2% |
| Permanent Grass | 6 | 0.6% |
| Hay Production | 8 | 0.8% |
| Goats | 4 | 0.4% |
| Bees | 5 | 0.5% |
| Horses/Livery | 11 | 1.1% |
| Woodlands/Forestry | 27 | 2.8% |
2.2.4 Identify of the Respondents
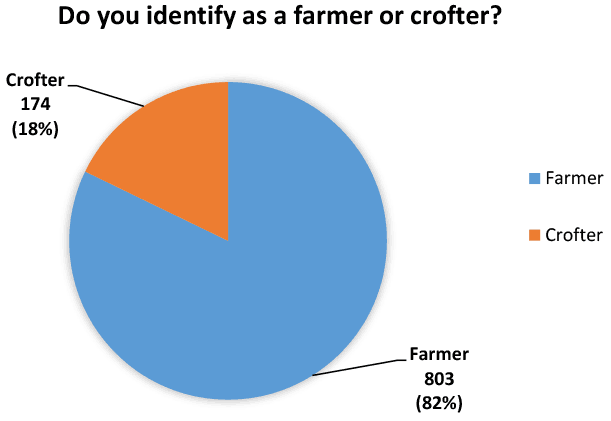
The majority of the respondents identified themselves as farmers, accounting for 82.2% (803) (Figure 26).
2.2.5 Maintenance of Farm Records
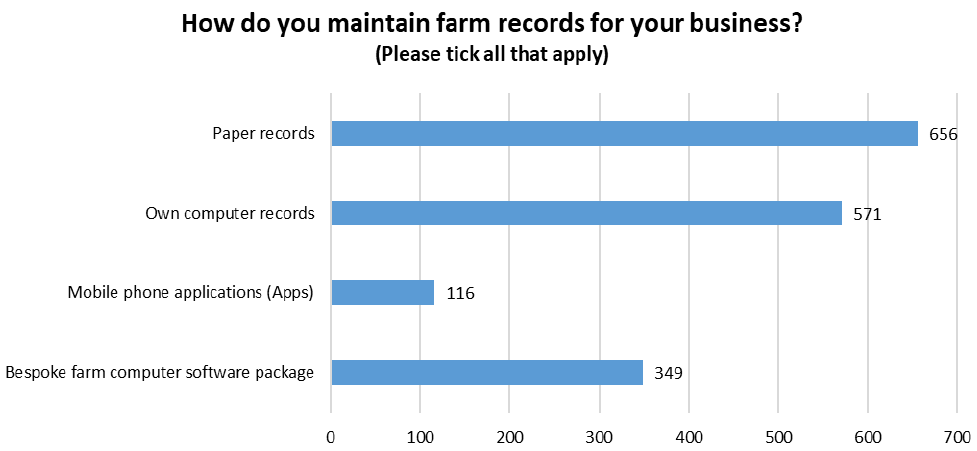
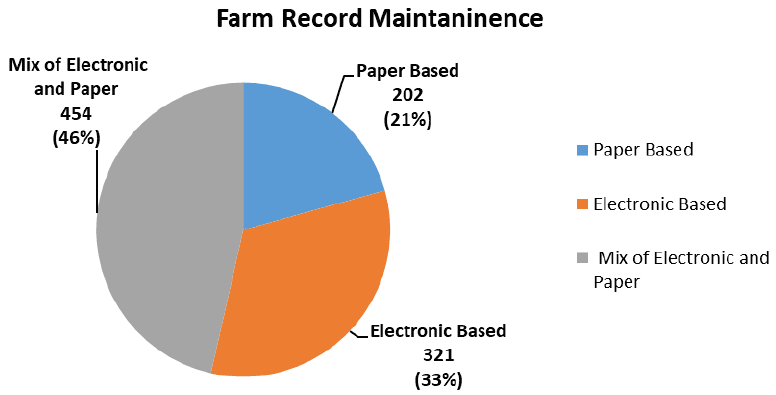
Although there is a large number of respondents who use paper records (656), only 20.6% (202) of the total business surveyed use paper records solely (Figures 27, 28 and Table 21). 32.9% (321) of the business only use electronic methods to maintain their farm records and 46.5% (454) of business use a means of both electronic and paper record keeping.
| Participant | Total Respondents | Percentage (Denominator 977) |
|---|---|---|
| Paper records | 656 | 67.1% |
| Own computer records | 571 | 58.4% |
| Mobile phone applications (Apps) | 116 | 11.9% |
| Bespoke farm computer software package | 349 | 35.7% |
2.2.6 Who maintains the Business Records?
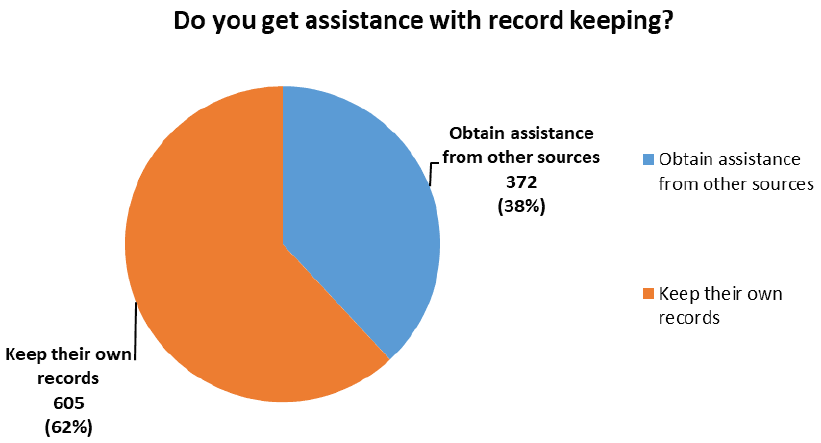
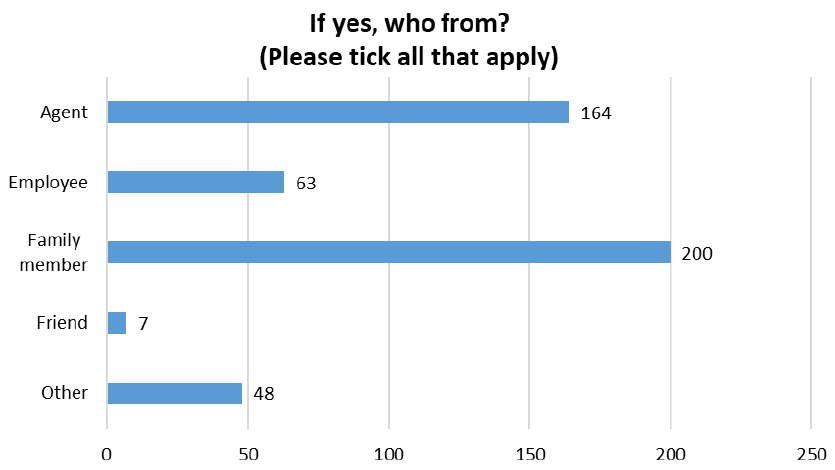
61.9% (605) of the respondents keep their own records while 38.1% (372) obtain assistance from other sources such as a family member (20.5%, 200) or an agent (16.8%, 164) (Figures 29, 30 and Table 22). Other sources that the respondents highlighted as being a source for keeping business records included accountants/book keepers (1.7%, 17) and farm secretaries (0.7%, 7) (Figure 31 and Table 22).
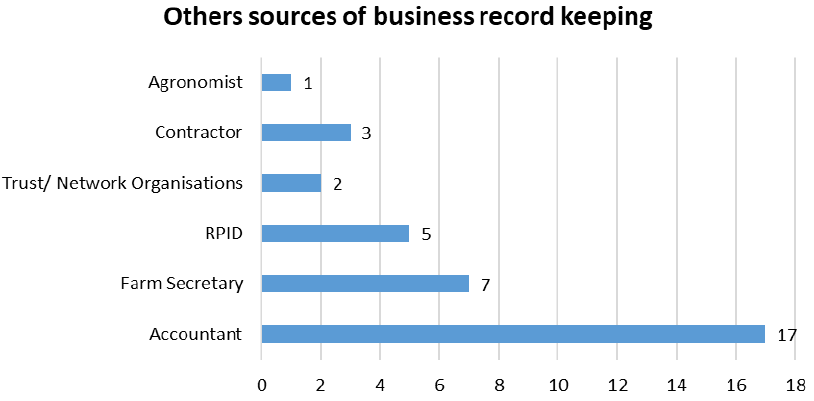
| Business Record Keeping Source | Total Respondents | Percentage (Denominator 977) |
|---|---|---|
| Agent | 164 | 16.8% |
| Employee | 63 | 6.4% |
| Family member | 200 | 20.5% |
| Friend | 7 | 0.7% |
| Agronomist | 1 | 0.1% |
| Contractor | 3 | 0.3% |
| Trust/Network Organisations | 2 | 0.2% |
| RPID | 5 | 0.5% |
| Farm Secretary | 7 | 0.7% |
| Accountant | 17 | 1.7% |
2.3 Carbon Audit
2.3.1 Businesses undertaking carbon audits
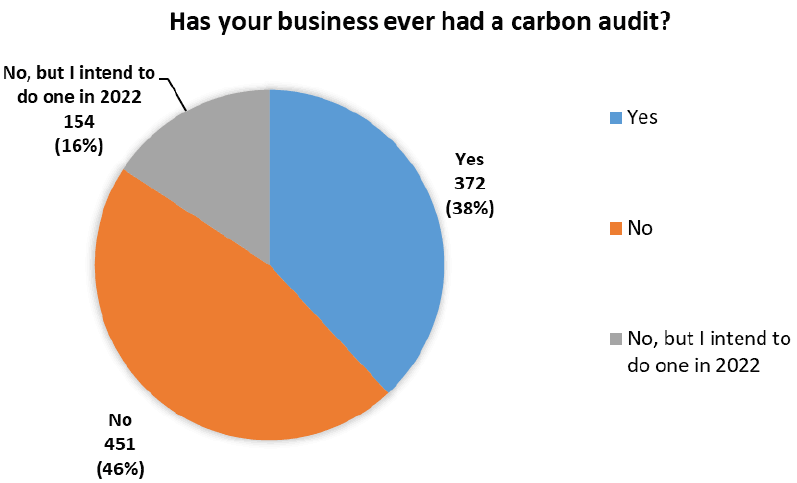
372 of the respondents have had a carbon audit on their business accounting for 38.1% of the total number of respondents (Figure 32). Whilst the majority of the participants have not carried out a Carbon Audit 61.9% (605), reasons for not carrying out a carbon audit can be found in section 2.3.5. 15.8% (154) of respondents are planning on carrying out an audit in 2022 (Figure 32).
Out of the 372 respondents who have conducted a carbon audit, The majority of respondents 70.2% (261) have only conducted one carbon audit in the last five years (Figure 33 and Table 23) and so highlighting that this is becoming a more prominent practice within the agricultural sector. There appears to be a drop in participants undergoing a carbon audit between 2020 and 2021 but this may reflect changes due to the Covid-19 Pandemic, or potentially that the farmers that are more likely to carry out the carbon audit have done it in more recent years.
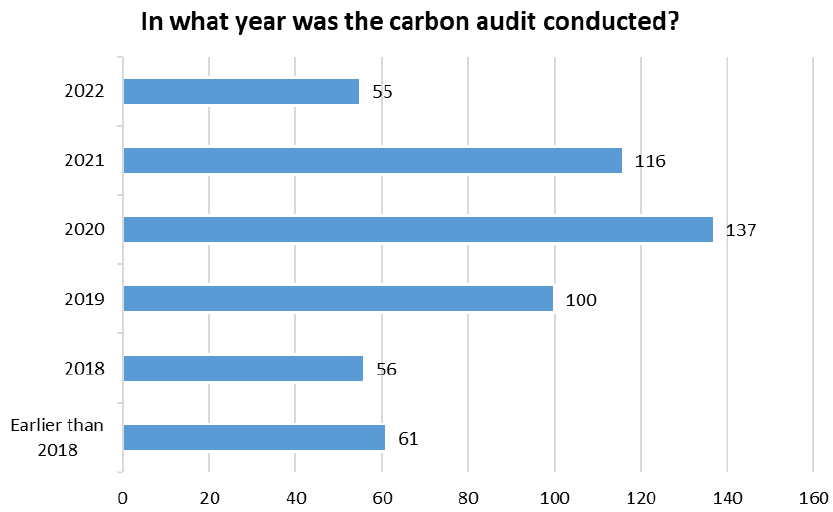
| Year of Carbon Audit | Total Respondents | Percentage (Denominator 372) |
|---|---|---|
| 2022 | 55 | 14.8% |
| 2021 | 116 | 31.2% |
| 2020 | 137 | 36.8% |
| 2019 | 100 | 26.9% |
| 2018 | 56 | 15.1% |
| Earlier than 2018 | 61 | 16.4% |
2.3.2 Carbon audit tools
The most popular carbon audit tool used by the respondents is AgreCalc accounting for 65.6% (244). It was however pointed out that AgreCalc is designed for large farms and mono cultures and that improving the software for smaller and more diverse farms would be a huge improvement (Figure 34 and Table 24).
Other carbon audit tools used by the respondents included Farm Carbon Toolkit, Alltech and Intellync. 4.3% (16) of the respondents did not know what tools were used as they had an agency or commercial company (SRUC, SAC, Sainsbury’s, Arla) complete the carbon audit for them.
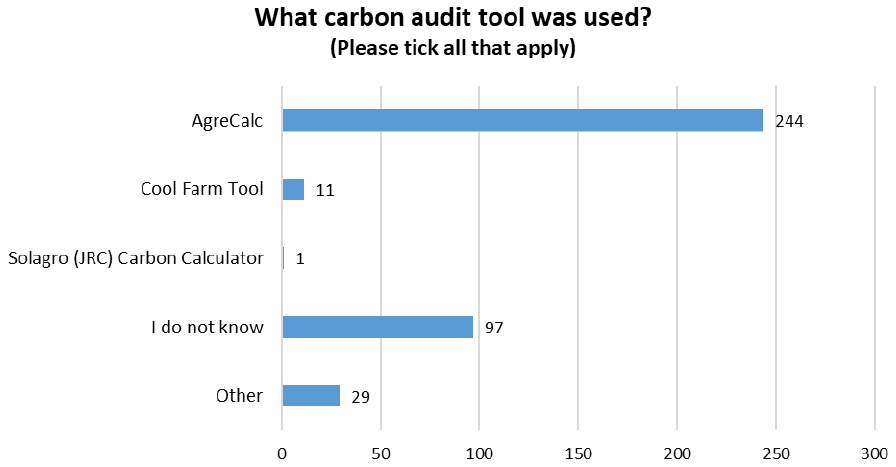
| Carbon Audit tool | Total Respondents | Percentage (Denominator 372) |
|---|---|---|
| AgreCalc | 244 | 65.6% |
| Cool Farm Tool | 11 | 3.0% |
| Solagro (JRC) Carbon Calculator | 1 | 0.3% |
| I do not know | 97 | 26.1% |
| Other | 29 | 7.8% |
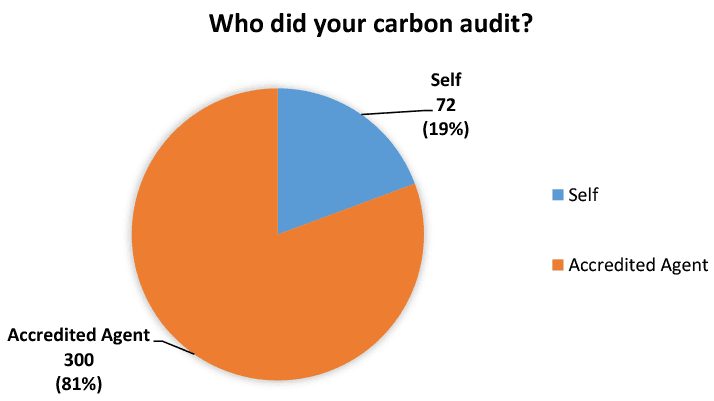
2.3.3 Who did the carbon audit?
Results indicate that 80.7% (300) of participants use an outside source to carry out a carbon audit (Figure 35).
2.3.4 Why businesses undertook a carbon audit?
According to the respondents, the primary reason for 48.4% (180) of the respondents to have completed a carbon audit was due to it being part of the Beef Efficiency Scheme (48.4%, 180) closely followed 34.1% (127) by the funding was available at the time to have the carbon audit done (Figure 36 and Table 25).
1.6% (6) of respondents also pointed out that they completed a carbon audit because of the Scottish Farm Business Survey also out of their own interest as noting it was necessary to apply for organic status.
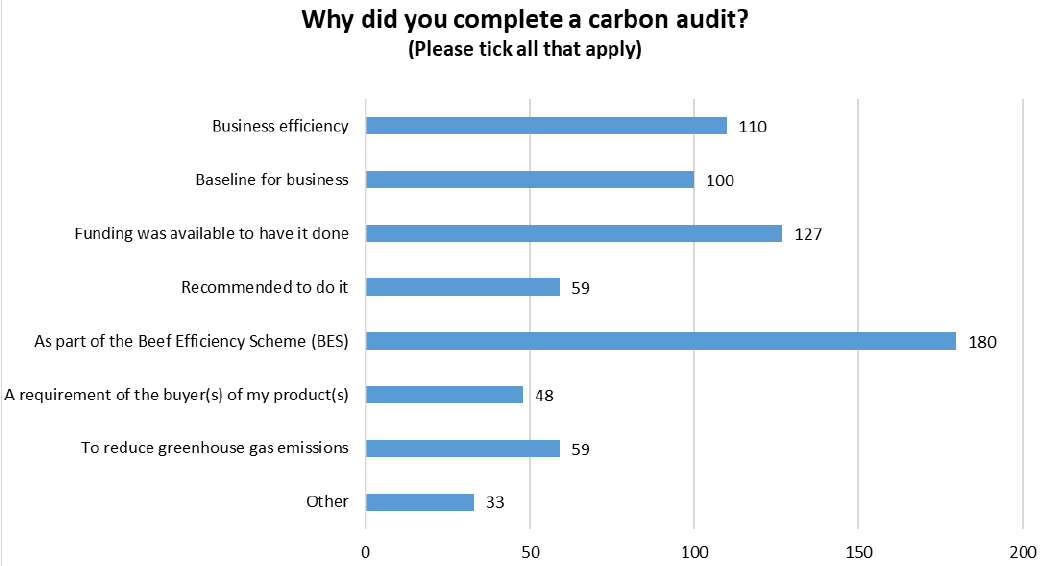
| Carbon Audit Reasons | Total Respondents | Percentage (Denominator 372) |
|---|---|---|
| Business efficiency | 110 | 29.6% |
| Baseline for business | 100 | 26.9% |
| Funding was available to have it done | 127 | 34.1% |
| Recommended to do it | 59 | 15.9% |
| As part of the Beef Efficiency Scheme (BES) | 180 | 48.4% |
| A requirement of the buyer(s) of my product(s) | 48 | 12.9% |
| To reduce greenhouse gas emissions | 59 | 15.9% |
| Other | 33 | 8.9% |
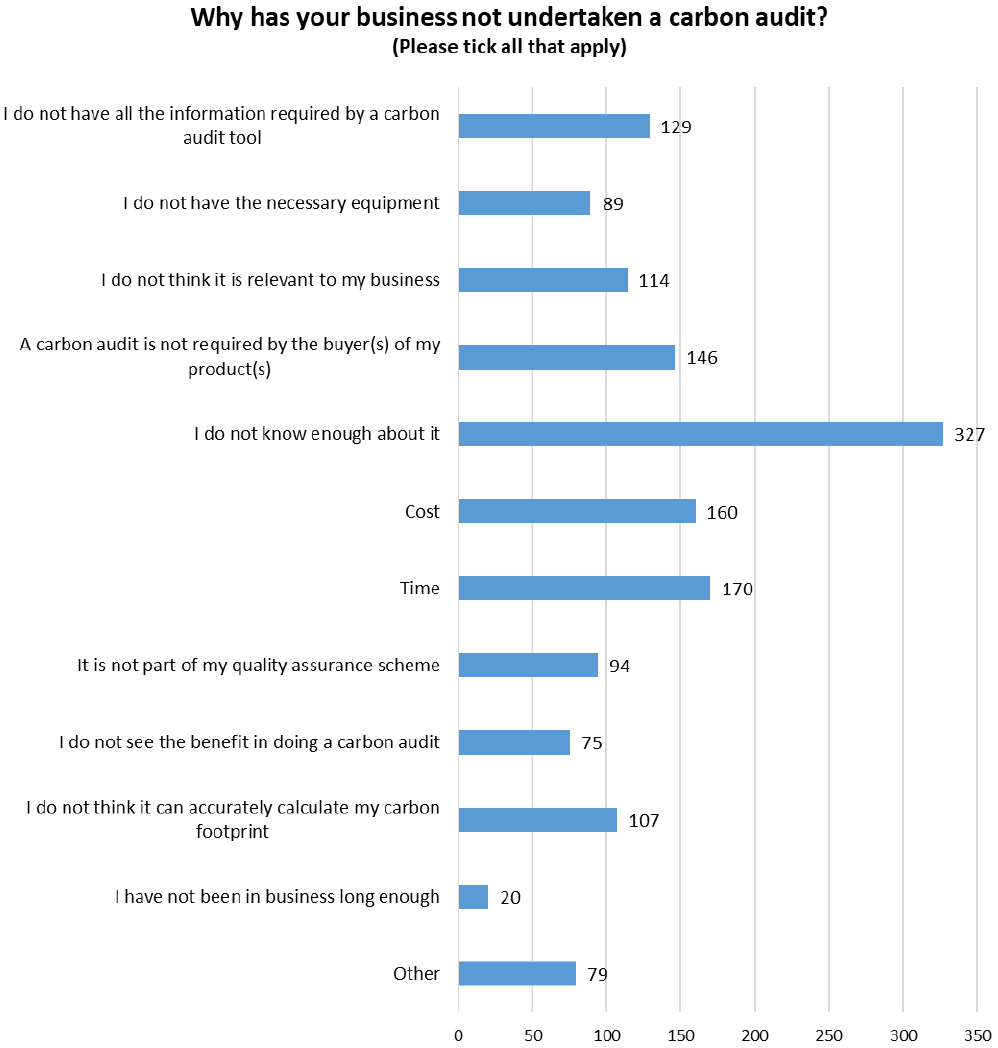
2.3.5 The reason why businesses have not undertaken a carbon audit
A large quantity of the respondents (605) who have not completed a carbon audit, 54% (327), state that they do not know enough about the process. 28.1% (170) due to time, closely followed with 26.4% (160) of respondents stating cost (Figure 37 and Table 26). Respondents noted that the carbon tools currently on the market do not always match their enterprises (for example, crofts, bogs, deer and renewables) making it difficult to get accurate readings. These is also a belief as there is no carbon audit standardisation that the tools currently on the market do not account for carbon accurately. Others state that they feel that the agricultural industry is being unfairly targeted when there are bigger carbon culprits across Scotland.
| Reason for not undertaking carbon audit | Total Respondents | Percentage (Denominator 605) |
|---|---|---|
| I do not have all the information required by a carbon audit tool | 129 | 21.3% |
| I do not have the necessary equipment | 89 | 14.7% |
| I do not think it is relevant to my business | 114 | 18.8% |
| A carbon audit is not required by the buyer(s) of my product(s) | 146 | 24.1% |
| I do not know enough about it | 327 | 54.0% |
| Cost | 160 | 26.4% |
| Time | 170 | 28.1% |
| It is not part of my quality assurance scheme | 94 | 15.5% |
| I do not see the benefit in doing a carbon audit | 75 | 12.4% |
| I do not think it can accurately calculate my carbon footprint | 107 | 17.7% |
| I have not been in business long enough | 20 | 3.3% |
| Other | 79 | 13.1% |
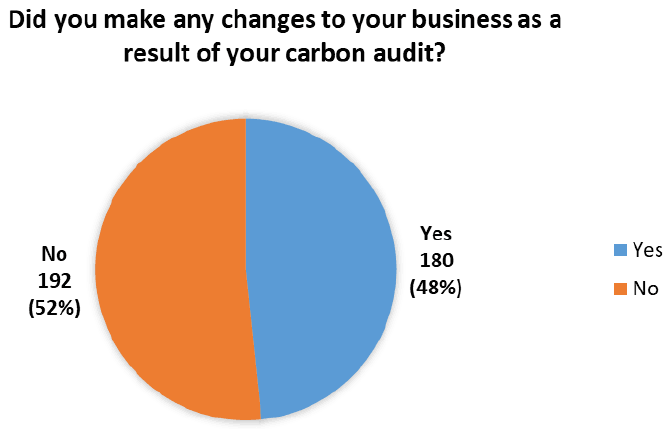
2.3.6 Changes to businesses as a result of a carbon audit
Figure 38 shows that just 51.6% (192) of the participants that have conducted a carbon audit in the past have not made any changes suggested to them in their carbon audit. Further insight into why participants of the survey are not carrying out these audit suggestions can be found in section 2.3.12.
2.3.7 The energy efficiency changes respondents implemented/intend to implement following a carbon audit
Those who have implemented/or intend to implement energy efficiency changes following a carbon audit (180), 55.6% (100) noted the biggest change was/would be to the assessment of the efficiency of working practices. 47.2% (85) stated the reduction of energy lighting and a further 47.2% (85) noted the assessment of the efficiency of existing vehicles, fixed equipment and machinery (Figure 39 and Table 27).
Respondents also noted that there were no collection systems in Northern Scotland for the recycling of agricultural plastics.
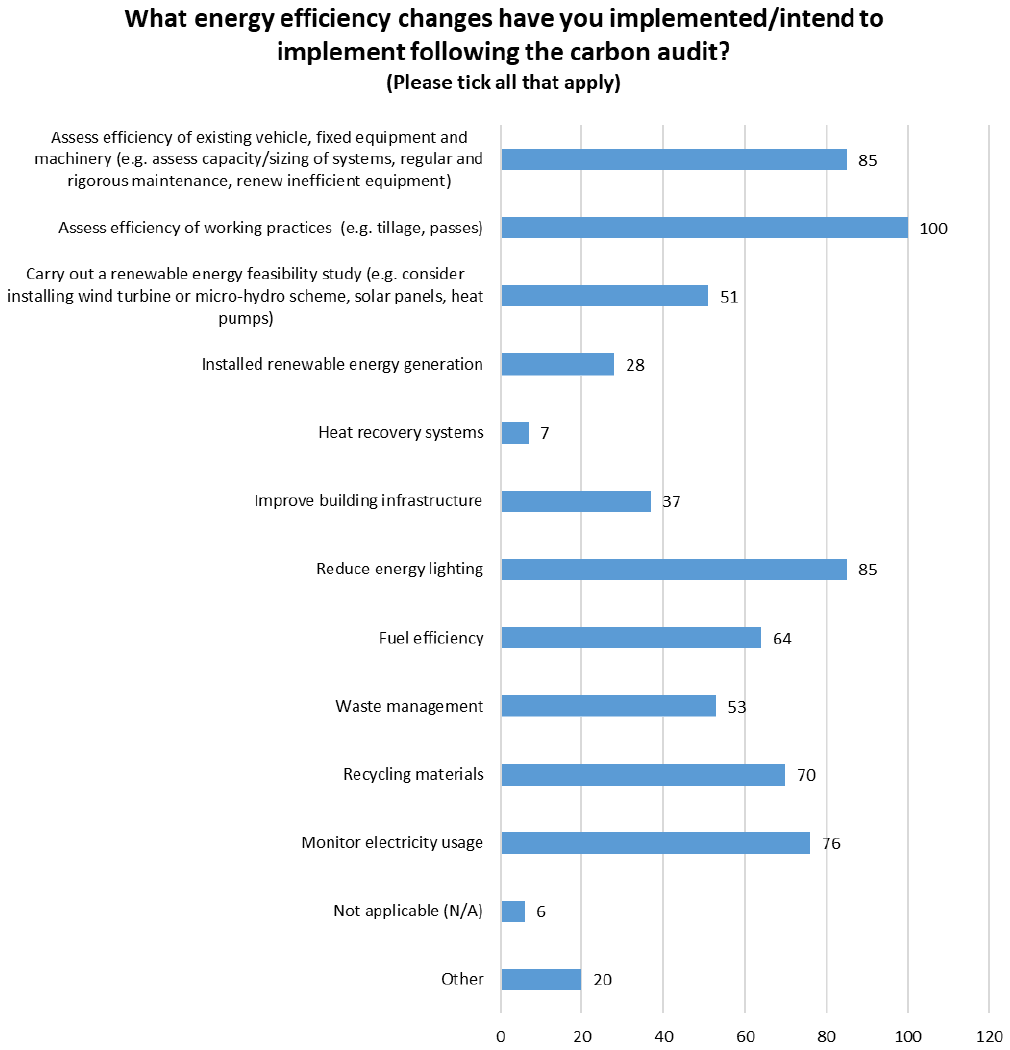
| Energy Efficiency Changes | Total Respondents | Percentage (Denominator 180) |
|---|---|---|
| Assess efficiency of existing vehicle, fixed equipment and machinery (e.g. assess capacity/sizing of systems, regular and rigorous maintenance, renew inefficient equipment) | 85 | 47.2% |
| Assess efficiency of working practices (e.g. tillage, passes) | 100 | 55.6% |
| Carry out a renewable energy feasibility study (e.g. consider installing wind turbine or micro-hydro scheme, solar panels, heat pumps) | 51 | 28.3% |
| Installed renewable energy generation | 28 | 15.6% |
| Heat recovery systems | 7 | 3.9% |
| Improve building infrastructure | 37 | 20.6% |
| Reduce energy lighting | 85 | 47.2% |
| Fuel efficiency | 64 | 35.6% |
| Waste management | 53 | 29.4% |
| Recycling materials | 70 | 38.9% |
| Monitor electricity usage | 76 | 42.2% |
| Not applicable (N/A) | 6 | 3.3% |
| Other | 20 | 11.1% |
2.3.8 The technology efficiency changes respondents implemented/intend to implement following a carbon audit
Those who have implemented/or intend to implement technology efficiency changes following a carbon audit (180), 38.3% (69), noted the biggest change was/would be the use of precision technology. While a further 38.3% (69) have implemented/or intend to implement the use of EID equipment (Figure 40 and Table 28).
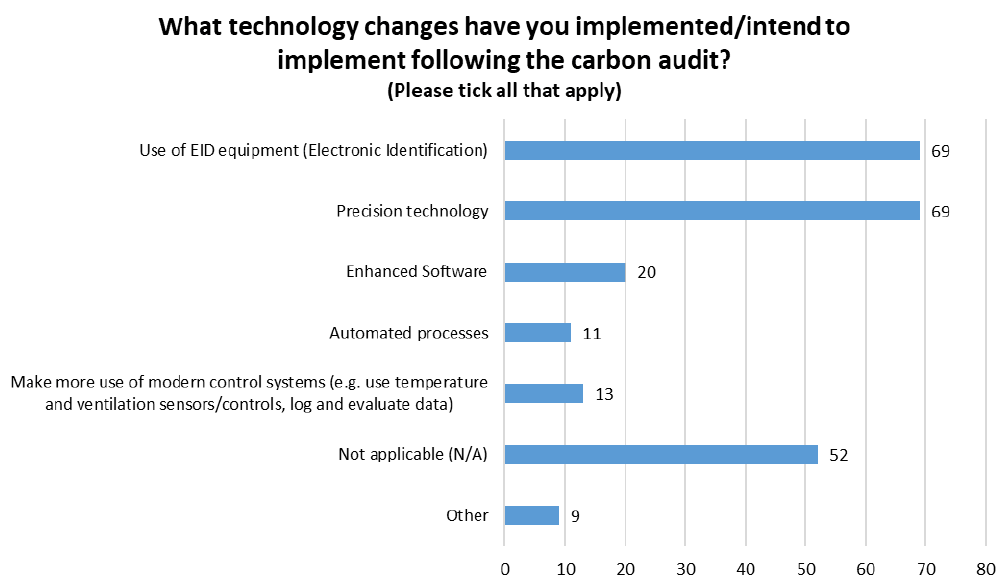
| Technology Efficiency Changes | Total Respondents | Percentage (Denominator 180) |
|---|---|---|
| Use of EID equipment (Electronic Identification) | 69 | 38.3% |
| Precision technology | 69 | 38.3% |
| Enhanced Software | 20 | 11.1% |
| Automated processes | 11 | 6.1% |
| Make more use of modern control systems (e.g. use temperature and ventilation sensors/controls, log and evaluate data) | 13 | 7.2% |
| Not applicable (N/A) | 52 | 28.9% |
| Other | 9 | 5.0% |
2.3.9 The crop and soil efficiency changes respondents implemented/intend to implement following a carbon audit
Those who have implemented/or intend to implement crop and soil changes following a carbon audit (180), 70% (126) noted the biggest change was/would be livestock manure efficiency. 56.7% (102) stated the efficient use of inputs and 49.4% (89) noted inorganic fertiliser efficiency (Figure 41 and Table 29). Respondents noted that soil sampling was also practiced as well as plant tissue analysis.
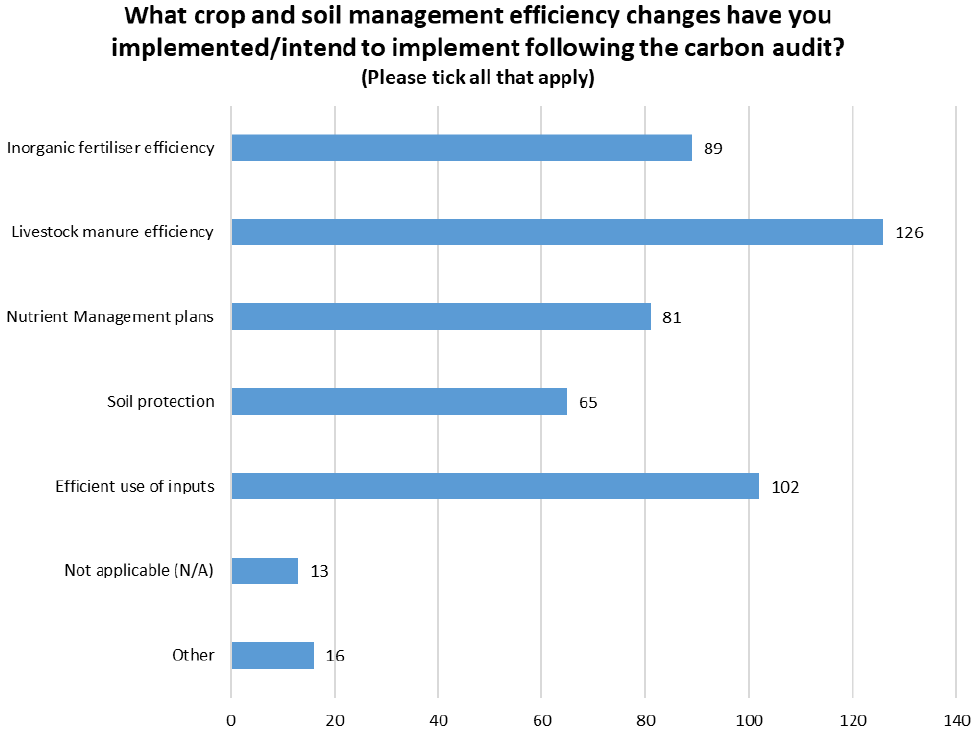
| Crop and Soil Management Changes | Total Respondents | Percentage (Denominator 180) |
|---|---|---|
| Inorganic fertiliser efficiency | 89 | 49.4% |
| Livestock manure efficiency | 126 | 70.0% |
| Nutrient Management plans | 81 | 45.0% |
| Soil protection | 65 | 36.1% |
| Efficient use of inputs | 102 | 56.7% |
| Not applicable (N/A) | 13 | 7.2% |
| Other | 16 | 8.9% |
2.3.10 The livestock management changes respondents implemented/intend to implement following a carbon audit
Those who have implemented/or intend to implement livestock changes following a carbon audit (180), 55.6% (100) noted the biggest change was/would be breeding and fertility improvements. 53.9% (97) stated animal health measures including disease control and 48.9% (88) noted feeding regime improvements (Figure 42 and Table 30). Respondents noted that they implemented better grazing management and replaced livestock more suited to the environment in which the business is based. ‘Other’ answers highlight the conversion to organic farming.
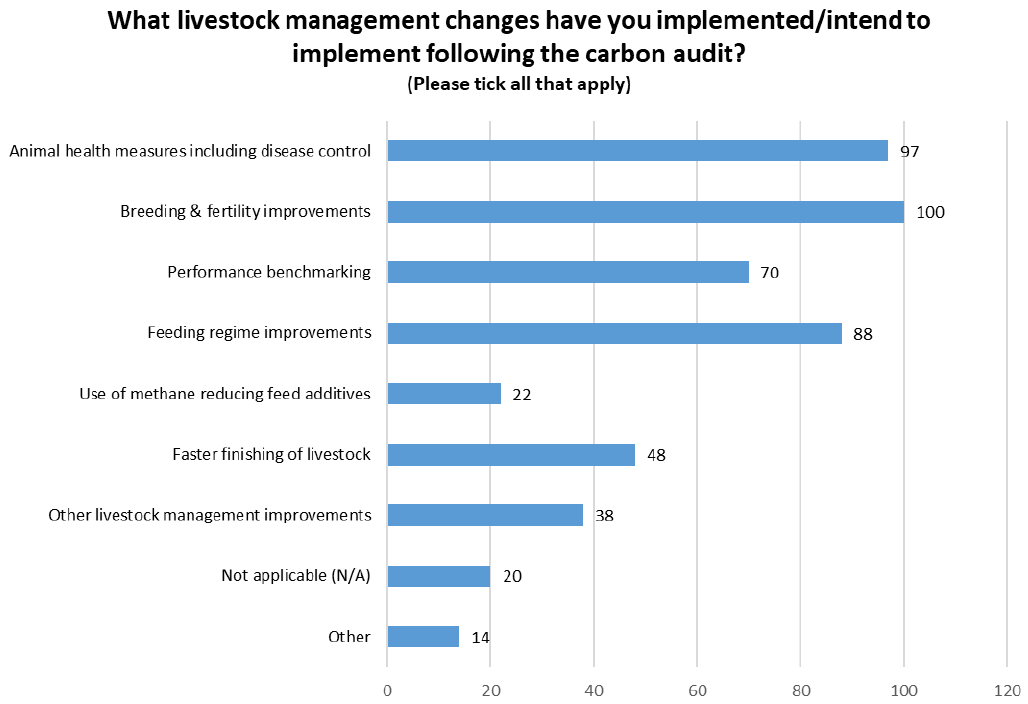
| Livestock Management Changes | Total Respondents | Percentage (Denominator 180) |
|---|---|---|
| Animal health measures including disease control | 97 | 53.9% |
| Breeding & fertility improvements | 100 | 55.6% |
| Performance benchmarking | 70 | 38.9% |
| Feeding regime improvements | 88 | 48.9% |
| Use of methane reducing feed additives | 22 | 12.2% |
| Faster finishing of livestock | 48 | 26.7% |
| Other livestock management improvements | 38 | 21.1% |
| Not applicable (N/A) | 20 | 11.1% |
| Other | 14 | 7.8% |
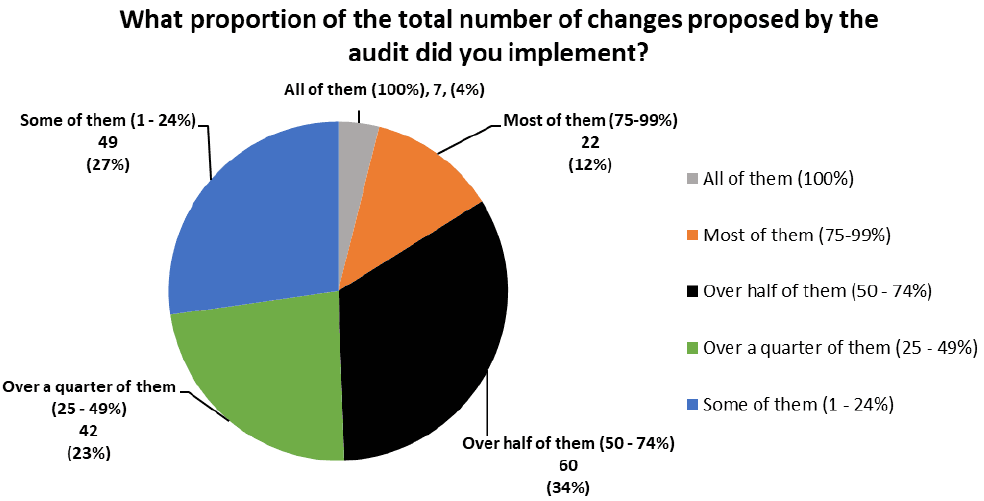
2.3.11 Proportion changes proposed by the audit were implemented
49.4% (89) of respondents have implemented over half of the changes proposed by the carbon audit. 27.2% (49) respondents have implemented less than quarter of the changes proposed by the carbon audit (Figure 43).
2.3.12 Reasons why actions have not been implemented following a carbon audit
Out of the 192 respondents who did not implement actions following a carbon audit 29.7% (57) noted that there were no recommendations for change to their holding (Figure 44 and Table 31).
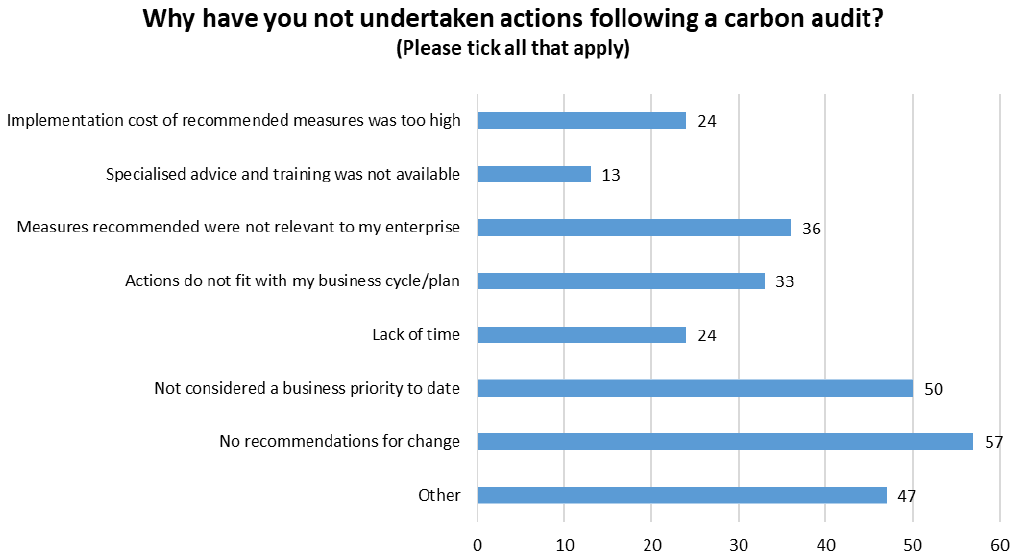
| Reasons for not making changes after a carbon audit | Total Respondents | Percentage (Denominator 192) |
|---|---|---|
| Implementation cost of recommended measures was too high | 24 | 12.5% |
| Specialised advice and training was not available | 13 | 6.8% |
| Measures recommended were not relevant to my enterprise | 36 | 18.8% |
| Actions do not fit with my business cycle/plan | 33 | 17.2% |
| Lack of time | 24 | 12.5% |
| Not considered a business priority to date | 50 | 26.0% |
| No recommendations for change | 57 | 29.7% |
| Other | 47 | 24.5% |
2.4 Soil Testing
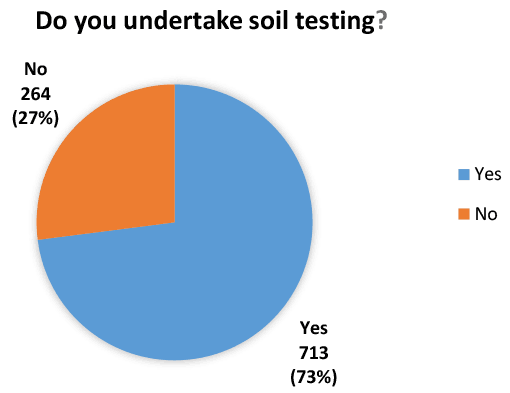
2.4.1 Businesses undertaking soil testing
Of the total respondents (977), 73% (713) state that they carry out soil testing for their enterprise (Figure 45).
2.4.2 Why businesses carry out soil testing
Out of the 713 respondents who stated that they do soil testing, 66.9% (477) of these respondents carry out soil testing to reduce input costs. 66.5% (474) noted that soil testing aids in the targeted use of inorganic fertiliser could be considered another cost saving measure (Figure 46 and Table 32).
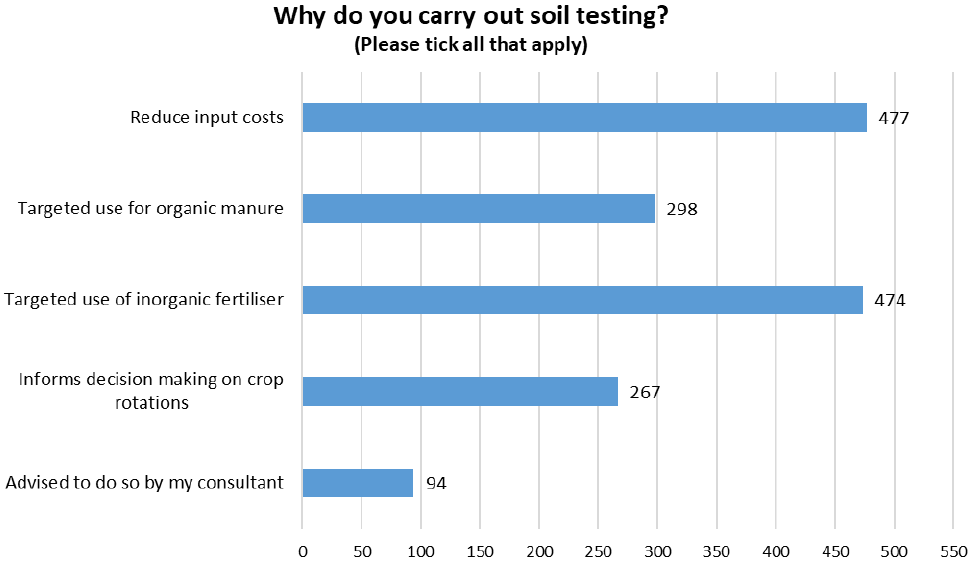
| Reasons for soil testing | Total Respondents | Percentage (Denominator 713) |
|---|---|---|
| Reduce input costs | 477 | 66.9% |
| Targeted use for organic manure | 298 | 41.8% |
| Targeted use of inorganic fertiliser | 474 | 66.5% |
| Informs decision making on crop rotations | 267 | 37.4% |
| Advised to do so by my consultant | 94 | 13.2% |
2.4.3 Soil testing measurements
pH accounts for 98.9% (705) of the soil testing measurements taken by the participants of this survey, with only 41.2% (294) of respondents conducting organic matter analysis (Figure 47 and Table 33).
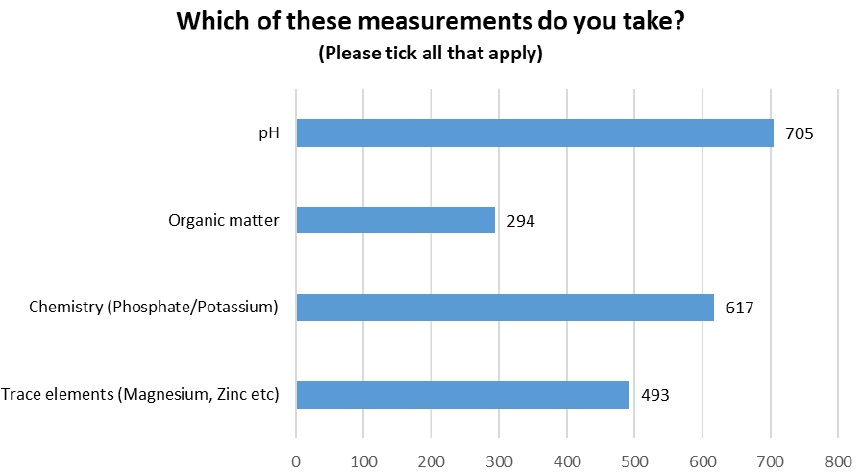
| Soil testing measurements | Total Respondents | Percentage (Denominator 713) |
|---|---|---|
| pH | 705 | 98.9% |
| Organic matter | 294 | 41.2% |
| Chemistry (Phosphate/Potassium) | 617 | 86.5% |
| Trace elements (Magnesium, Zinc etc.) | 493 | 69.1% |
2.4.4 The frequency of which businesses take soil testing measurements
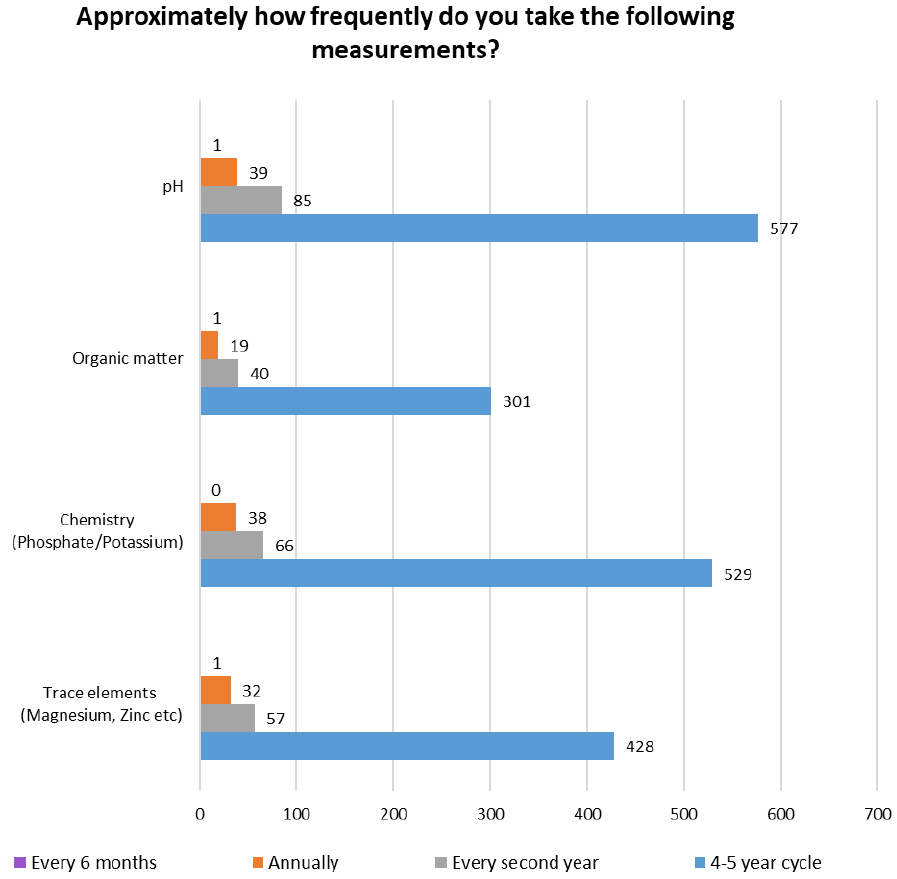
In most cases pH, Organic matter, Chemistry and Trace element measurements are taken across a sample of fields over a 4-5 year cycle with only three respondents doing pH, trace element and organic matter analysis every 6 months (Figure 48 and Table 34).
Respondents have noted that they take the measurements normally when reseeding their fields or changing the crop type. Others also mentioned that in addition to the measurements included in this survey they also undertake plant tissue analysis and analysis of the soil microbiology.
| Soil Testing Measurements (Denominator 713) | Every 6 months | Annually | Every second year | 4-5 year cycle |
|---|---|---|---|---|
| pH | 1 | 39 | 85 | 577 |
| 0.14% | 5.47% | 11.92% | 80.93% | |
| Organic matter | 1 | 19 | 40 | 301 |
| 0.14% | 2.66% | 5.61% | 42.22% | |
| Chemistry (Phosphate/Potassium) | 0 | 38 | 66 | 529 |
| 0.00% | 5.33% | 9.26% | 74.19% | |
| Trace elements (Magnesium, Zinc etc.) | 1 | 32 | 57 | 428 |
| 0.14% | 4.49% | 7.99% | 60.03% |
2.5 Nutrient Management Plan
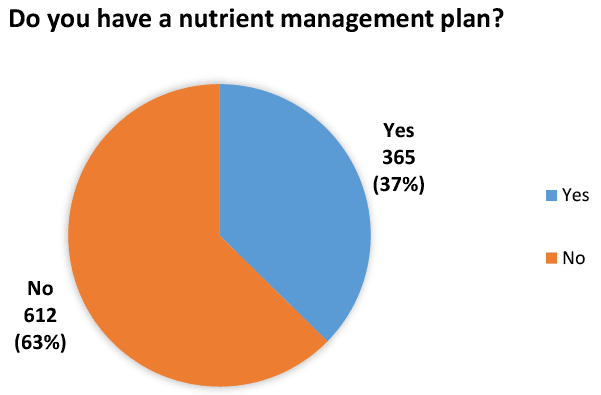
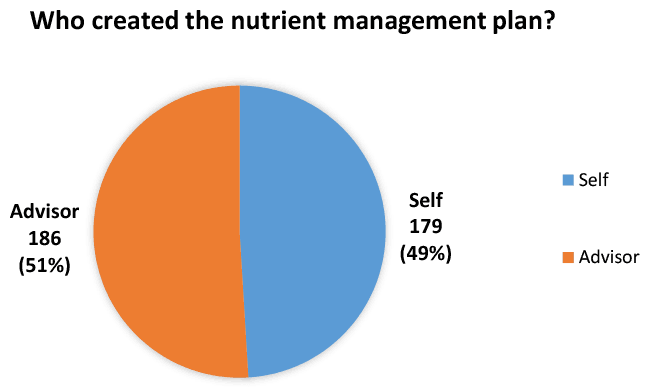
Out of the 365 (37.4%) respondents who stated that they have a nutrient management plan, 49% (179) use an advisor to complete the plan, while 51% (186) complete the plan themselves (Figure 49 and 50).
The method used predominantly to record a nutrient management plan by the respondents is paper accounting for 40.8% (149) of respondents followed 29.3% (107) who use the SRUC Technical Notes. 20.5% (75) of the respondents use paper records only to record their nutrient management plan (Figure 51 and Table 35).
Other system used by the respondents included RHIZA, Muddy Boots, National Milk Records (NMR), Scottish Agronomy and SOYL along with Nitrogen Vulnerable Zones (NVZ) plans in collaboration with Scottish Agencies (SRUC and SAC).
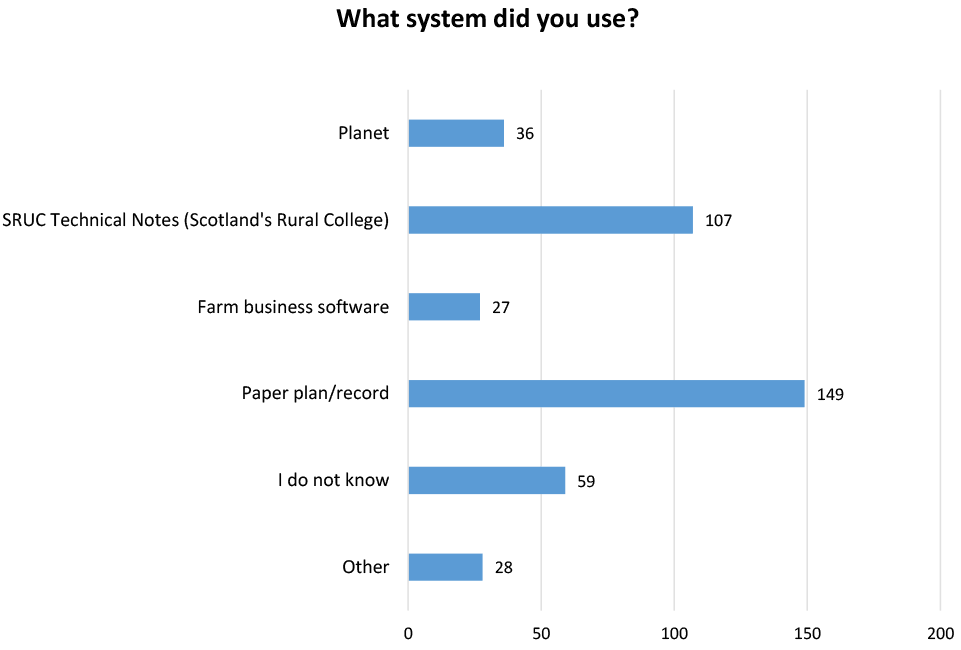
| Nutrient Management Plan System | Total Respondents | Percentage (Denominator 365) |
|---|---|---|
| Planet | 36 | 9.9% |
| SRUC Technical Notes (Scotland's Rural College) | 107 | 29.3% |
| Farm business software | 27 | 7.4% |
| Paper plan/record | 149 | 40.8% |
| I do not know | 59 | 16.2% |
| Other | 28 | 7.7% |
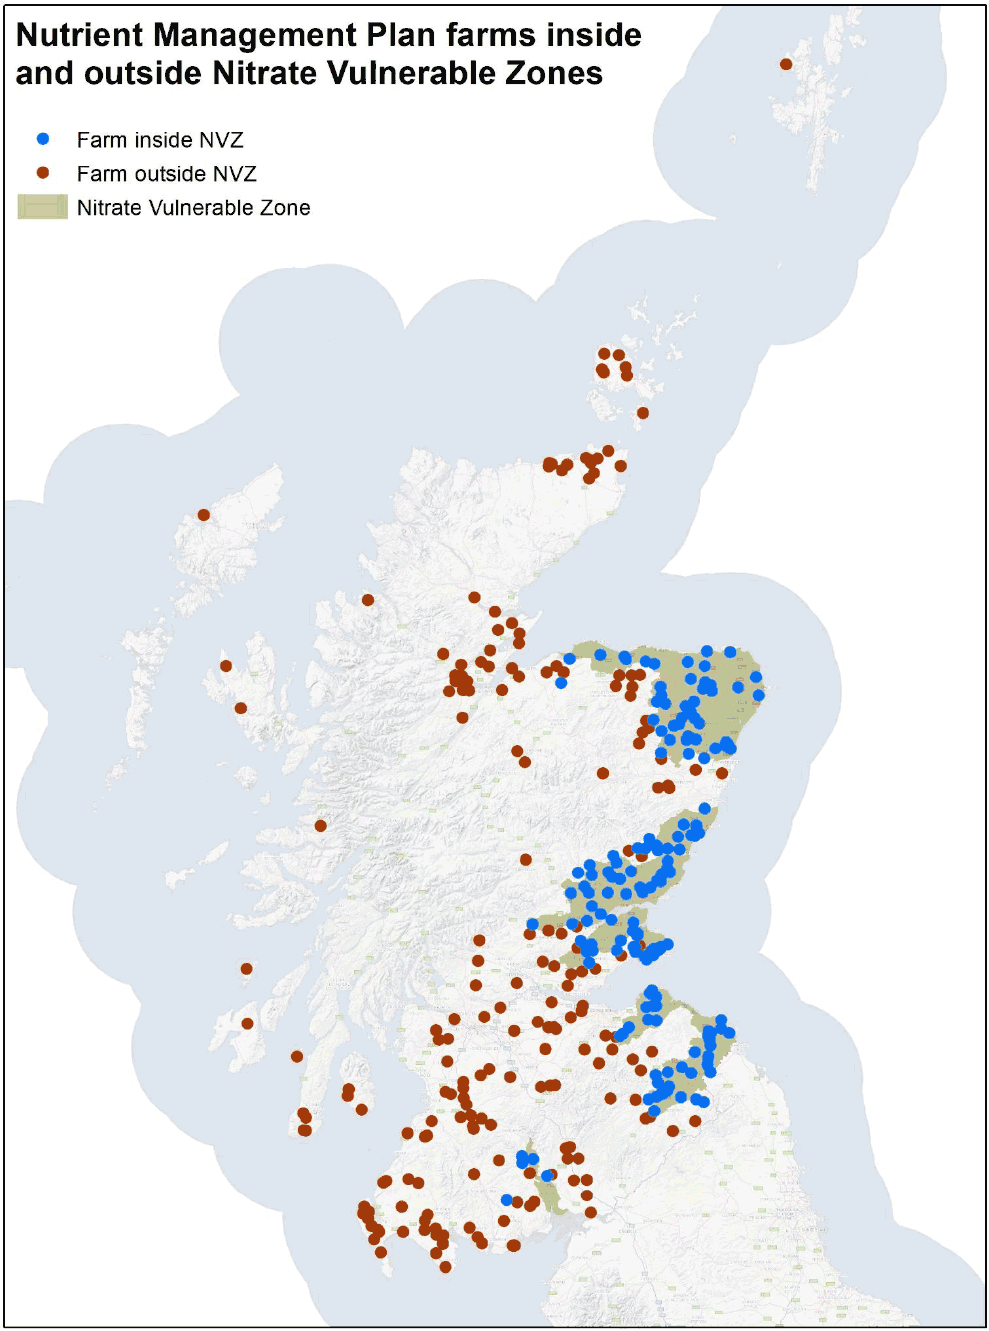
A Nutrient Management Plan is a requirement for farms located within a Nitrate Vulnerable Zone (NVZ). Out of the 365 businesses who responded “Yes” to carrying out a Nutrient Management Plan, 54.8% (200) are located within a NVZ (Figure 52).
2.6 Soil Management
In terms of soil management, the most common practice conducted by 53.9% (527) of respondents is keeping pH at an optimum level. 52.1% (509) target the use of organic manure (Figure 53 and Table 36).
54.2% (529) of respondents have never integrated pulses/legumes into cropping. 53.1% (519) have never used catch or cover crops and 52.8% (516) have never used nitrification inhibitors (Figure 53). 37.6% (367) of the respondents do not know enough about the use of nitrification inhibitors while 19% (186) do not know enough about visual evaluation of soil structure (VESS).
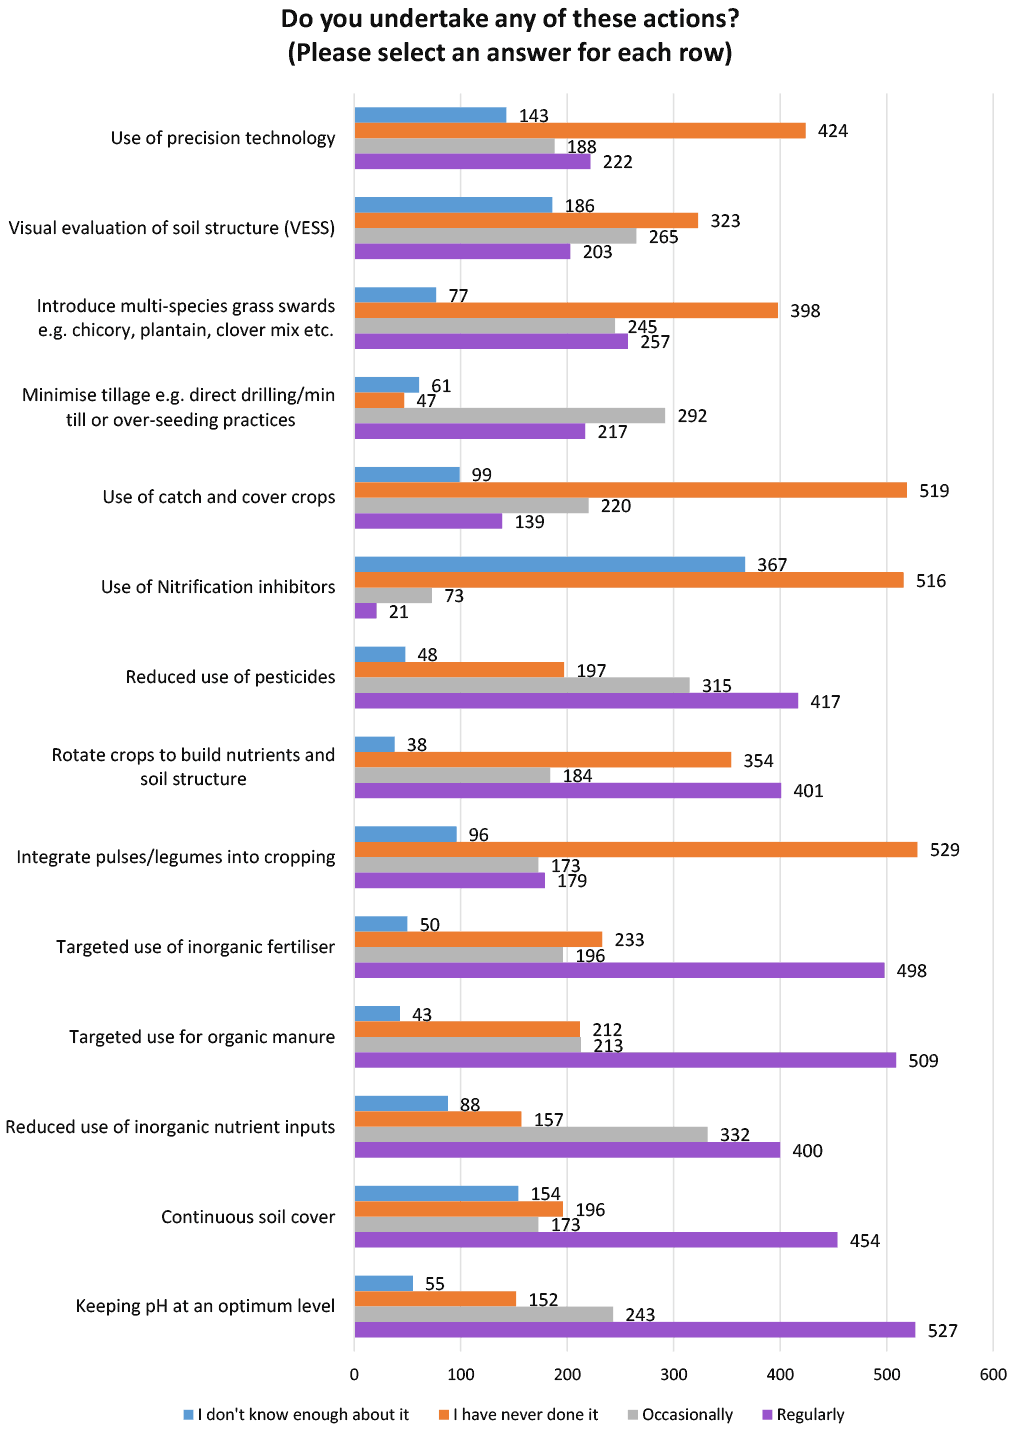
| Soil Management Practices (Denominator 977) | I don't know enough about it | I have never done it | Occasionally | Regularly |
|---|---|---|---|---|
| Use of precision technology | 143 | 424 | 188 | 222 |
| 14.6% | 43.4% | 19.2% | 22.7% | |
| Visual evaluation of soil structure (VESS) | 186 | 323 | 265 | 203 |
| 19.0% | 33.1% | 27.1% | 20.8% | |
| Introduce multi-species grass swards e.g. chicory, plantain, clover mix etc. | 77 | 398 | 245 | 257 |
| 7.9% | 40.7% | 25.1% | 26.3% | |
| Minimise tillage e.g. direct drilling/min till or over-seeding practices | 61 | 47 | 292 | 217 |
| 6.2% | 4.8% | 29.9% | 22.2% | |
| Use of catch and cover crops | 99 | 519 | 220 | 139 |
| 10.1% | 53.1% | 22.5% | 14.2% | |
| Use of Nitrification inhibitors | 367 | 516 | 73 | 21 |
| 37.6% | 52.8% | 7.5% | 2.1% | |
| Reduced use of pesticides | 48 | 197 | 315 | 417 |
| 4.9% | 20.2% | 32.2% | 42.7% | |
| Rotate crops to build nutrients and soil structure | 38 | 354 | 184 | 401 |
| 3.9% | 36.2% | 18.8% | 41.0% | |
| Integrate pulses/legumes into cropping | 96 | 529 | 173 | 179 |
| 9.8% | 54.1% | 17.7% | 18.3% | |
| Targeted use of inorganic fertiliser | 50 | 233 | 196 | 498 |
| 5.1% | 23.8% | 20.1% | 51.0% | |
| Targeted use for organic manure | 43 | 212 | 213 | 509 |
| 4.4% | 21.7% | 21.8% | 52.1% | |
| Reduced use of inorganic nutrient inputs | 88 | 157 | 332 | 400 |
| 9.0% | 16.1% | 34.0% | 40.9% | |
| Continuous soil cover | 154 | 196 | 173 | 454 |
| 15.8% | 20.1% | 17.7% | 46.5% | |
| Keeping pH at an optimum level | 55 | 152 | 243 | 527 |
| 5.6% | 15.6% | 24.9% | 53.9% |
2.7 Manure Analysis
2.7.1 Business undertaking manure analysis
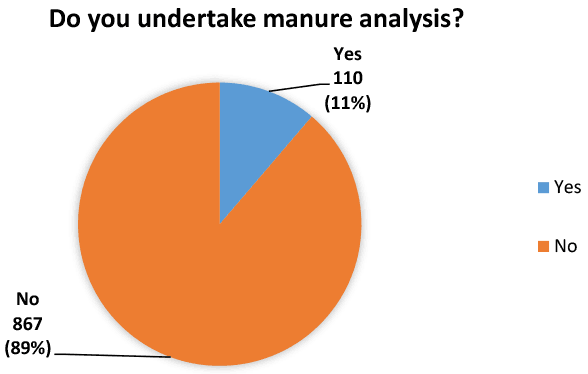
11% of the total respondents complete manure analysis (Figure 54). Reasons for participants not undertaking manure analysis can be found in section 2.7.5.
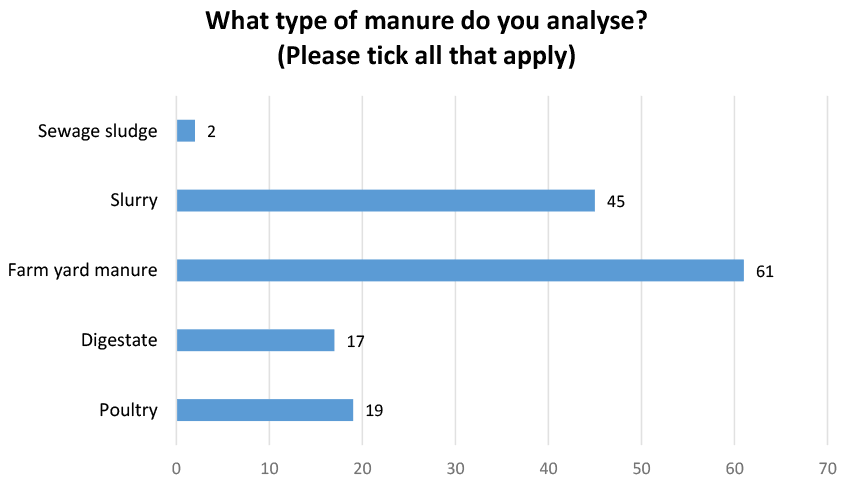
2.7.2 Most common type of manure analysis
The most common type of manure analysis according to the 110 respondents who do undertake manure analysis is farm yard manure accounting for 55.5% (61) of the respondents (Figure 55).
2.7.3 Why businesses carry out manure analysis
The main reason for 73.6% (81) of respondents to carry out manure analysis is to help them target the use of applications (Figure 56 and Table 37). Others made note that they had to do manure analysis as it was a requirement of their organic farming scheme. Others noted that they had to have their manure analysed to meet the PAS110 analysis requirements.
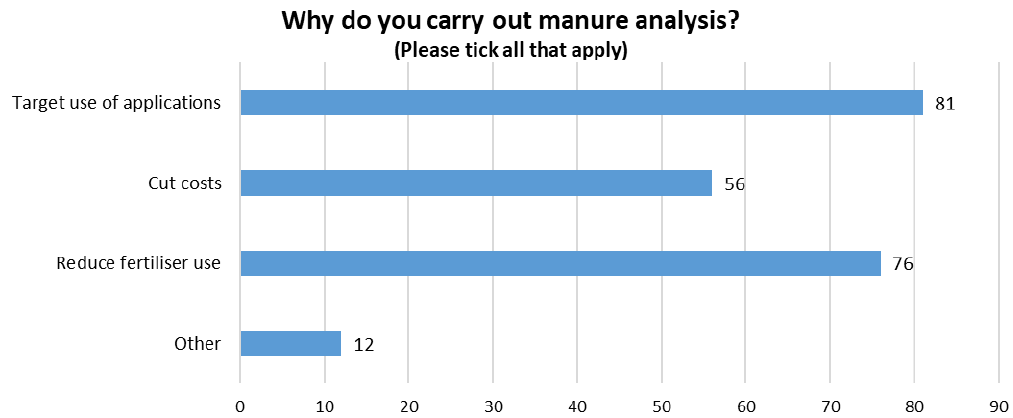
| Reasons for Manure Analysis | Total Respondents | Percentage (Denominator 110) |
|---|---|---|
| Target use of applications | 81 | 73.6% |
| Cut costs | 56 | 50.9% |
| Reduce fertiliser use | 76 | 69.1% |
| Other | 12 | 10.9% |
2.7.4 The changes made by businesses as a result of the manure analysis.
Since conducting manure analysis, 70% (77) of the respondents have reduced the amount of chemical fertiliser applied to their land followed, 51.8% (57) have changed the organic manure application rates (Figure 57 and Table 38). Respondents noted that the main change for their business has been the switch in focus from chemical nutrition to biological, others stated it was necessary to make changes to become more organic.
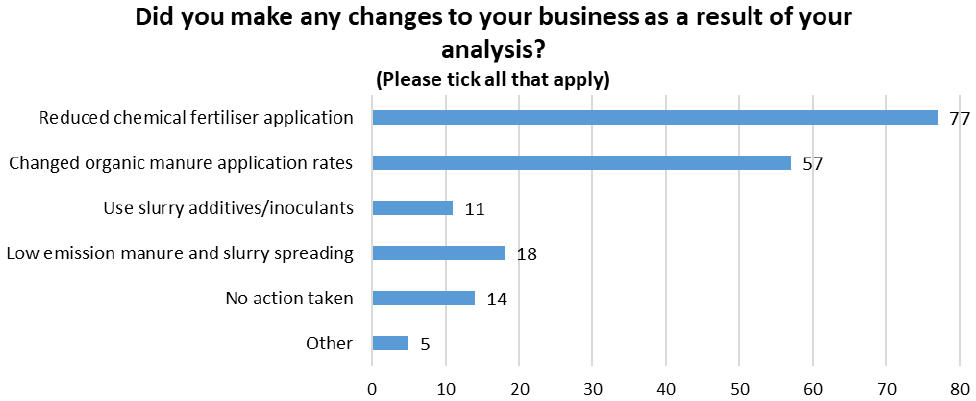
| Changes made after Manure Analysis | Total Respondents | Percentage (Denominator 110) |
|---|---|---|
| Reduced chemical fertiliser application | 77 | 70.0% |
| Changed organic manure application rates | 57 | 51.8% |
| Use slurry additives/inoculants | 11 | 10.0% |
| Low emission manure and slurry spreading | 18 | 16.4% |
| No action taken | 14 | 12.7% |
| Other | 5 | 4.5% |
2.7.5 Why businesses have not carried out manure analysis
Of the 867 respondents who stated that they do not carry out manure analysis, 36.1% (313) of them do not see the need in manure analysis while 28.5% (247) do not believe it is relevant to their business (Figure 58).
5.7% (49) of respondents have stated that their farms do not produce enough manure to merit getting it tested while 1.5% (13) had never heard of manure analysis before encountering it in this survey. On a positive note, 1.4% (12) mentioned that they plan on performing manure analysis in the future (Figure 59 and Table 39).
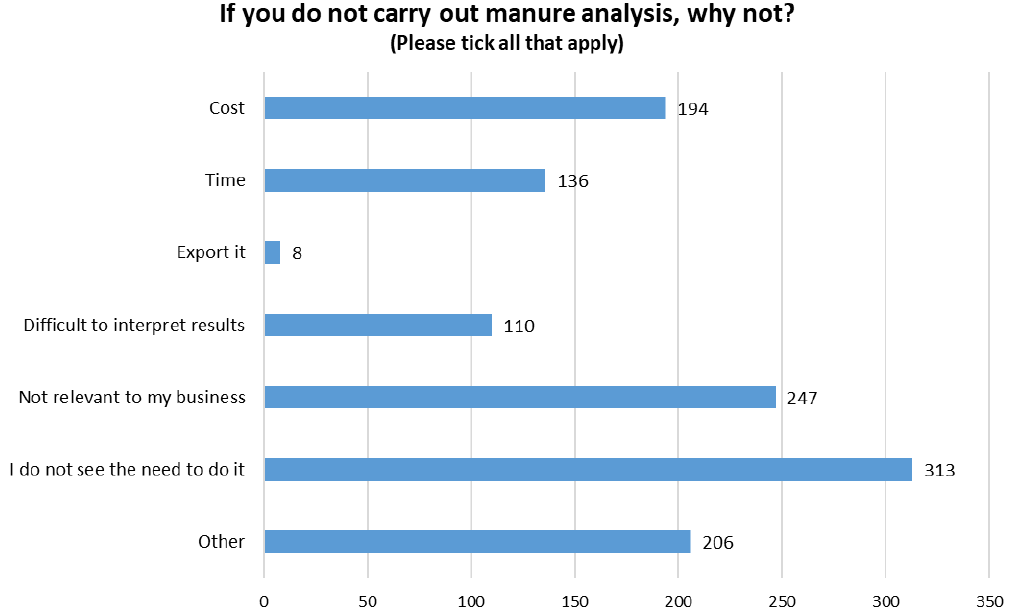
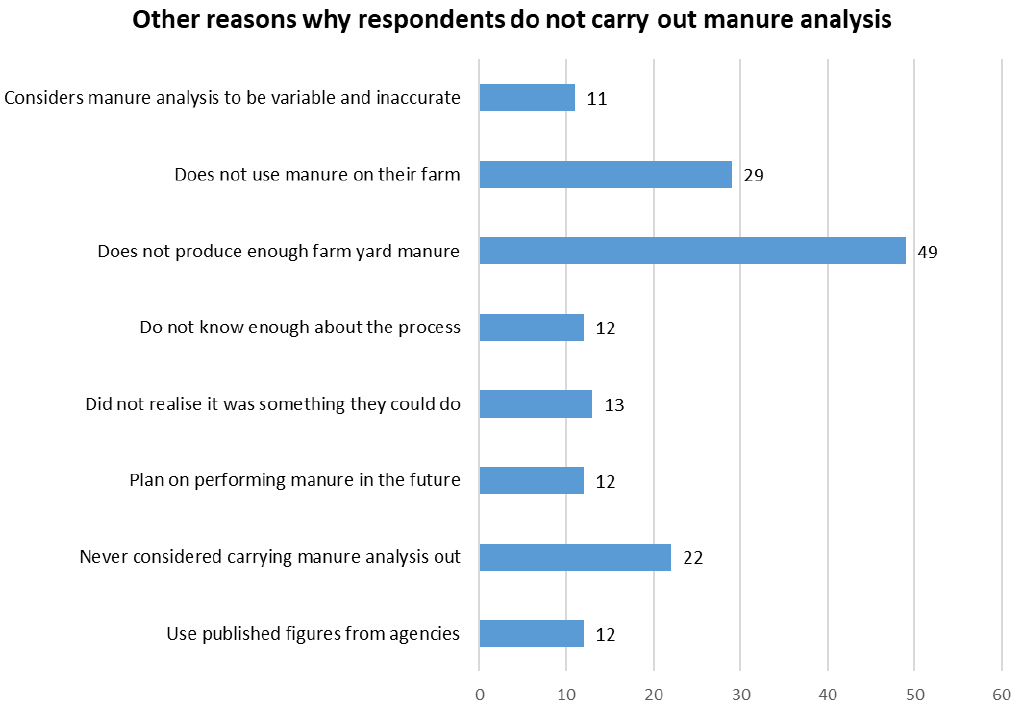
| Reasons as to why respondents do not carry out Manure Analysis | Total Respondents | Percentage (Denominator 867) |
|---|---|---|
| Cost | 194 | 22.4% |
| Time | 136 | 15.7% |
| Export it | 8 | 0.9% |
| Difficult to interpret results | 110 | 12.7% |
| Not relevant to my business | 247 | 28.5% |
| I do not see the need to do it | 313 | 36.1% |
| Considers manure analysis to be variable and inaccurate | 11 | 1.3% |
| Does not use manure on their farm | 29 | 3.3% |
| Does not produce enough farm yard manure | 49 | 5.7% |
| Do not know enough about the process | 12 | 1.4% |
| Did not realise it was something they could do | 13 | 1.5% |
| Plan on performing manure in the future | 12 | 1.4% |
| Never considered carrying manure analysis out | 22 | 2.5% |
| Use published figures from agencies | 12 | 1.4% |
| Other | 206 | 23.8% |
2.8 Forage Analysis
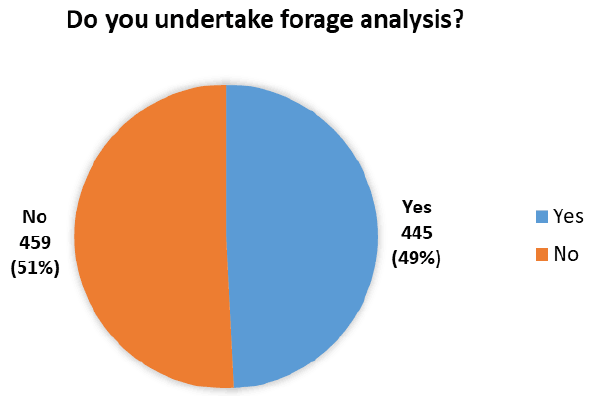
2.8.1 Businesses undertaking forage analysis
As seen in the graph below 49.2% (445) of the participants who have livestock enterprises undertake forage analysis for their business (Figure 60). Reasons as to why producers have not undertaken forage analysis can be found in section 2.8.4.
2.8.2 The types of forage analysis undertaken by businesses
91.2% (406) of the respondents use analysis techniques on their silage (Figure 61 and Table 40).
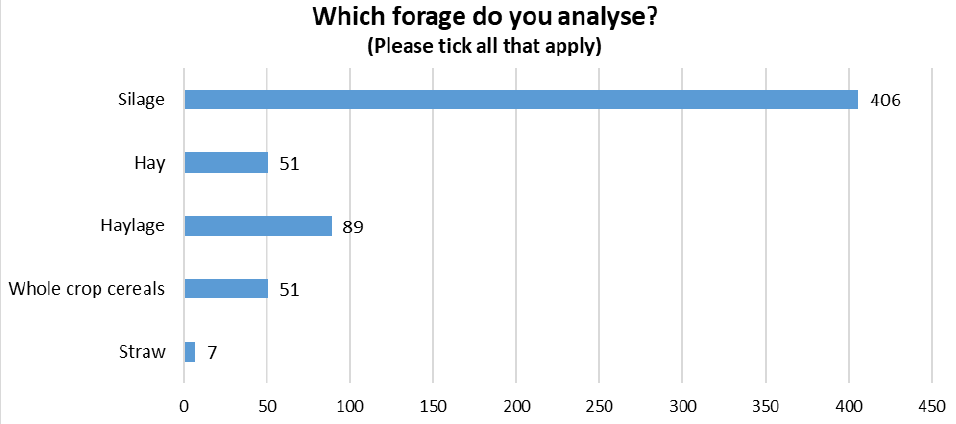
| Forage Analysis Type | Total Respondents | Percentage (Denominator 445) |
|---|---|---|
| Silage | 406 | 91.2% |
| Hay | 51 | 11.5% |
| Haylage | 89 | 20.0% |
| Whole crop cereals | 51 | 11.5% |
| Straw | 7 | 1.6% |
2.8.3 Changes made to business as a result of forage analysis
53.5% (238) respondents noted that they decreased the volume of concentrates per head after conducting forage analysis. 40.2% (179) have changed the volume of forage feed. 20.2% (90) of the respondents noted that they have not taken any actions after receiving the results of the forage analysis (Figure 62 and Table 41).
Many respondents noted that the results they receive from forage analysis will dictate what actions they undertake that year – it differs year upon year. Others noted that they undertake forage analysis every year and change winter rations according to the results – therefore at times concentrate use goes up, sometimes it reduces, sometimes it stays the same. It depends on both the analysis results and the stock being fed.
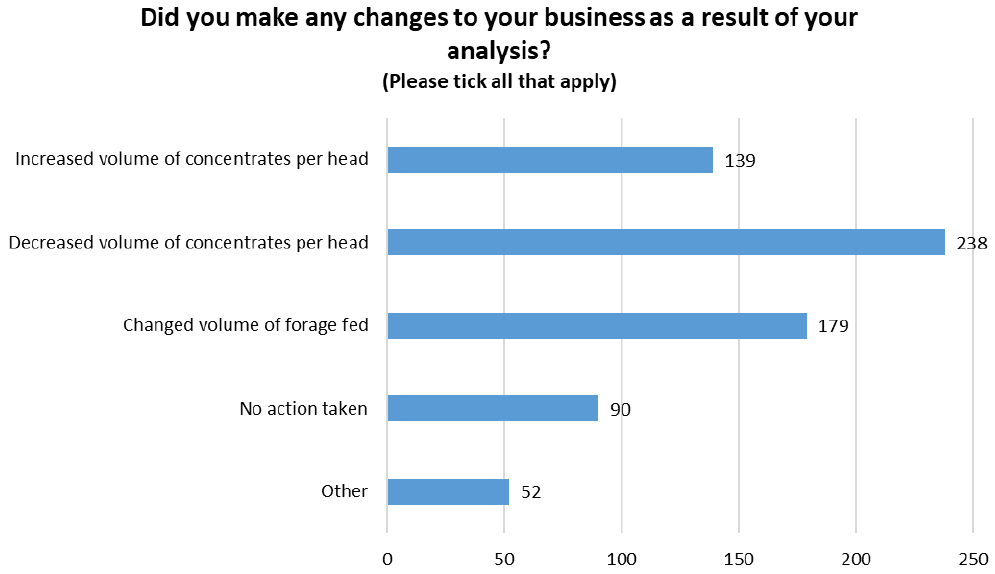
| Forage Changes | Total Respondents | Percentage (Denominator 445) |
|---|---|---|
| Increased volume of concentrates per head | 139 | 31.2% |
| Decreased volume of concentrates per head | 238 | 53.5% |
| Changed volume of forage fed | 179 | 40.2% |
| No action taken | 90 | 20.2% |
| Other | 52 | 11.7% |
2.8.4 Why some businesses do not carry out forage analysis
The majority of respondents (459) have not carried out forage analysis as 35.7% (164) do not believe it is relevant to their business while 30.7% (141) do not see the need in doing the analysis (Figure 63 and Table 42).
Respondents noted that examining their livestock performance or considering their weights are enough of an indicator as to whether the forage is of good quality along with helping the respondent determine how much feed to supply the livestock with. Others stated that their business is too small for it to be worth the cost. 1.3% (6) stated that they did not know enough about the process while others are considering undertaking forage analysis in the future.
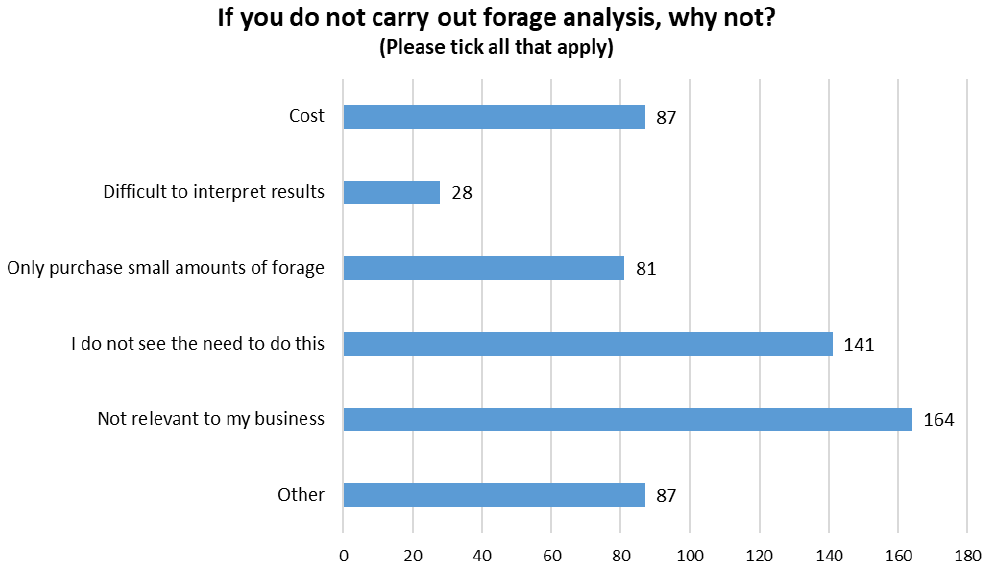
| Reasons for not making changes after forage analysis | Total Respondents | Percentage (Denominator 459) |
|---|---|---|
| Cost | 87 | 19.0% |
| Difficult to interpret results | 28 | 6.1% |
| Only purchase small amounts of forage | 81 | 17.6% |
| I do not see the need to do this | 141 | 30.7% |
| Not relevant to my business | 164 | 35.7% |
| Other | 87 | 19.0% |
2.9 Feed Ration Plan
2.9.1 Businesses undertaking a feed ration plan
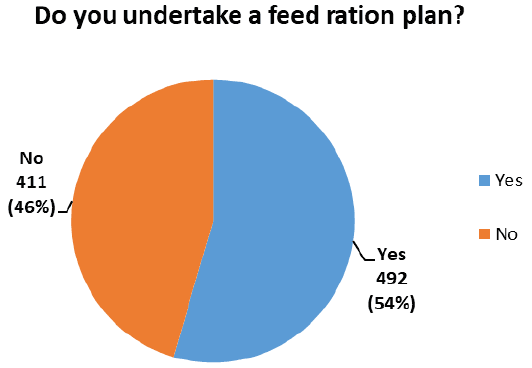
Out of the 903 respondents who answered this section of the survey, 54.5% (492) have undertaken a feed ration plan (Figure 64). Reasons as to why businesses have not undertaken a feed ration plan can be found in section 2.9.5.
2.9.2 Business types undertaking feed ration plans
71.8% (353) of respondents who carry out feed ration plans (492) undertake it for their beef followed by 51.8% (255) who undertake it for their sheep (Figure 65 and Table 43). Respondents also noted that they carry out feed ration plans for their horses as well bees.
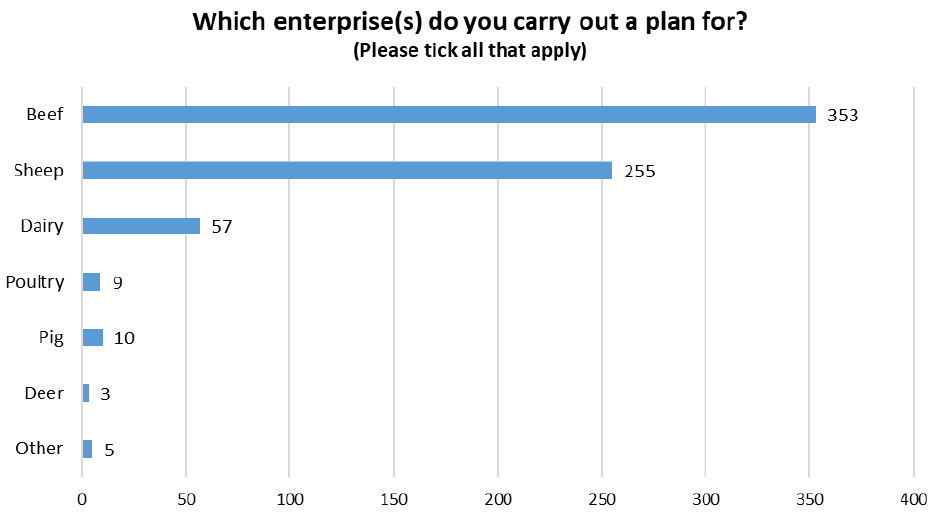
| Enterprise Type | Total Respondents | Percentage (Denominator 492) |
|---|---|---|
| Beef | 353 | 71.7% |
| Sheep | 255 | 51.8% |
| Dairy | 57 | 11.6% |
| Poultry | 9 | 1.8% |
| Pig | 10 | 2.0% |
| Deer | 3 | 0.6% |
| Other | 5 | 1.0% |
2.9.3 Who created the feed ration plan and how often is it reviewed
55.7% (274) of the respondents create their own feed ration plan followed by 48.8% (240) who get assistance from a feed representative (Figure 66 and Table 44). 48% (236), of the respondents carry out reviews of their feed ration plan each year, while 30.7% (151) update their plan on a more continuous basis (Figure 67 and Table 45).
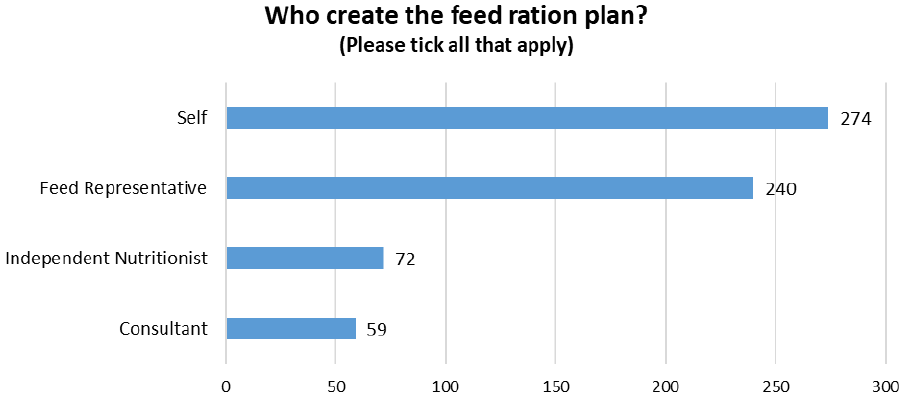
| Who created the feed ration plan | Total Respondents | Percentage (Denominator 492) |
|---|---|---|
| Self | 274 | 55.7% |
| Feed Representative | 240 | 48.8% |
| Independent Nutritionist | 72 | 14.6% |
| Consultant | 59 | 12.0% |
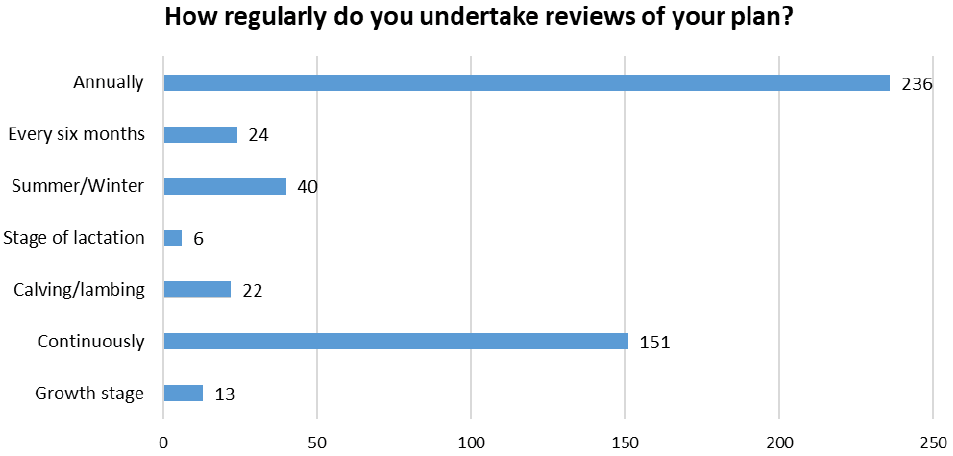
| Feed Ration Plan Occurrence | Total Respondents | Percentage (Denominator 492) |
|---|---|---|
| Annually | 236 | 48.0% |
| Every six months | 24 | 4.9% |
| Summer/Winter | 40 | 8.1% |
| Stage of lactation | 6 | 1.2% |
| Calving/lambing | 22 | 4.5% |
| Continuously | 151 | 30.7% |
| Growth stage | 13 | 2.6% |
2.9.4 Actions made by a business as a result of a feed ration plan
60.8% (299) of respondents noted that they implemented continuous monitoring after initially completing a feed ration plan. 56.1% (276) reduced concentrates usage per head (Figure 68 and Table 46). 5.1% (25) of the respondents noted that they take no action after completing of a feed ration plan (Figure 68 and Table 46).
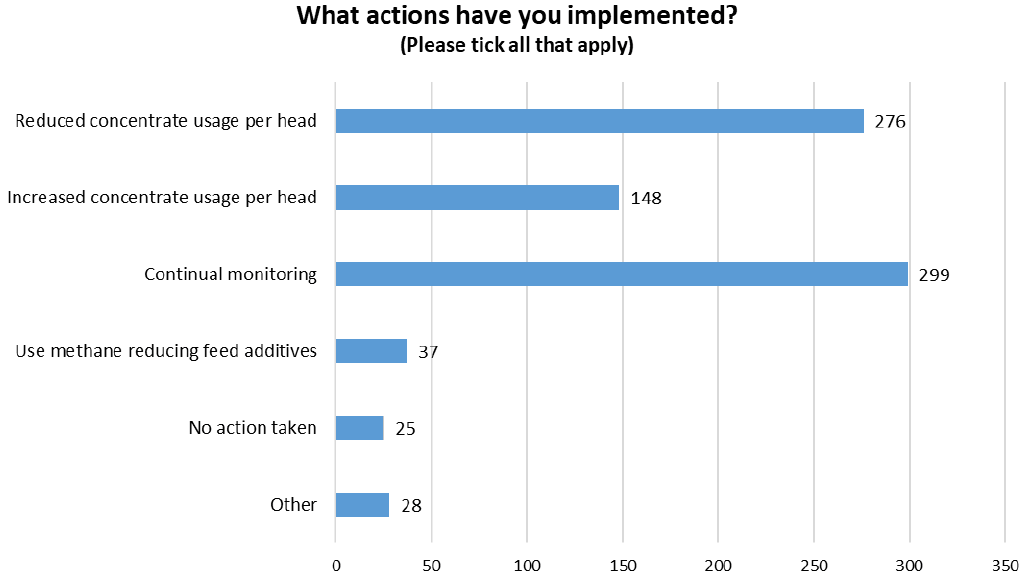
| Feed Ration Plan Actions | Total Respondents | Percentage (Denominator 492) |
|---|---|---|
| Reduced concentrate usage per head | 276 | 56.1% |
| Increased concentrate usage per head | 148 | 30.1% |
| Continual monitoring | 299 | 60.8% |
| Use methane reducing feed additives | 37 | 7.5% |
| No action taken | 25 | 5.1% |
| Other | 28 | 5.7% |
2.9.5 Why businesses do not carry out feed ration plans
Of the 411 respondents have not carried out a feed plan, 42.3% (174) did not believe it is relevant to their business and 39.2.% (161) do not see the need in doing the analysis (Figure 69 and Table 47).
Many of the respondents stated that they rely on body condition scoring of animals appropriate for the time of year. Others noted that they do not have the relevant equipment for weighing and dispensing feed while others are Pasture for Life certified and therefore do not give feed to their livestock.
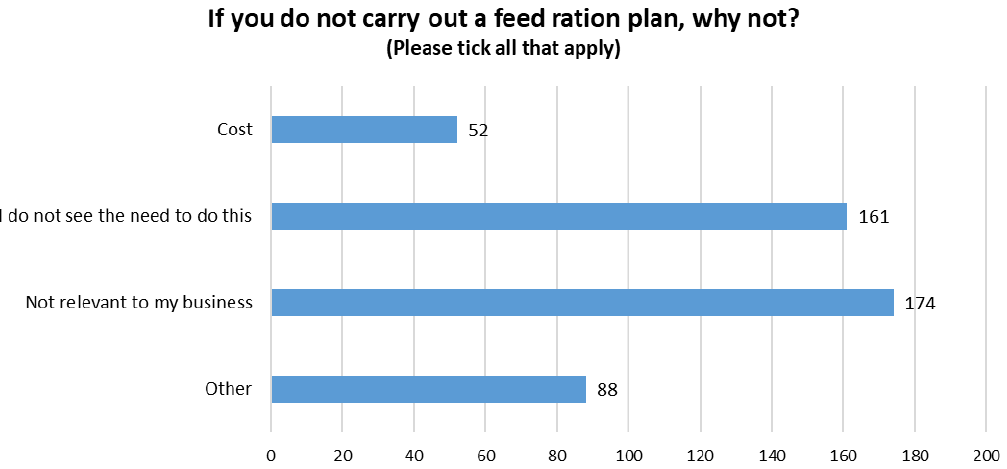
| Reasons why respondents have not undertaken a feed ration plan | Total Respondents | Percentage (Denominator 411) |
|---|---|---|
| Cost | 52 | 12.7% |
| I do not see the need to do this | 161 | 39.2% |
| Not relevant to my business | 174 | 42.3% |
| Other | 88 | 21.4% |
2.10 Animal Health and Welfare Plan
2.10.1 Businesses undertaking an animal health and welfare plan
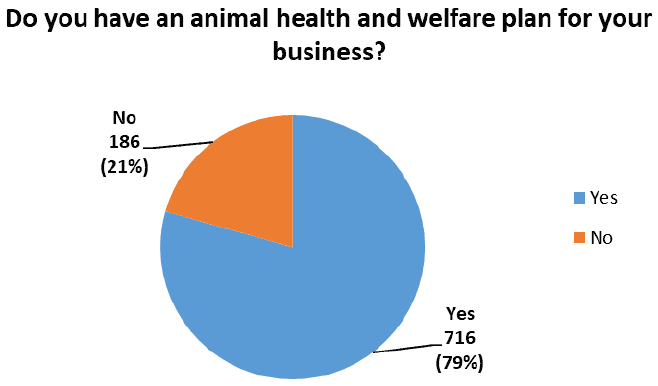
Out of the 902 respondents who answered this section of the survey, 79.4% (716) have an animal health and welfare plan (Figure 70). Reasons as to why participants have not undertaken an animal health and welfare plan can be found in section 2.10.7.
2.10.2 Businesses with an accredited animal health and welfare plan
76.8% (550) of the accredited animal health and welfare plans used by the respondents (716) is Quality Meat Scotland (Figure 71 and Table 48). 16.2% (116) of the respondents do not have an accredited plan at present but a small group of these respondents are currently awaiting approval to join Quality Meat Scotland.
Other animal health and welfare accredited plans used by the respondents included Pasture for Life, Demeter and Organic Association, Quality Assured Farm Venison, High Health Herdcare, Biobest, SAHPS: The Animal Health Planning System and Marks and Spencer’s Accredited Scheme via Scotbeef.
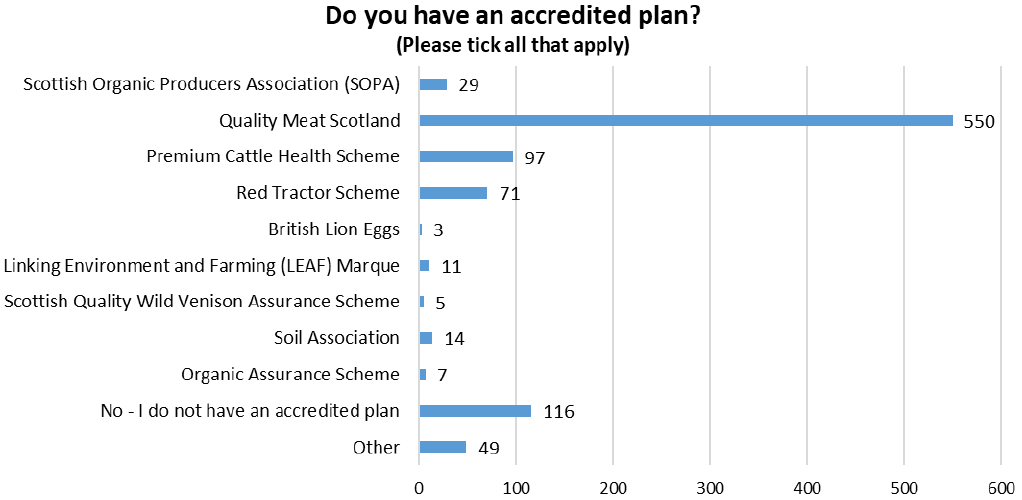
| Animal health and welfare plan accreditation | Total Respondents | Percentage (Denominator 716) |
|---|---|---|
| Scottish Organic Producers Association (SOPA) | 29 | 4.1% |
| Quality Meat Scotland | 550 | 76.8% |
| Premium Cattle Health Scheme | 97 | 13.5% |
| Red Tractor Scheme | 71 | 9.9% |
| British Lion Eggs | 3 | 0.4% |
| Linking Environment and Farming (LEAF) Marque | 11 | 1.5% |
| Scottish Quality Wild Venison Assurance Scheme | 5 | 0.7% |
| Soil Association | 14 | 2.0% |
| Organic Assurance Scheme | 7 | 1.0% |
| No - I do not have an accredited plan | 116 | 16.2% |
| Other | 49 | 6.8% |
2.10.3 Who created the animal health and welfare plan?
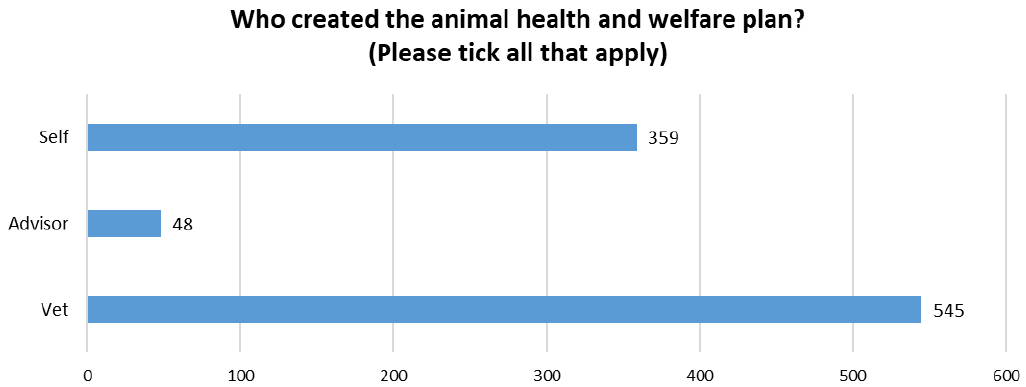
76.1% (545) of animal health and welfare plans (716) are created by the respondents vet (Figure 72 and Table 49). 20.7% (148) of the respondents create their animal health and welfare plan without the assistance of a vet or advisor.
| Who created the animal health & welfare plan | Total Respondents | Percentage (Denominator 716) |
|---|---|---|
| Self | 359 | 50.1% |
| Advisor | 48 | 6.7% |
| Vet | 545 | 76.1% |
2.10.4 Why businesses carry out an animal health and welfare plan
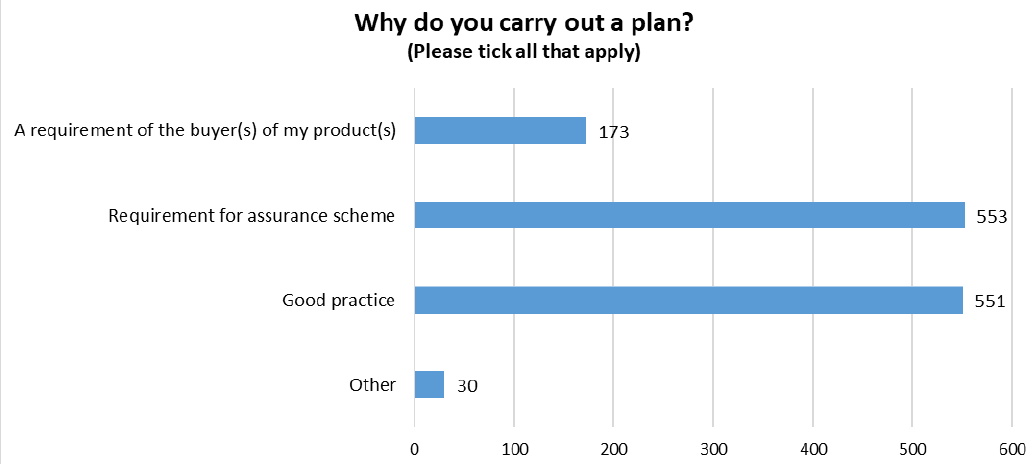
A large majority of the respondents (716) create an animal health and welfare plan because 77% (551) believe it to be good practice (Figure 73 and Table 50). Respondents have stated that the plan is very useful as it ensures that the health and welfare of the animals within the business are maintained or else improved throughout the year. 77.2% (553) of respondents also have noted that an animal health and welfare plan is required as part of their assurance schemes.
| Reasons for animal health and welfare plan | Total Respondents | Percentage (Denominator 716) |
|---|---|---|
| A requirement of the buyer(s) of my product(s) | 173 | 24.2% |
| Requirement for assurance scheme | 553 | 77.2% |
| Good practice | 551 | 77% |
| Other | 30 | 4.2% |
2.10.5 Reviews of animal health and welfare plan
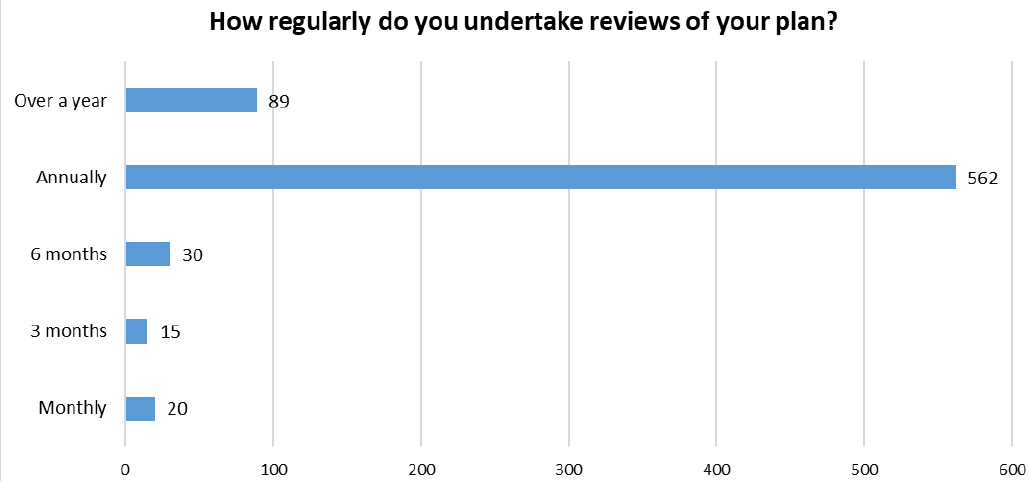
78.5% (562) of respondents review their animal health and welfare plans on a yearly basis (Figure 74 and Table 51).
| Animal health and welfare plan occurrence | Total Respondents | Percentage (Denominator 716) |
|---|---|---|
| Over a year | 89 | 12.4% |
| Annually | 562 | 78.5% |
| 6 months | 30 | 4.2% |
| 3 months | 15 | 2.1% |
| Monthly | 20 | 2.8% |
2.10.6 Actions businesses carry out due to an animal health and welfare plan
Due to having an animal health and welfare plan, 83.5% (598) of the respondents treat their livestock to control parasites. 74.3% (532) administer mineral and trace elements and 74.3% (532) also vaccinate for disease (Figure 75 and Table 52).
30.2% (216) of respondents have never benchmarked livestock performance. 28.2% (202) have never given their livestock treatments to reduce mastitis. 5.9% (42) do not know enough about benchmark livestock performance and 4.5% (32) do not know enough about health screening (Figure 75).
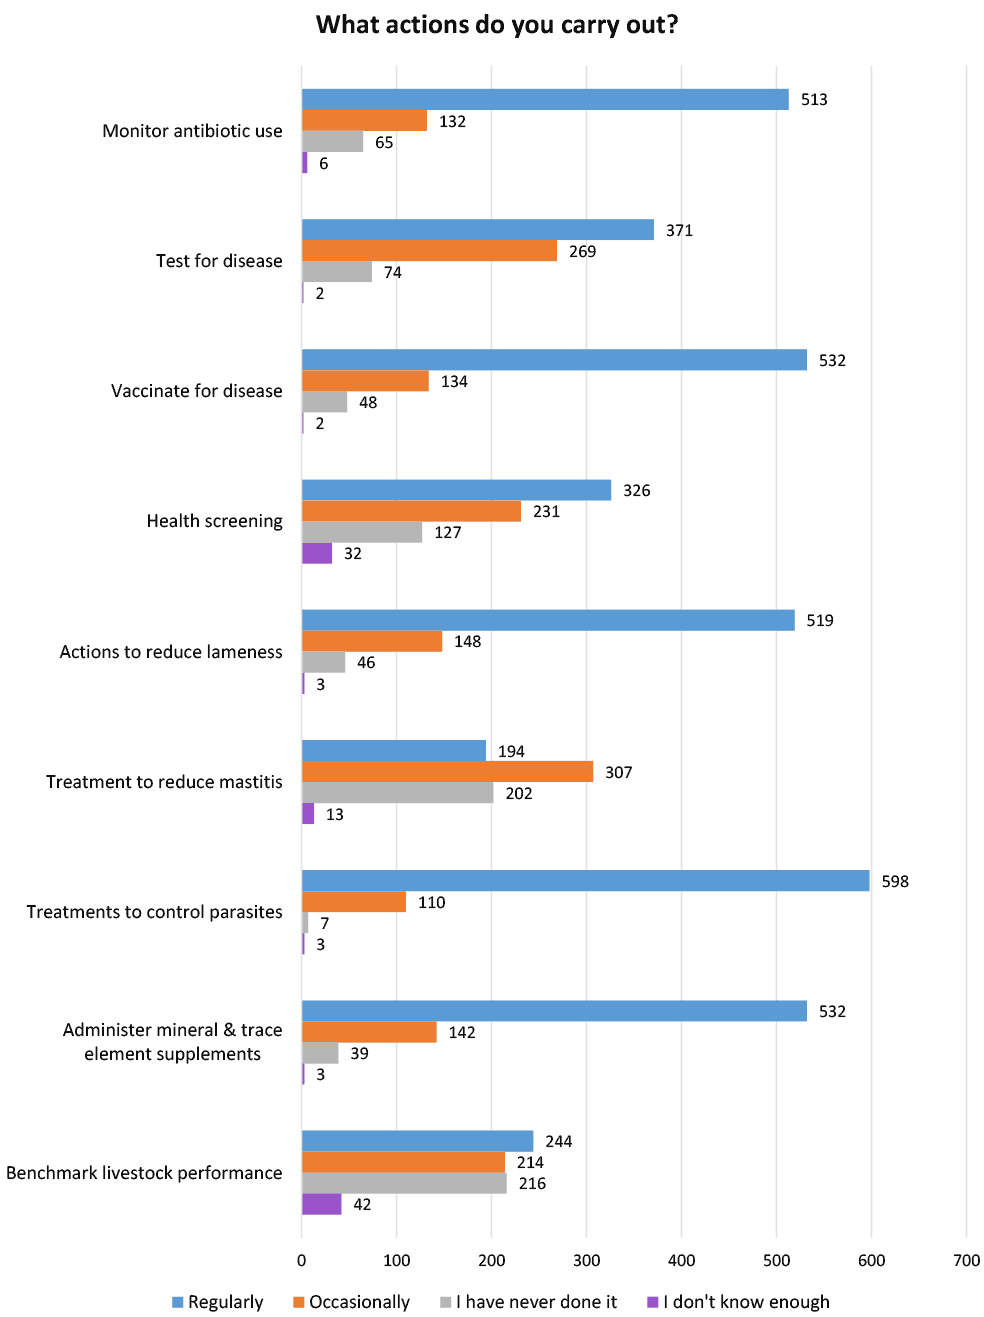
| Animal health and welfare plan practices (Denominator 716) | Regularly | Occasionally | I have never done it | I don't know enough |
|---|---|---|---|---|
| Monitor antibiotic use | 513 | 132 | 65 | 6 |
| 71.6% | 18.4% | 9.1% | 0.8% | |
| Test for disease | 371 | 269 | 74 | 2 |
| 51.8% | 37.6% | 10.3% | 0.3% | |
| Vaccinate for disease | 532 | 134 | 48 | 2 |
| 74.3% | 18.7% | 6.7% | 0.3% | |
| Health screening | 326 | 231 | 127 | 32 |
| 45.5% | 32.3% | 17.7% | 4.5% | |
| Actions to reduce lameness | 519 | 148 | 46 | 3 |
| 72.5% | 20.7% | 6.4% | 0.4% | |
| Treatment to reduce mastitis | 194 | 307 | 202 | 13 |
| 27.1% | 42.9% | 28.2% | 1.8% | |
| Treatments to control parasites | 598 | 110 | 7 | 3 |
| 83.5% | 15.4% | 1.0% | 0.4% | |
| Administer mineral & trace element supplements | 532 | 142 | 39 | 3 |
| 74.3% | 19.8% | 5.4% | 0.4% | |
| Benchmark livestock performance | 244 | 214 | 216 | 42 |
| 34.1% | 29.9% | 30.2% | 5.9% |
2.10.7 Why businesses do not have an animal health and welfare plan
45.2% (84) of respondents have not carried out an animal health and welfare plan (186) due to it not being required for their business. 31.2% (58) have not carried out a plan because they do not see the need for one (Figure 76 and Table 53). 9.1% (17) of respondents do state that although they do monitor the health and wellbeing of their livestock they do not have a formal plan.
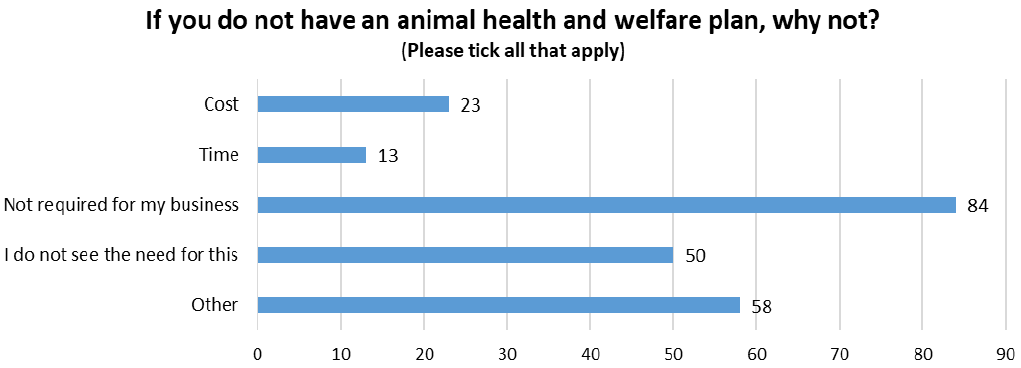
| Reason for not undertaking a animal health and welfare plan | Total Respondents | Percentage (Denominator 186) |
|---|---|---|
| Cost | 23 | 12.4% |
| Time | 13 | 7.0% |
| Not required for my business | 84 | 45.2% |
| I do not see the need for this | 50 | 26.9% |
| Other | 58 | 31.2% |
2.10.8 Actions businesses carry out due to having an animal health and welfare plan but have not documented
Although the respondents do not have a formal animal health and welfare plan, 52.7% (98) regularly preform treatments to control parasites, 49.5% (92) administer mineral & trace element supplements and 45.2% (84) undertake actions to reduce lameness (Figure 77 and Table 54).
60.8% (113) of respondents have never benchmarked livestock performance. 59.1% (110) have never given treatments to reduce mastitis and 55.9% (104) have never had a health screening for their livestock (Figure 77 and Table 52). 12.9% (24) of respondents and 10.2% (19) do not know enough about benchmarking livestock performance or health screening respectively (Figure 77 and Table 54).
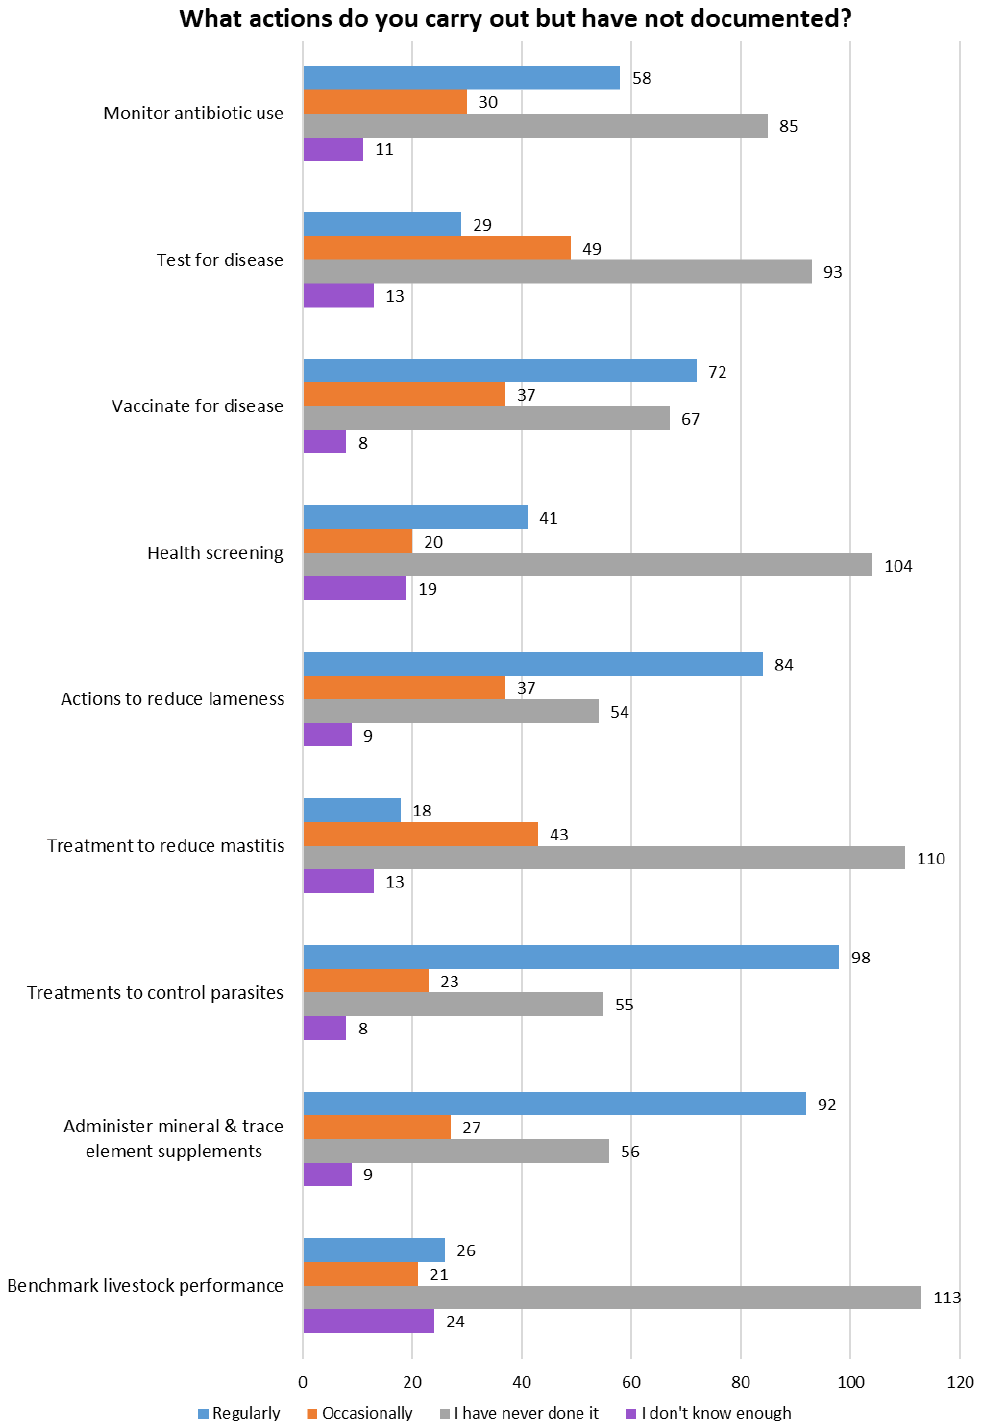
| Animal health and welfare plan practices - not documented (Denominator 186) | Regularly | Occasionally | I have never done it | I don't know enough |
|---|---|---|---|---|
| Monitor antibiotic use | 58 | 30 | 85 | 11 |
| 31.2% | 16.1% | 45.7% | 5.9% | |
| Test for disease | 29 | 49 | 93 | 13 |
| 15.6% | 26.3% | 50.0% | 7.0% | |
| Vaccinate for disease | 72 | 37 | 67 | 8 |
| 38.7% | 19.9% | 36.0% | 4.3% | |
| Health screening | 41 | 20 | 104 | 19 |
| 22.0% | 10.8% | 55.9% | 10.2% | |
| Actions to reduce lameness | 84 | 37 | 54 | 9 |
| 45.2% | 19.9% | 29.0% | 4.8% | |
| Treatment to reduce mastitis | 18 | 43 | 110 | 13 |
| 9.7% | 23.1% | 59.1% | 7.0% | |
| Treatments to control parasites | 98 | 23 | 55 | 8 |
| 52.7% | 12.4% | 29.6% | 4.3% | |
| Administer mineral & trace element supplements | 92 | 27 | 56 | 9 |
| 49.5% | 14.5% | 30.1% | 4.8% | |
| Benchmark livestock performance | 26 | 21 | 113 | 24 |
| 14.0% | 11.3% | 60.8% | 12.9% |
2.11 Breeding Plan
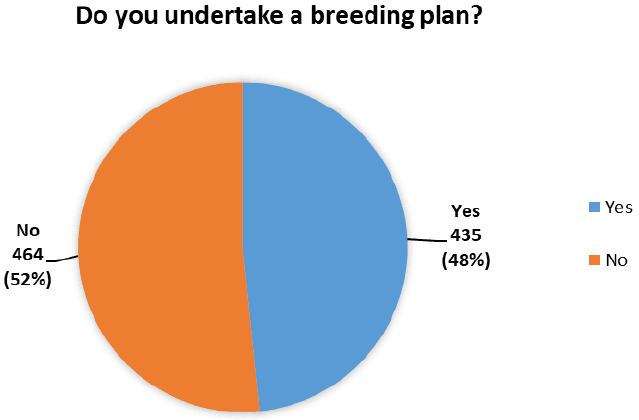
2.11.1 Businesses undertaking a breeding plan
Out of the 900 respondents who answered this section of the survey, 48.3% (435) have undertaken a breeding plan (Figure 78). Reasons as to why businesses have not undertaken a breeding plan can be found in section 2.11.5.
2.11.2 Who created the breeding plan and how often is it reviewed
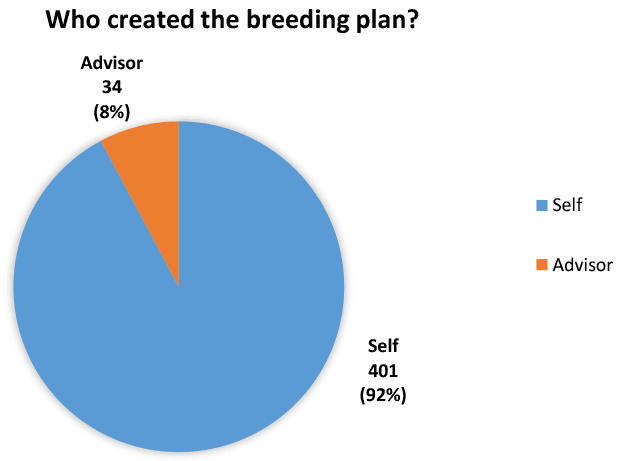
92.2% (401) of the respondents create their own breeding plan. 7.8% (34) get assistance from an advisor (Figure 79). 66.9% (291) of the respondents carry out reviews of their breeding plan each year (Figure 80 and Table 55).
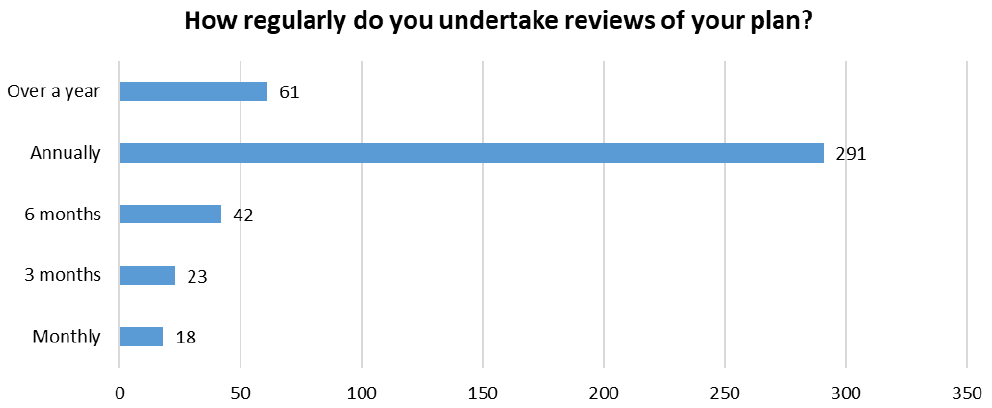
| Breeding plan occurrence | Total Respondents | Percentage (Denominator 435) |
|---|---|---|
| Over a year | 61 | 14.0% |
| Annually | 291 | 66.9% |
| 6 months | 42 | 9.7% |
| 3 months | 23 | 5.3% |
| Monthly | 18 | 4.1% |
2.11.3 Reasons businesses have created a breeding plan
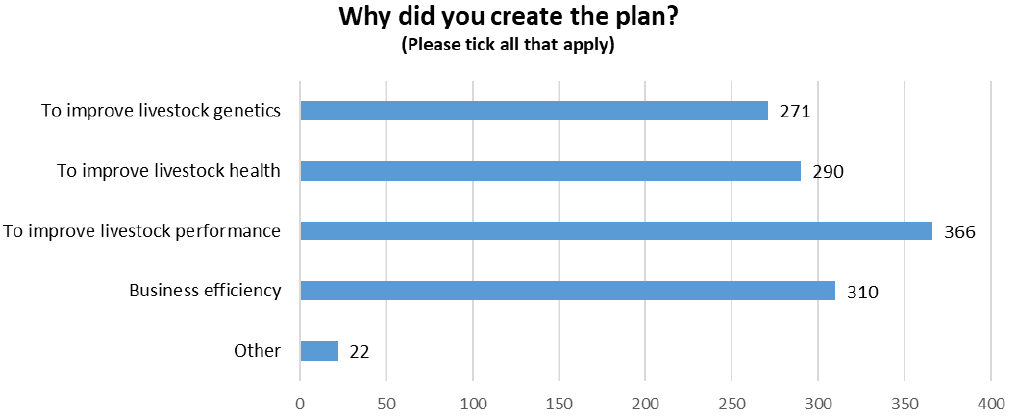
84.1% (366) of the respondents have created a breeding plan to improve livestock performance while 71.3% (310) state that a plan improves business efficiency (Figure 81 and Table 56). Respondents also noted have a breeding plan helped with safety and the ease of handling livestock along with improving food conversion and reducing the age to slaughter.
| Reason for breeding plan | Total Respondents | Percentage (Denominator 435) |
|---|---|---|
| To improve livestock genetics | 271 | 62.3% |
| To improve livestock health | 290 | 66.7% |
| To improve livestock performance | 366 | 84.1% |
| Business efficiency | 310 | 71.3% |
| Other | 22 | 5.1% |
2.11.4 Actions businesses carry out due to having a breeding plan
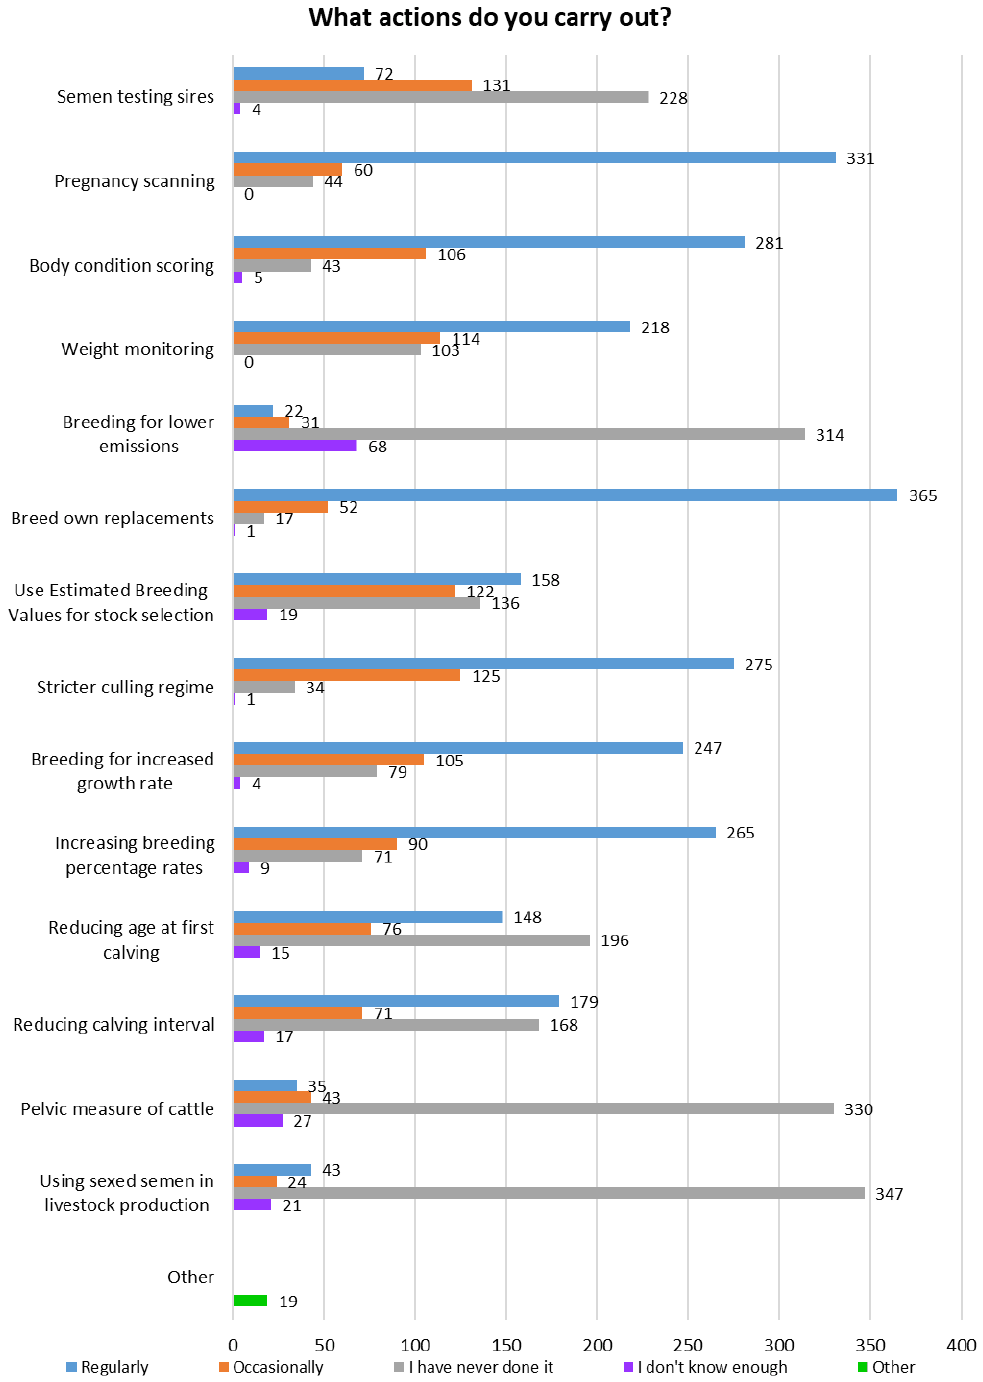
Due to having a breeding plan, 83.9% (365) of respondents regularly breed their own replacements. 76.1% (331) regularly have pregnancy scans conducted on their livestock and 64.6% (281) use body condition scoring (Figure 82 and Table 57).
79.8% (347) of the respondents have never used sexed semen in livestock production and 75.9% (330) have never taken the pelvic measure of their cattle. 15.6% (68) and 6.2% (27) of respondents do not know enough about breeding livestock for lower emissions or taking the pelvic measure of cattle respectively.
Respondents also noted the importance of choosing the suitability of cows going to which type of bull or breed of bull and therefore size, previous calving history, general health and maternal instincts should also be considered.
| Breeding plan practices - documented (Denominator 435) | Regularly | Occasionally | I have never done it | I don't know enough |
|---|---|---|---|---|
| Semen testing sires | 72 | 131 | 228 | 4 |
| 16.6% | 30.1% | 52.4% | 0.9% | |
| Pregnancy scanning | 331 | 60 | 44 | 0 |
| 76.1% | 13.8% | 10.1% | 0.0% | |
| Body condition scoring | 281 | 106 | 43 | 5 |
| 64.6% | 24.4% | 9.9% | 1.1% | |
| Weight monitoring | 218 | 114 | 103 | 0 |
| 50.1% | 26.2% | 23.7% | 0.0% | |
| Breeding for lower emissions | 22 | 31 | 314 | 68 |
| 5.1% | 7.1% | 72.2% | 15.6% | |
| Breed own replacements | 365 | 52 | 17 | 1 |
| 83.9% | 12.0% | 3.9% | 0.2% | |
| Use Estimated Breeding Values for stock selection | 158 | 122 | 136 | 19 |
| 36.3% | 28.0% | 31.3% | 4.4% | |
| Stricter culling regime | 275 | 125 | 34 | 1 |
| 63.2% | 28.7% | 7.8% | 0.2% | |
| Breeding for increased growth rate | 247 | 105 | 79 | 4 |
| 56.8% | 24.1% | 18.2% | 0.9% | |
| Increasing breeding percentage rates | 265 | 90 | 71 | 9 |
| 60.9% | 20.7% | 16.3% | 2.1% | |
| Reducing age at first calving | 148 | 76 | 196 | 15 |
| 34.0% | 17.5% | 45.1% | 3.4% | |
| Reducing calving interval | 179 | 71 | 168 | 17 |
| 41.1% | 16.3% | 38.6% | 3.9% | |
| Pelvic measure of cattle | 35 | 43 | 330 | 27 |
| 8.0% | 9.9% | 75.9% | 6.2% | |
| Using sexed semen in livestock production | 43 | 24 | 347 | 21 |
| 9.9% | 5.5% | 79.8% | 4.8% |
2.11.5 Why businesses do not have a breeding plan
Of the 464 respondents that do not have a breeding plan, 38.6% (179) of respondents carry out actions related to a breeding plan but have not documented the processes (Figure 83 and Table 58). 31.3% (145) respondents have noted that a breeding plan is not relevant to their business, this is normally due to the business not being large enough or the business not having livestock (Figure 83). Although 23.3% (108) of respondents note that they do not see the need to do a breeding plan and 1.1% (5) state that they never thought about doing a breeding plan.
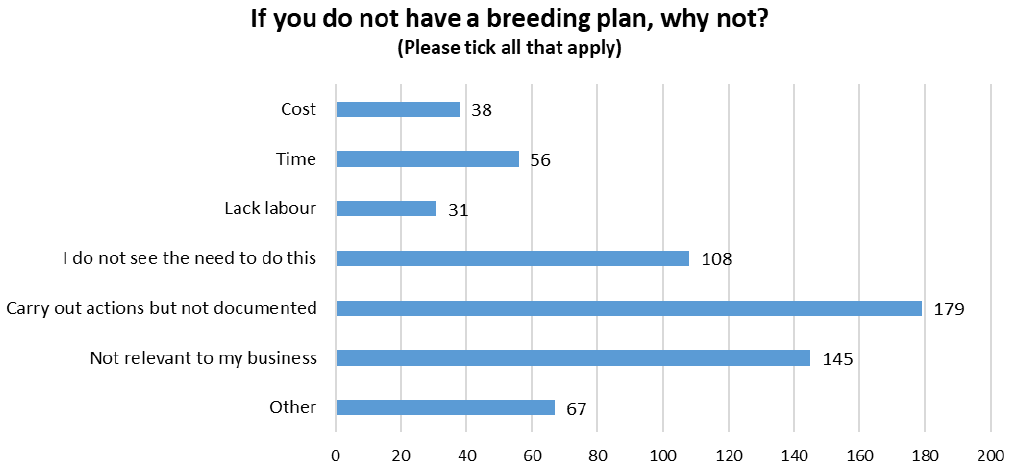
| Reason for not undertaking a breeding plan | Total Respondents | Percentage (Denominator 464) |
|---|---|---|
| Cost | 38 | 8.2% |
| Time | 56 | 12.1% |
| Lack labour | 31 | 6.7% |
| I do not see the need to do this | 108 | 23.3% |
| Carry out actions but not documented | 179 | 38.6% |
| Not relevant to my business | 145 | 31.3% |
| Other | 67 | 14.4% |
2.11.6 Actions businesses carry out but have not documented
Although the respondents do not have a formal breeding plan, 57.6% (268) regularly breed their own replacements and 44.3% (206) undertake pregnancy scanning of their livestock (Figure 84 and Table 59).
86.7% (403) of respondents have never used sexed semen in livestock production and 86% (400) have never taken the pelvic measure of their cattle. 81.7% (380) of respondents have never breed livestock for lower emissions. 12.9% (60) of respondents do not know enough about breeding livestock for lower emissions. While 8.4% (39) and 7.5% (35) do not know enough about Estimated Breeding Values for stock selection or taking pelvic measure of their cattle respectively (Figure 84).
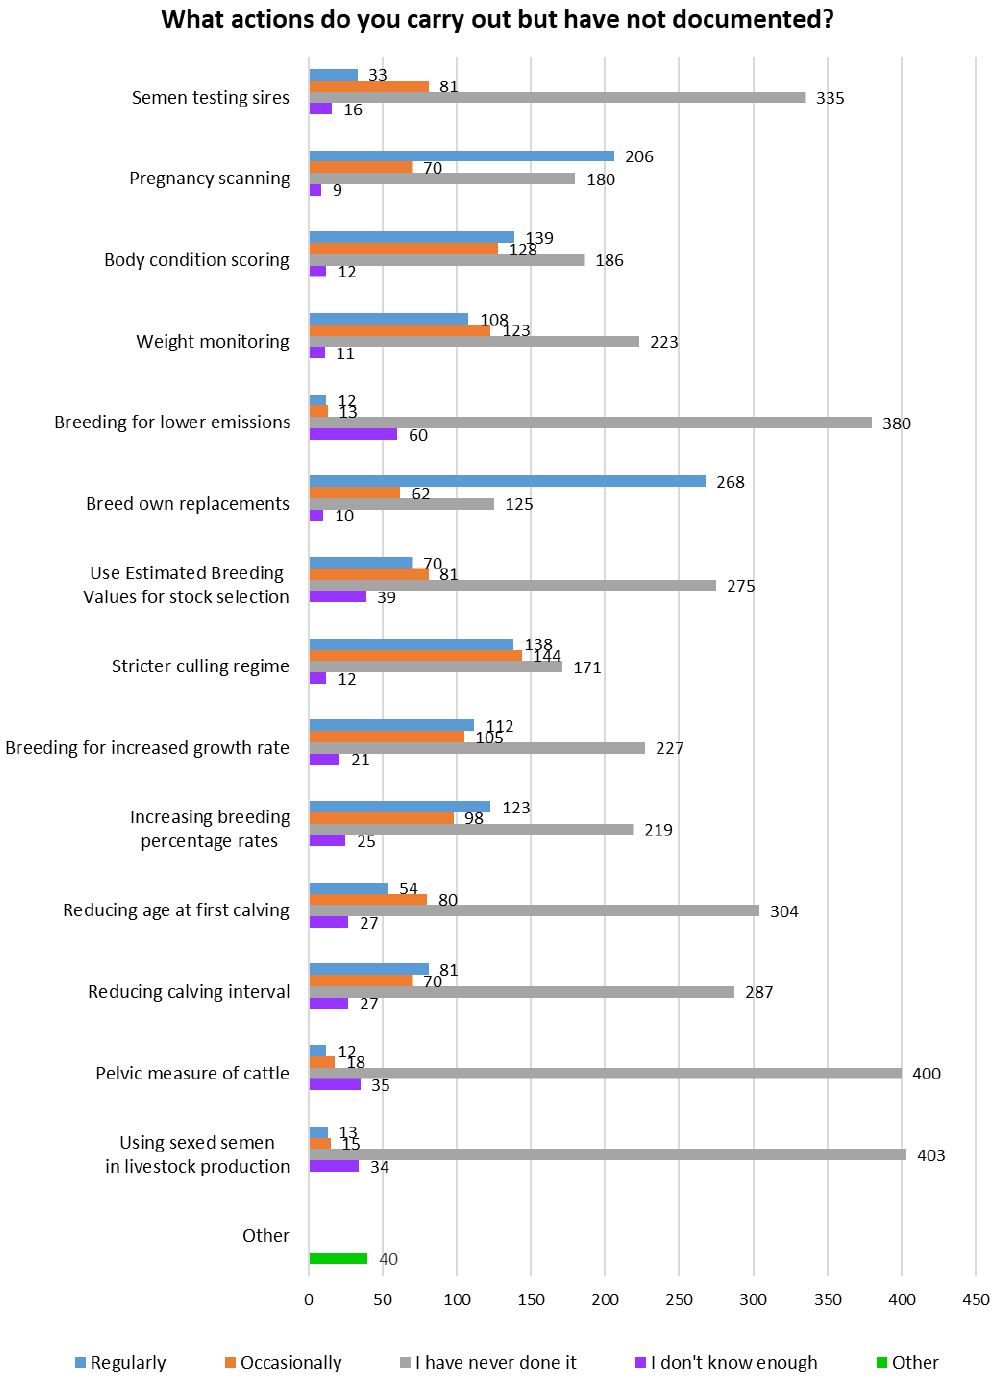
| Breeding plan practices - Not documented (Denominator 464) | Regularly | Occasionally | I have never done it | I don't know enough |
|---|---|---|---|---|
| Semen testing sires | 33 | 81 | 335 | 16 |
| 7.1% | 17.5% | 72.2% | 3.4% | |
| Pregnancy scanning | 206 | 70 | 180 | 9 |
| 44.4% | 15.1% | 38.8% | 1.9% | |
| Body condition scoring | 139 | 128 | 186 | 12 |
| 30.0% | 27.6% | 40.1% | 2.6% | |
| Weight monitoring | 108 | 123 | 223 | 11 |
| 23.3% | 26.5% | 48.1% | 2.4% | |
| Breeding for lower emissions | 12 | 13 | 380 | 60 |
| 2.6% | 2.8% | 81.9% | 12.9% | |
| Breed own replacements | 268 | 62 | 125 | 10 |
| 57.8% | 13.4% | 26.9% | 2.2% | |
| Use Estimated Breeding Values for stock selection | 70 | 81 | 275 | 39 |
| 15.1% | 17.5% | 59.3% | 8.4% | |
| Stricter culling regime | 138 | 144 | 171 | 12 |
| 29.7% | 31.0% | 36.9% | 2.6% | |
| Breeding for increased growth rate | 112 | 105 | 227 | 21 |
| 24.1% | 22.6% | 48.9% | 4.5% | |
| Increasing breeding percentage rates | 123 | 98 | 219 | 25 |
| 26.5% | 21.1% | 47.2% | 5.4% | |
| Reducing age at first calving | 54 | 80 | 304 | 27 |
| 11.6% | 17.2% | 65.5% | 5.8% | |
| Reducing calving interval | 81 | 70 | 287 | 27 |
| 17.5% | 15.1% | 61.9% | 5.8% | |
| Pelvic measure of cattle | 12 | 18 | 400 | 35 |
| 2.6% | 3.9% | 86.2% | 7.5% | |
| Using sexed semen in livestock production | 13 | 15 | 403 | 34 |
| 2.8% | 3.2% | 86.9% | 7.3% |
2.12 Biodiversity
2.12.1 Businesses undertaking a biodiversity audits
Out of the total number of respondents (977), 28.5% (278) have undertaken a biodiversity audit (Figure 85). Reasons as to why businesses have not undertaken a breeding plan can be found in section 2.12.3.
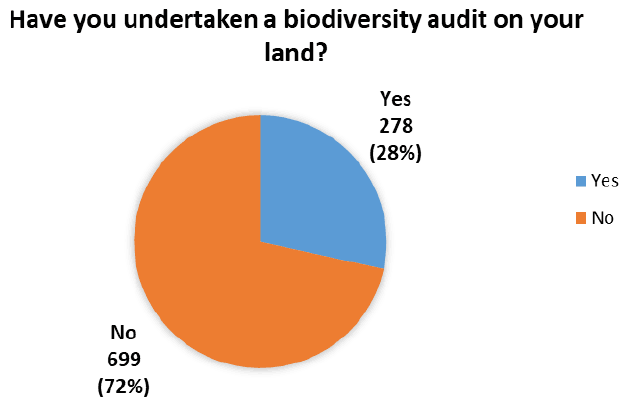
2.12.2 Reasons why businesses have undertaken a biodiversity audit
60.8% (169) of the respondents (278) who have undertaken a biodiversity audit state the reason for doing so was because it was a requirement for a Agri-environment scheme they were taking part in (Figure 86 and Table 60). 55.4% (154) have also noted that they undertook the audit to better assess and understand what biodiversity they have on their business.
In addition, respondents have also noted that they undertook the biodiversity audit out of their own personal interest. Others stated that they did the audit as it was a requirement of the Scottish Quality Crops assurance scheme and/or have land that are parts of Sites of Special Scientific Interest (SSSI) and are audited regularly.
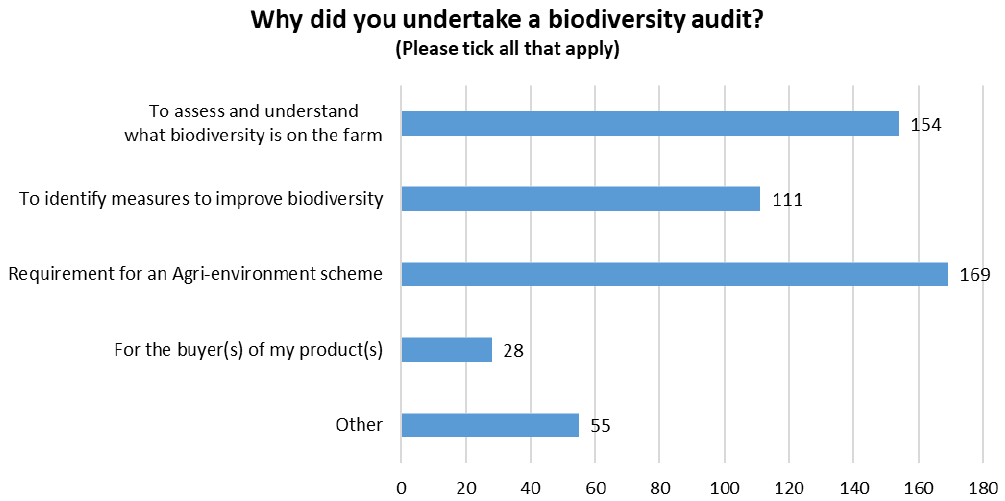
| Reason for biodiversity audit | Total Respondents | Percentage (Denominator 278) |
|---|---|---|
| To assess and understand what biodiversity is on the farm | 154 | 55.4% |
| To identify measures to improve biodiversity | 111 | 39.9% |
| Requirement for an Agri-environment scheme | 169 | 60.8% |
| For the buyer(s) of my product(s) | 28 | 10.1% |
| Other | 55 | 19.8% |
2.12.3 Why businesses have not carried out a biodiversity audit
The main reason 55.9% (391) of respondents have not undertaken a biodiversity audit is because they do not know what it involves, 46.1% (322) do not how to do one and 37.9% (265) do not know where to find help if they did wish to conduct an audit (Figure 87 and Table 61). Others have also stated that they had never heard of a biodiversity audit before taking the survey. Some respondents have noted that they do not have the time to conduct a biodiversity audit. Others have mentioned that they visually monitor and do try to encourage biodiversity but do not document their findings.
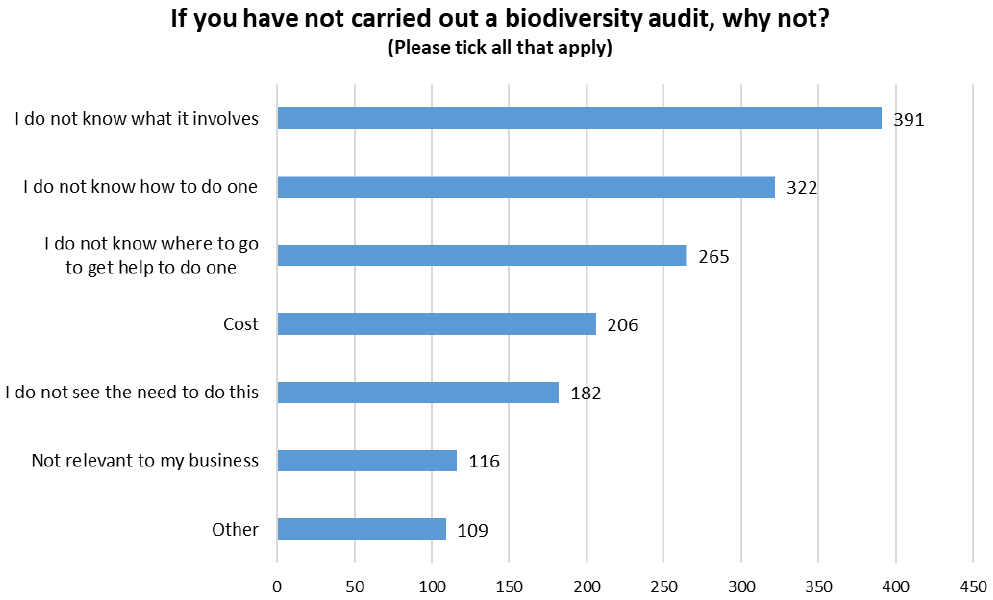
| Reasons for not undertaking biodiversity audit | Total Respondents | Percentage (Denominator 699) |
|---|---|---|
| I do not know what it involves | 391 | 55.9% |
| I do not know how to do one | 322 | 46.1% |
| I do not know where to go to get help to do one | 265 | 37.9% |
| Cost | 206 | 29.5% |
| I do not see the need to do this | 182 | 26.0% |
| Not relevant to my business | 116 | 16.6% |
| Other | 109 | 15.6% |
2.12.4 Reasons businesses would potentially undertake a biodiversity audit in the future
Although 79.4% (573) of respondents (722) have noted that financial assistance and 61.4% (443) of respondents have stated that training in how to undertake a basic biodiversity audit would encourage them to undertake a biodiversity audit (Figure 88 and Table 62). Many respondents commented that unless there was a good reason, a better understanding and a benefit to the business as to why a biodiversity audit should be taken they would continue to resist conducting an audit.
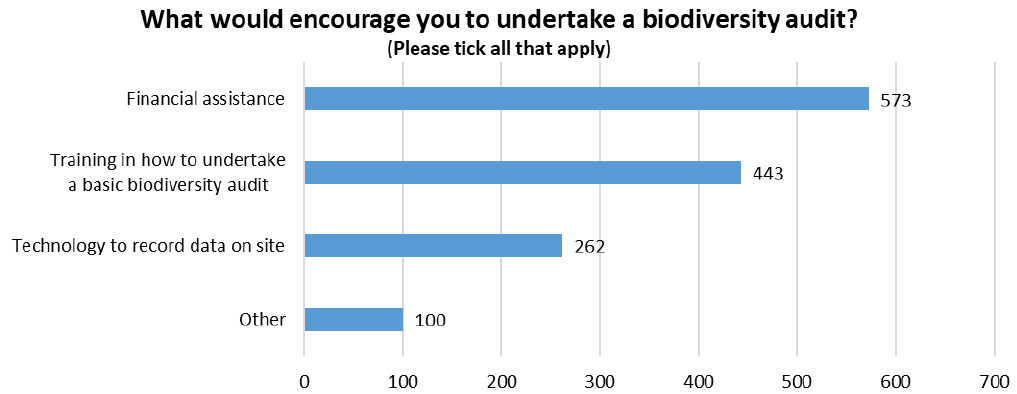
| Reasons for undertaking biodiversity audit in future | Total Respondents | Percentage (Denominator 722) |
|---|---|---|
| Financial assistance | 573 | 79.4% |
| Training in how to undertake a basic biodiversity audit | 443 | 61.4% |
| Technology to record data on site | 262 | 36.3% |
| Other | 100 | 13.9% |
2.12.5 Additional steps to support biodiversity and why undertake them
80% (782) of respondents are taking additional steps to support the creation, enhancement or preservation of suitable habitats on their land (Figure 89).
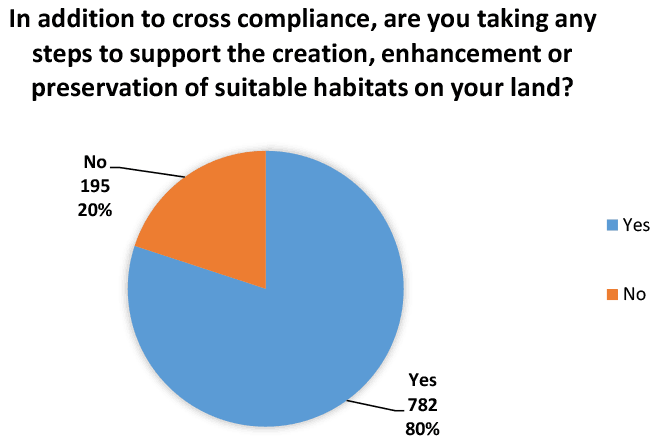
83.9% (656) of respondents have undertaken additional steps to support the creation, enhancement or preservation of suitable habitats on their land is because they wish to support biodiversity. 30.8% (241) have undertaken these additional tasks due to it being part of an Agri-environment scheme (Figure 90 and Table 63). The majority of the respondents stated that they had a responsibility to support their local biodiversity and they had a genuine interest in biodiversity and wish to improve it as best they could.
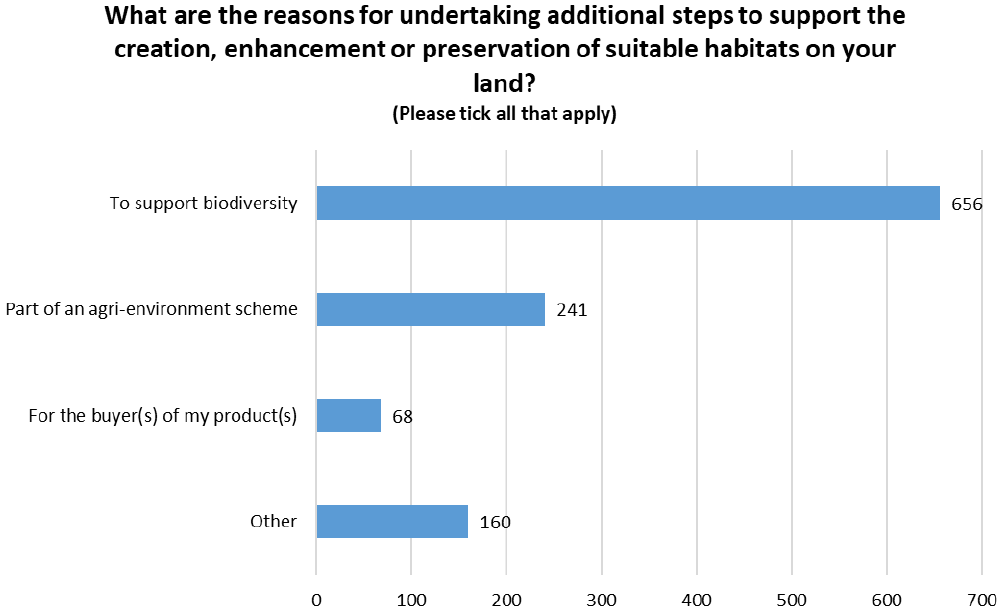
| Reasons for additional steps for biodiversity | Total Respondents | Percentage (Denominator 782) |
|---|---|---|
| To support biodiversity | 656 | 83.9% |
| Part of an agri-environment scheme | 241 | 30.8% |
| For the buyer(s) of my product(s) | 68 | 8.7% |
| Other | 160 | 20.5% |
2.12.6 Organic Certification
Only 5.9% (46) of the respondents are certified as organic (Figure 91).
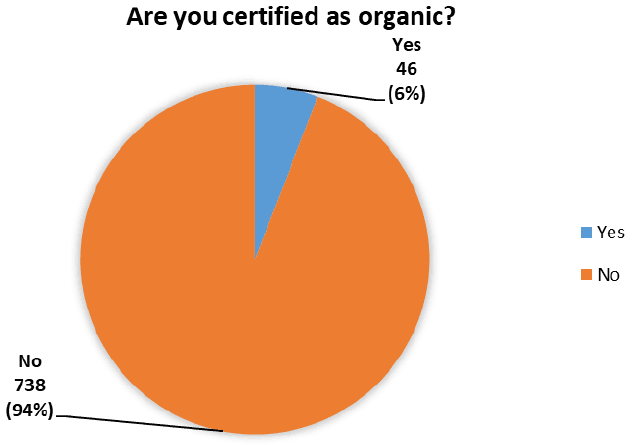
2.12.7 Encouraging biodiversity within farming businesses
Out of the 782 respondents who answered this question, 77.8% (608) of respondents maintain field and water habitat margins on a regular basis. 67% (524) identify and do not alter permanent natural habitats and 56.4% (441) consider wildlife needs when crop/grassland use planning (Figure 92 and Table 64).
57% (446) of respondents have never done training sessions or workshops on local biodiversity issues. While 7.2% (56) do not know enough about what training sessions or workshop are available. Peatland/wetland restoration and preservation does not apply to 63.4% (496) of the respondents as their businesses are not based within these particular types of land forms.
Respondents have also mentioned the use of bird and owl boxes, control of foxes and crows, maintenance of dry stone dykes, tick prevention measures, aerial bracken control and regular shepherding to ensure even grazing of rough pasture.
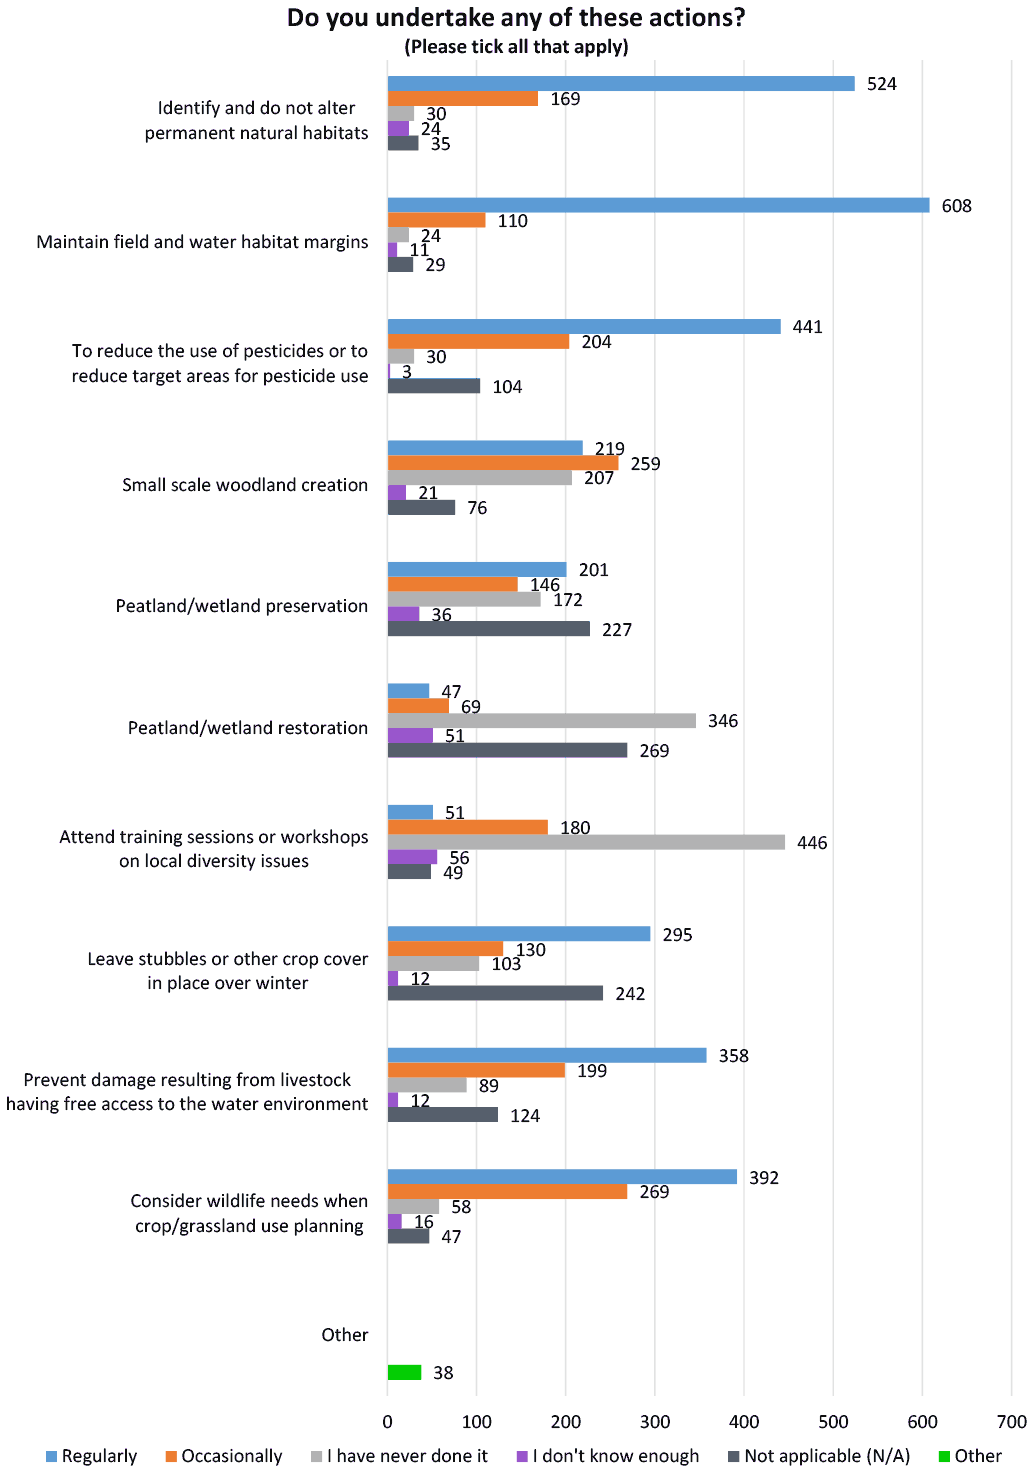
| Actions taken to aid biodiversity (Denominator 782) | Regularly | Occasionally | I have never done it | I don't know enough | Not applicable (N/A) |
|---|---|---|---|---|---|
| Identify and do not alter permanent natural habitats | 524 | 169 | 30 | 24 | 35 |
| 67.0% | 21.6% | 3.8% | 3.1% | 4.5% | |
| Maintain field and water habitat margins | 608 | 110 | 24 | 11 | 29 |
| 77.7% | 14.1% | 3.1% | 1.4% | 3.7% | |
| To reduce the use of pesticides or to reduce target areas for pesticide use | 441 | 204 | 30 | 3 | 104 |
| 56.4% | 26.1% | 3.8% | 0.4% | 13.3% | |
| Small scale woodland creation | 219 | 259 | 207 | 21 | 76 |
| 28.0% | 33.1% | 26.5% | 2.7% | 9.7% | |
| Peatland/wetland preservation | 201 | 146 | 172 | 36 | 227 |
| 25.7% | 18.7% | 22.0% | 4.6% | 29.0% | |
| Peatland/wetland restoration | 47 | 69 | 346 | 51 | 269 |
| 6.0% | 8.8% | 44.2% | 6.5% | 34.4% | |
| Attend training sessions or workshops on local diversity issues | 51 | 180 | 446 | 56 | 49 |
| 6.5% | 23.0% | 57.0% | 7.2% | 6.3% | |
| Leave stubbles or other crop cover in place over winter | 295 | 130 | 103 | 12 | 242 |
| 37.7% | 16.6% | 13.2% | 1.5% | 30.9% | |
| Prevent damage resulting from livestock having free access to the water environment | 358 | 199 | 89 | 12 | 124 |
| 45.8% | 25.4% | 11.4% | 1.5% | 15.9% | |
| Consider wildlife needs when crop/grassland use planning | 392 | 269 | 58 | 16 | 47 |
| 50.1% | 34.4% | 7.4% | 2.0% | 6.0% |
2.12.8 Businesses not carrying out additional steps for biodiversity and why?
The main reason respondents (195) have not carried out additional steps to support the creation, enhancement or preservation of suitable habitats on their land is because 52.3% (102) feel that there is not enough information about the topic (Figure 93 and Table 65). 28.2% (55) of respondents have also stated that they are concerned that the measures are too costly. 27.7% (54) feel that the measures may impact production on the holding and 24.6% (48) feel it will have a detrimental impact on the business with the time taken to undertake these measures being a main concern. Others noted they were happy with the biodiversity currently on their land and they saw no need for further modifications to their business as it could upset the already established biodiversity balance which changes itself according to nature, weather and the availability of food and shelter.
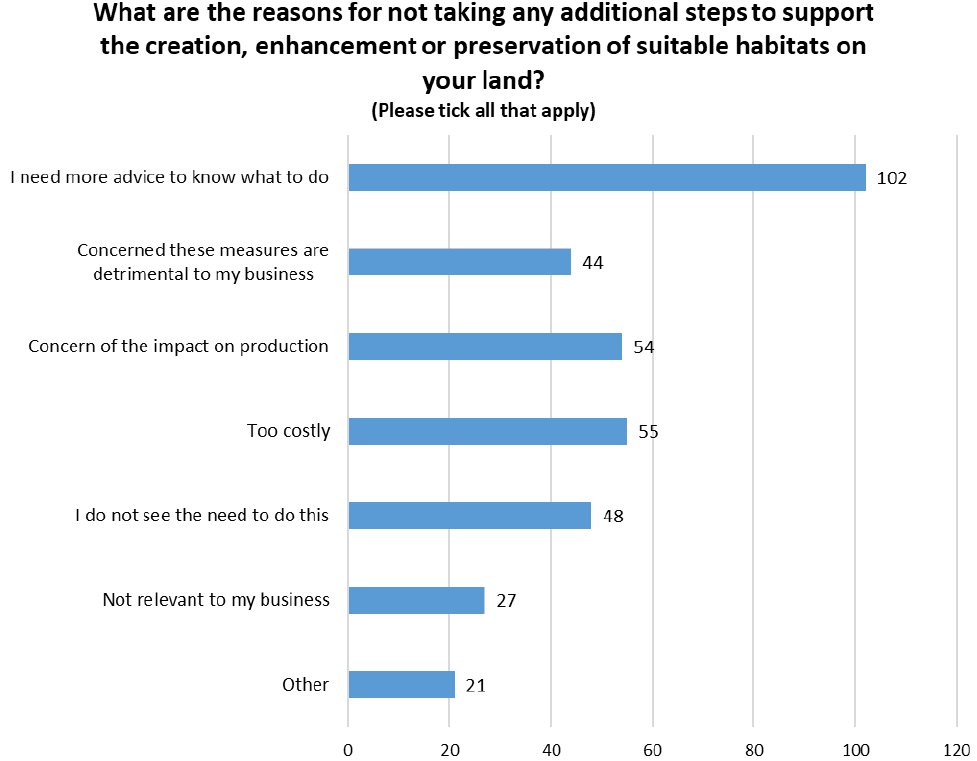
| Reasons for not undertaking additional steps for biodiversity | Total Respondents | Percentage (Denominator 195) |
|---|---|---|
| I need more advice to know what to do | 102 | 52.3% |
| Concerned these measures are detrimental to my business | 44 | 22.6% |
| Concern of the impact on production | 54 | 27.7% |
| Too costly | 55 | 28.2% |
| I do not see the need to do this | 48 | 24.6% |
| Not relevant to my business | 27 | 13.8% |
| Other | 21 | 10.8% |
2.12.9 Why businesses potential would undertake additional steps for biodiversity
Of the 195 respondents who have not carried out additional steps to support the creation, enhancement or preservation of suitable habitats on their land, 83.6% (163) stated that financial assistance would encourage them while 65.1% (127) noted the need for free or low cost advice (Figure 94 and Table 66). Respondents also noted that if there were no competitive schemes, that the schemes were equally accessible they would be encouraged to practice more methods to support the creation, enhancement or preservation of suitable habitats on their land. Another respondent noted that if there was evidence that measures could help their business, they would also be encouraged to further enhance the biodiversity within their business.
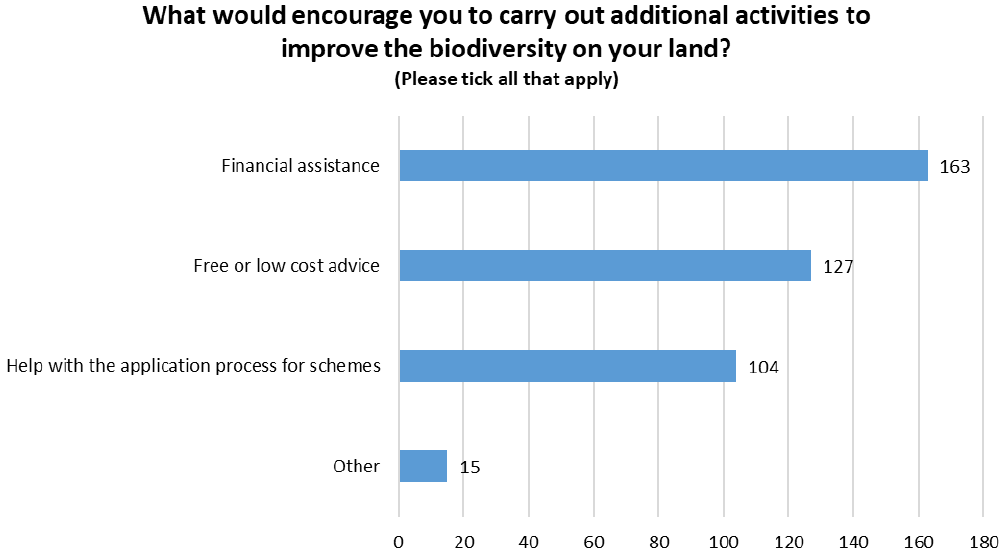
| Reasons for undertaking additional biodiversity activities in future | Total Respondents | Percentage (Denominator 195) |
|---|---|---|
| Financial assistance | 163 | 83.6% |
| Free or low cost advice | 127 | 65.1% |
| Help with the application process for schemes | 104 | 53.3% |
| Other | 15 | 7.7% |
2.13 Communication Channels
60.3% (589) of the respondents when looking for information on new agricultural practices would review Farming press articles. 60.1% (587) would have ad-hoc discussions with other farmers/crofters/land managers (Figure 95 and Table 67).
50.4% (492) of respondents went to official government websites for advice (Figure 95). Respondents did note that they sometimes found these sites difficult to work through and perceived the language used as ‘legal talk’ rather than ‘plain talk’. Websites that respondents found useful included the Farming Forum, Game and Wildlife Conservation Trust (GWCT), SAC, Farming Advice Service (FAS), Bee Base, NatureScot, RSPB, Wildlife Trust Scotland, Woodland Trust, Bird Track, Working for Waders, Scottish Bee Keepers Association.
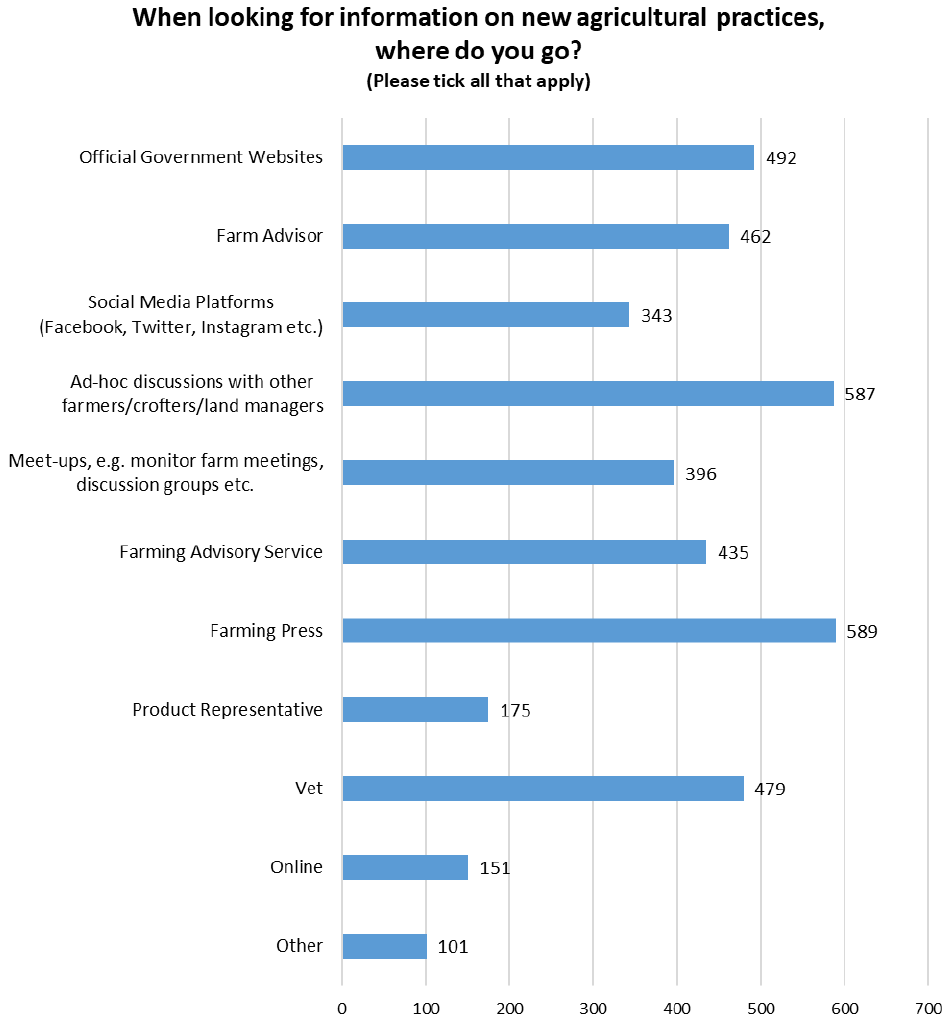
| Communication channels | Total Respondents | Percentage (Denominator 977) |
|---|---|---|
| Official Government Websites | 492 | 50.4% |
| Farm Advisor | 462 | 47.3% |
| Social Media Platforms (Facebook, Twitter, Instagram etc.) | 343 | 35.1% |
| Ad-hoc discussions with other farmers/crofters/land managers | 587 | 60.1% |
| Meet-ups, e.g. monitor farm meetings, discussion groups etc. | 396 | 40.5% |
| Farming Advisory Service | 435 | 44.5% |
| Farming Press | 589 | 60.3% |
| Product Representative | 175 | 17.9% |
| Vet | 479 | 49.0% |
| Online | 151 | 15.5% |
| Other | 101 | 10.3% |
Contact
Email: TSF_Mailbox@gov.scot