National Test Programme - testing actions for sustainable farming phase one: survey report
Testing actions for sustainable farming phase 1 survey was to understand the current state of the uptake of sustainable farming practices and motivations/barriers for farmers and crofters to inform phase 2 of the National Test Programme.
1. General Overview
1.1 Introduction
The Testing Actions for Sustainable Farming Phase 1 (TSF-P1) main objective is to understand the current state of uptake of sustainable farming practices and motivations/barriers for farmers and crofters to inform Phase 2 (TSF-P2) of the National Test Programme. Phase 1 comprised of a survey using a representative sample of farmers and crofters from across Scotland.
The participants were recruited in two main phases, random selection using a stratification methodology inviting them to contribute and volunteers who were aligned to the same criteria.
There were two types of volunteer: ‘warm volunteers’ who are previous survey participants who indicated they are happy to partake in other surveys, and ‘re-active volunteers’ who learn about the programme from publicity in social and media channels and expressed an interest in contributing.
1.2 Recruitment
To gather the information required to aid with understanding the current state and motivations/barriers for farmers and crofters, the survey was conducted in two tranches. Each tranche was open for 3 weeks with a week between tranches to allow for analysis and evaluation of respondents. To comply with General Data Protection Regulations (GDPR) those participants invited to partake in the survey were first sent an invite to ascertain if they consent to partaking in the survey and to where their email address and answers will be stored by the survey provider until the survey is complete.
In order to obtain a representative sample of farmers and crofters from across Scotland the Rural and Environment Science and Analytical Services Division (RESAS) were employed to create a stratification[1] methodology to ensure representation of the agricultural sector which was then put through a random selection process to reduce potential systematic or unintended biases.
The stratification was based on the methods used to collect data from the June 2021 Agricultural Census, where the following typologies were utilised to stratify the invited participants to ensure representation across:
- Because crofts are self-contained in the Highland and Islands Region, they will be treated as a separate stratum
- Farm Businesses by Standard Labour Requirements (SLR) categorised as:
- Less than 1;
- Between 1 and less than 2;
- Between 2 and less than 3;
- Between 3 and less than 5;
- More than 5
- Farm main type (as identified by June 2021 Agricultural Census). It should be noted that the term ‘specialist’ when describing an enterprise means a farm where more than two thirds of the livestock is specialised in one type of livestock, for e.g. cows or sheep
- Nomenclature of Territorial Units for Statistics Level 2 (NUTS2) – created by the European Union based on population statistics
- Farm ownership by tenure type
- Island Farm Businesses
The findings were quality assured for representation of the categories and to avoid targeting small groups which could risk poor initial take-up.
Farm holdings identified in each stratification were then randomly chosen using holding numbers and common statistical techniques to avoid unintended biases in further analysis.
Tranche 1 of the survey was made up of the participants from the groupings below. The initial email inviting the participants to express an interest in doing the survey was sent on 30th June 2022. The survey was sent to those participants willing to partake on 7th July 2022. Tranche 1 of the survey concluded on 27th July 2022:
- RESAS identified 3000 potential participants using the stratification methodology (outlined above) to ensure a representation of the agricultural sector.
- Warm volunteers, 881 previous survey participants who indicated they are happy to partake in other surveys. The same methodology used for the RESAS list was used for the warm volunteers list to ensure they fulfilled the representative sample criteria. The list was also assessed to ensure that there was no bias and followed the principles of a representative sample.
Tranche 2 of the survey was made up of the participants from the groupings below and looked to identify farming enterprises not fully represented during the responses captured as part of tranche 1. The initial email inviting the participants to express an interest in doing the survey was sent on 1st August 2022. The survey was sent to those participants willing to partake and volunteers within 1 working day of receiving their consent. Tranche 2 survey also ran for 3 weeks and concluded on 28th August 2022:
- Reactive volunteers who are not part of the first two groups, who learn about the programme from publicity in social and media channels and express an interest in participating. Farmers and Crofters could volunteer to participate from 7th July 2022.
- Additional invited participants categorised using the methodology employed by RESAS to top up shortfalls in areas not fully represented by the responses received in tranche 1 and by the re-active volunteers. The number of those invited will also be calculated using the response rate identified during Tranche 1.
1.3 Survey Analysis – Overview
A total of 5275 invitations were sent out across both Tranche 1 and Tranche 2, with a total of 1653 respondents reacting to the initial invitation requesting a link to the survey (Table 1), giving a response rate of 31.3%.
To calculate the actual representative sample the Testing Actions for Sustainable Farming Operational Delivery Team analysed the list of 3000 potential participants provided by RESAS to ascertain the count of participants within each NUTS2 Region, Standard Labour Requirement (SLR) and Farm Main Type. The team then divided these figures into two (50%) and used the results as the target number of respondents. The reason for using 50% was due to the initial aim being 1500 participants which is half of the RESAS 3000 list. An aim to target 1500 participants was identified to gain a representative sample when considering budgetary and timing constraints placed on the project.
709 participants completed the survey in Tranche 1 and in Tranche 2 an additional 268 participants completed the survey (Table 1), including reactive volunteers making a total of 977 completed surveys. The completion rate for the survey is 59.1% (977/1653).
| Tranche 1 | Tranche 2 | |||||
|---|---|---|---|---|---|---|
| Survey Invitation Graph | Total | RESAS | Warm Volunteers | Crofts | Farms | Reactive Volunteers |
| Invited participants | 5275 | 2626[2] | 834[3] | 199 | 1616 | 0 |
| Agreed to participate | 1653 | 6692 | 5313 | 62[4] | 371[5] | 20[6] |
| Total Completed Survey | 977 | 3812 | 3283 | 384 | 2155 | 156 |
| Incorrect Email Address (Bounced) | 147 | 92 | 14 | 10 | 31 | 0 |
| Insufficient Details to Send | 548 | 374 | 53 | 52 | 69 | 0 |
| Did not respond to invite | 3634 | 1865 | 289 | 154 | 1326 | 0 |
| Reactive Volunteers | 106 | 0 | 0 | 134 | 735 | 206 |
Reactive Volunteers highlighted in the Crofts and Farms column in Tranche 2 of Table 1 show volunteers who have previously completed the June 2021 Agricultural Census. An additional 20 Reactive Volunteers did not partake in the June 2021 Agricultural Census and further information had to be obtained outside the remit of this survey to ensure the survey findings could be completed.
As part of the Tranche 1, a total of 1200 surveys were sent to potential participants from the RESAS and Warm Volunteer List who had previously agreed to take part in the Tranche 1 survey. 833 responses were received with 709 of these being surveys that had been fully completed, 124 surveys were only partially completed the survey and 4 respondents did not consent with the privacy notice and therefore did not answer any of the survey questions. A completion rate of 59.1% was received for Tranche 1 therefore a further 1815 potential participants were invited to participate in Tranche 2.
A further 268 participants fully completed the survey as part of Tranche 2. 26 surveys were only partially completed and 1 respondent did not consent with the privacy notice and therefore did not answer any of the survey questions. The completion rate for Tranche 2 was 57.8% giving an overall response rate for invited participants as 59.1% (Figure 1).
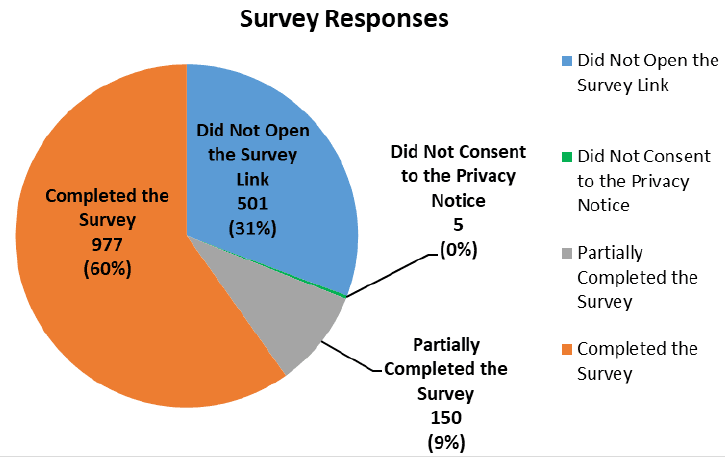
Table 2 outlines the survey targets for each business type and number of completed responses for each the NUTS2 region. Table 3 outlines the survey targets for each SLR banding and number of completed responses for each the NUTS2 region.
| Business Type | Target Total (Farm/Croft) | Response Total (Farm/Croft) | Eastern Scotland Target (Farm/Croft) | Eastern Scotland Responses (Farm/Croft) | Highlands & Islands Target (Farm/Croft) | Highlands & Islands Responses (Farm/Croft) | North East Scotland Target (Farm/Croft) | North East Scotland Responses (Farm/Croft) | South Scotland Target (Farm/Croft) | South Scotland Responses (Farm/Croft) | West Central Scotland Target (Farm/Croft) | West Central Scotland Responses (Farm/Croft) |
|---|---|---|---|---|---|---|---|---|---|---|---|---|
| Cereal | 83 | 51 | 32 | 26 | 8 | 4 | 28 | 11 | 14 | 9 | 1 | 1 |
| (82/1) | (51/0) | (32/0) | (26/0) | (7/1) | (4/0) | (28/0) | (11/0) | (14/0) | (9/0) | (1/0) | (1/0) | |
| Dairy | 122 | 43 | 12 | 3 | 9 | 7 | 2 | 0 | 93 | 30 | 6 | 3 |
| (122/0) | (40/3) | (12/0) | (3/0) | (9/0) | (4/3) | (2/0) | (0/0) | (93/0) | (30/0) | (6/0) | (3/0) | |
| General Cropping | 154 | 81 | 97 | 49 | 15 | 10 | 26 | 13 | 15 | 8 | 1 | 1 |
| (153/1) | (80/1) | (97/0) | (49/0) | (14/1) | (9/1) | (26/0) | (13/0) | (15/0) | (8/0) | (1/0) | (1/0) | |
| General Cropping- Forage | 15 | 39 | 0 | 4 | 15 | 15 | 0 | 7 | 0 | 13 | 0 | 0 |
| (0/15) | (32/7) | (0/0) | (4/0) | (0/15) | (8/7) | (0/0) | (7/0) | (0/0) | (13/0) | (0/0) | (0/0) | |
| Lowland Cattle & Sheep | 106 | 58 | 26 | 17 | 5 | 8 | 40 | 15 | 34 | 18 | 1 | 0 |
| (104/2) | (56/2) | (26/0) | (17/0) | (3/2) | (6/2) | (40/0) | (15/0) | (34/0) | (18/0) | (1/0) | (0/0) | |
| Mixed | 181 | 115 | 56 | 36 | 31 | 27 | 58 | 33 | 35 | 19 | 1 | 0 |
| (178/3) | (109/6) | (56/0) | (36/0) | (28/3) | (21/6) | (58/0) | (33/0) | (35/0) | (19/0) | (1/0) | (0/0) | |
| Other Cattle & Sheep (LFA) | 167 | 95 | 29 | 17 | 52 | 38 | 9 | 4 | 74 | 34 | 3 | 2 |
| (154/13) | (81/14) | (29/0) | (17/0) | (38/13) | (24/14) | (9/0) | (4/0) | (74/0) | (34/0) | (3/0) | (2/0) | |
| Specialist Cattle (LFA) | 403 | 255 | 29 | 18 | 128 | 109 | 48 | 24 | 179 | 96 | 19 | 8 |
| (372/31) | (210/45) | (29/0) | (18/0) | (97/31) | (64/45) | (48/0) | (24/0) | (179/0) | (96/0) | (19/0) | (8/0) | |
| Specialist horticulture & permanent crops | 1 | 8 | 0 | 3 | 1 | 4 | 0 | 1 | 0 | 0 | 0 | 0 |
| (0/1) | (5/3) | (0/0) | (3/0) | (0/1) | (1/3) | (0/0) | (1/0) | (0/0) | (0/0) | (0/0) | (0/0) | |
| Specialist Pigs | 0 | 3 | 0 | 0 | 0 | 0 | 0 | 1 | 0 | 2 | 0 | 0 |
| (0/0) | (3/0) | (0/0) | (0/0) | (0/0) | (0/0) | (0/0) | (1/0) | (0/0) | (2/0) | (0/0) | (0/0) | |
| Specialist Poultry | 0 | 2 | 0 | 0 | 0 | 1 | 0 | 0 | 0 | 1 | 0 | 0 |
| (0/0) | (2/0) | (0/0) | (0/0) | (0/0) | (1/0) | (0/0) | (0/0) | (0/0) | (1/0) | (0/0) | (0/0) | |
| Specialist Sheep (LFA) | 268 | 210 | 36 | 20 | 146 | 126 | 10 | 10 | 68 | 50 | 8 | 4 |
| (185/83) | (134/76) | (35/1) | (20/0) | (64/82) | (51/75) | (10/0) | (10/0) | (68/0) | (50/0) | (8/0) | (3/1) | |
| Unknown Business Type | 0 | 17 | 0 | 0 | 0 | 10 | 0 | 3 | 0 | 3 | 0 | 0 |
| (0/0) | (6/0) | (0/0) | (0/0) | (0/0) | (0/0) | (0/0) | (3/0) | (0/0) | (3/0) | (0/0) | (0/0) | |
| Total | 1500 | 977[7] | 317 | 193 | 410 | 359 | 221 | 122 | 512 | 283 | 40 | 19 |
| (1350/150) | (809/157)7/8 | (316/1) | (193/0) | (261/149) | (193/156)[8] | (221/0) | (122/0) | (512/0) | (283/0) | (40/0) | (18/1) |
| SLR Band | Target Total | Response Total | Eastern Scotland Target | Eastern Scotland Responses | Highlands & Islands Target | Highlands & Islands Responses | North East Scotland Target | North East Scotland Responses | South Scotland Target | South Scotland Responses | West Central Scotland Target | West Central Scotland Responses |
|---|---|---|---|---|---|---|---|---|---|---|---|---|
| 0 - <0.25 FTE (Extremely Small) | 86 | 176 | 0 | 11 | 86 | 107 | 0 | 19 | 0 | 36 | 0 | 1 |
| 0.25 - <1 FTE (Very Small) | 191 | 156 | 32 | 21 | 81 | 73 | 34 | 29 | 39 | 26 | 5 | 6 |
| 1 - <2 FTE (Small) | 164 | 131 | 30 | 31 | 50 | 51 | 32 | 12 | 46 | 33 | 6 | 3 |
| 2 - <3 FTE (Medium) | 152 | 99 | 29 | 19 | 39 | 31 | 33 | 16 | 47 | 29 | 4 | 4 |
| 3 - <5 FTE (Large) | 303 | 156 | 67 | 38 | 63 | 41 | 48 | 17 | 114 | 58 | 11 | 1 |
| 5 or more FTE (Very Large) | 604 | 251 | 159 | 73 | 91 | 48 | 74 | 26 | 266 | 100 | 14 | 4 |
| Unknown SLR | 0 | 8 | 0 | 0 | 0 | 8 | 0 | 3 | 0 | 1 | 0 | 0 |
| Total | 1500 | 977[9] | 317 | 193 | 410 | 359 | 221 | 122 | 512 | 283 | 40 | 19 |
Figure 2 presents the NUTS2 Regions.
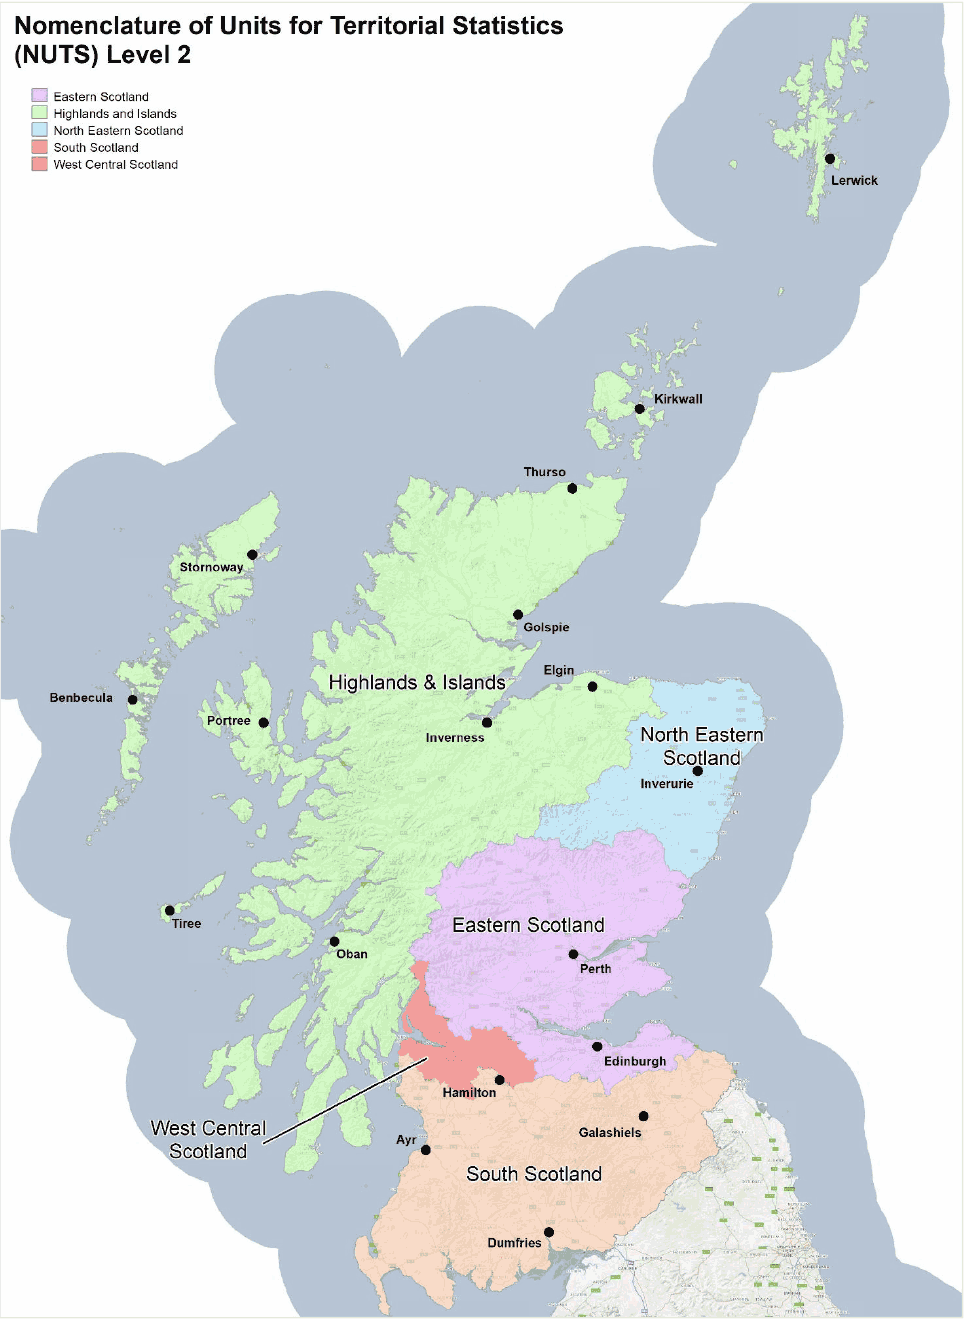
Figure 3 and Table 4 detail the number of invited participants against respondents per main business type. It is evident from the table below that the respondents follow the trend of those that were identified as part of the stratification methodology thus giving a representative sample of the Scottish agriculture sector by business type at a country level.
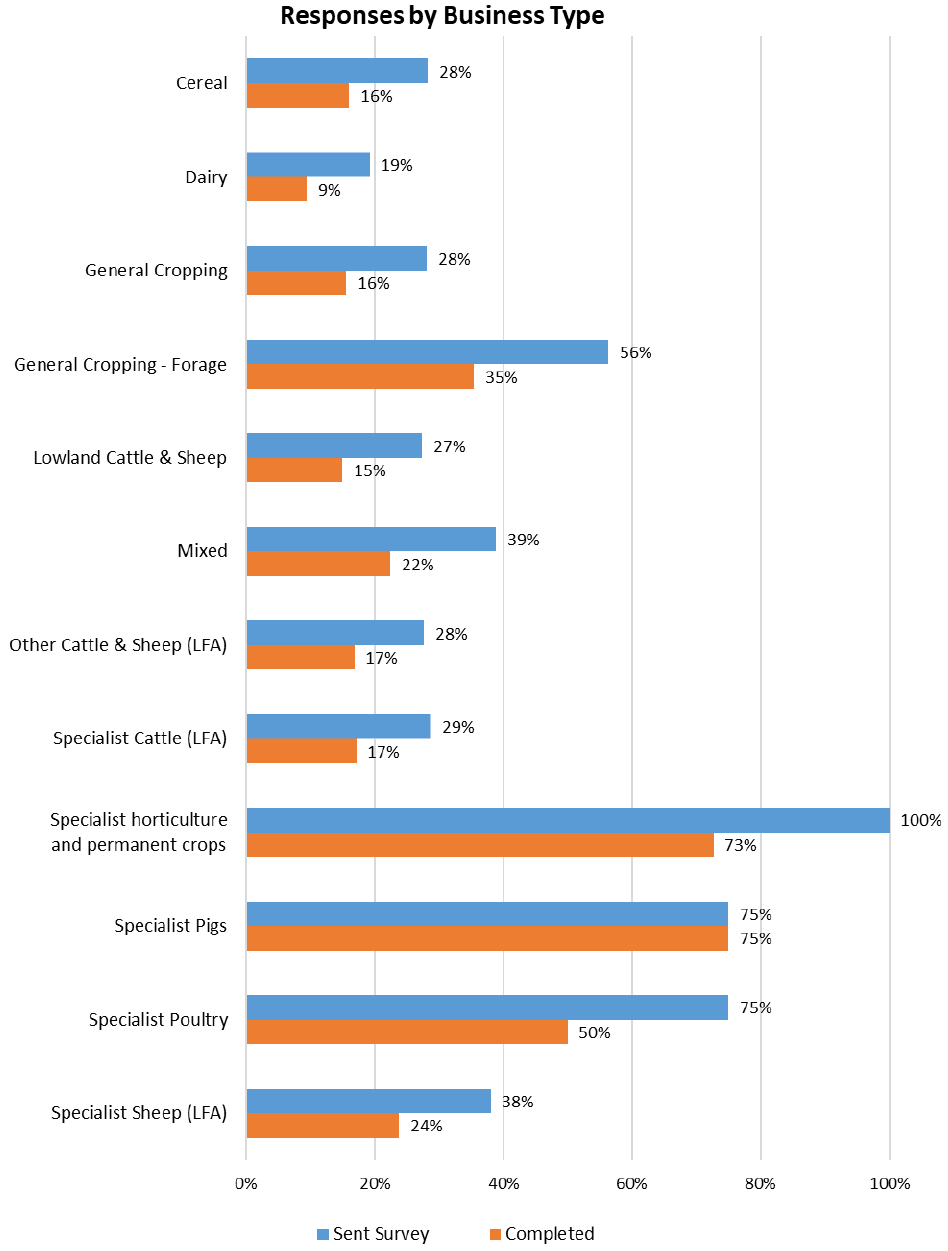
| Responses by Business Type | Invited | Sent Survey | Completed |
|---|---|---|---|
| Cereal | 318 | 90 | 51 |
| Dairy | 457 | 88 | 43 |
| General Cropping | 519 | 146 | 81 |
| General Cropping - Forage | 110 | 62 | 39 |
| Lowland Cattle & Sheep | 387 | 106 | 58 |
| Mixed | 512 | 199 | 115 |
| Other Cattle & Sheep (LFA) | 563 | 156 | 95 |
| Specialist Cattle (LFA) | 1488 | 428 | 255 |
| Specialist horticulture & permanent crops | 11 | 11 | 8 |
| Specialist Pigs | 4 | 3 | 3 |
| Specialist Poultry | 4 | 3 | 2 |
| Specialist Sheep (LFA) | 882 | 336 | 210 |
| Unknown | 20 | 25 | 17 |
| Total | 5275 | 1653 | 977 |
Figure 4 and Table 5 details the number of invited participants against respondents per standard labour requirement (SLR). As evident in both Figure 4 and Table 5 the respondents mostly follow the trend of those that were identified as part of the stratification methodology thus giving a representative sample of the Scottish agriculture sector by SLR at a country level.
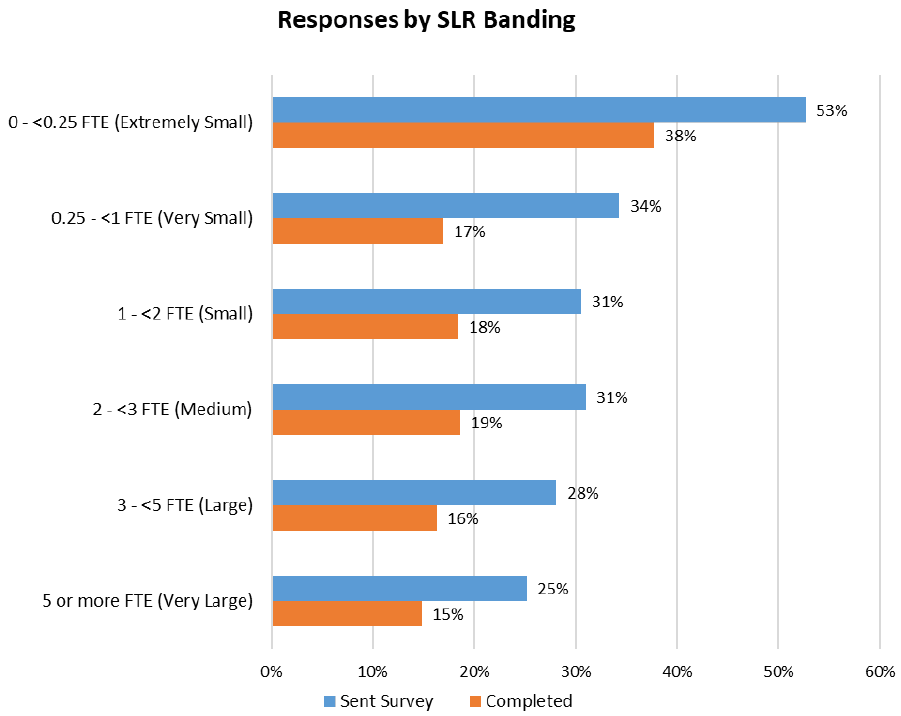
| Responses by SLR Banding | Invited | Sent Survey | Completed |
|---|---|---|---|
| 0 - <0.25 FTE (Extremely Small) | 461 | 243 | 174 |
| 0.25 - <1 FTE (Very Small) | 915 | 314 | 155 |
| 1 - <2 FTE (Small) | 706 | 216 | 130 |
| 2 - <3 FTE (Medium) | 532 | 165 | 99 |
| 3 - <5 FTE (Large) | 950 | 267 | 155 |
| 5 or more FTE (Very Large) | 1695 | 427 | 251 |
| Unknown | 16 | 21 | 13 |
| Total | 5275 | 1653 | 977 |
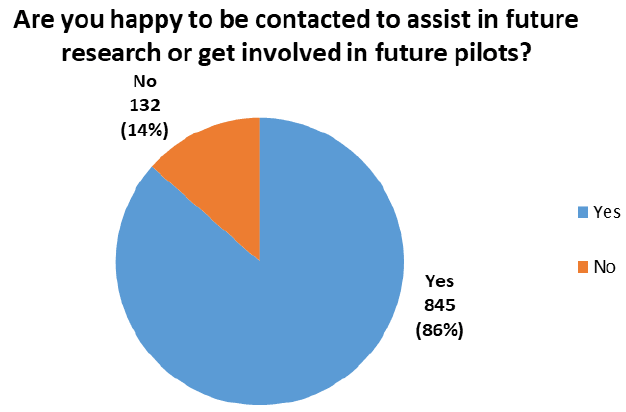
86.5% (845) of respondents would like to be contacted to assist in further research or get involved in future pilots, regarding TSF (Figure 5).
Contact
Email: TSF_Mailbox@gov.scot