National litter and flytipping strategy: consultation analysis
Analysis report of responses to our consultation on a new national litter and flytipping strategy.
2. Respondent profile and opinions
2.1 Respondent profile
The consultation received a total of 978 responses. Of these, 892 were from individuals, and 86 from organisations. Once the consultation was closed, organisations were categorised into the following stakeholder types. A list of responding organisations by stakeholder type is contained in Appendix A.
| Stakeholder type | Number | Percentage |
|---|---|---|
| Local authorities | 18 | 21% |
| Stakeholders (e.g. trade association, federation) | 14 | 16% |
| Statutory, public, or government-funded bodies | 5 | 6% |
| Voluntary, charity, community organisations | 40 | 47% |
| Waste/recycling firms, and private landowners | 8 | 9% |
Note: Throughout the remainder of this report, the commentary highlights key points of difference in the findings, by respondent group. Care should be taken when they are based on low base numbers of respondents (as indicated in the table above). The commentary should therefore be regarded as indicative.
Note: Some charts in this report may not sum to 100% due to rounding.
Note: Throughout this report, various terms are used to illustrate the weight and volume of themes emerging from responses to open-ended questions. We have defined these here for readers’ clarity and understanding.
- Majority: over half of respondents
- Large minority: fewer than half of respondents, typically between 30-40%
- Minority: under half of respondents, typically between 20-30%
- Some: multiple respondents, typically between 10-20%
- Several: multiple respondents, typically 10% or fewer
2.2 Respondents’ opinions of the consultation
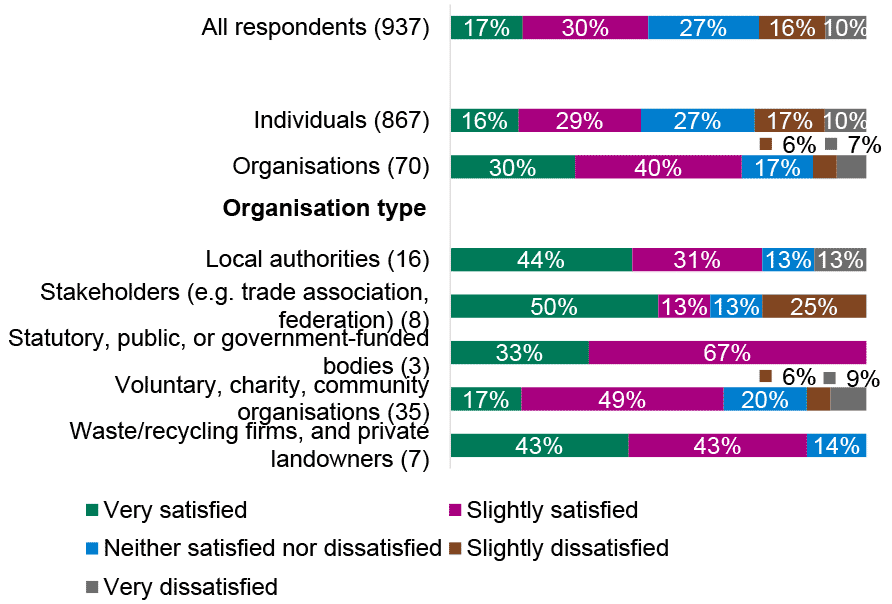
Almost half (47%) of respondents are very or slightly satisfied with the consultation. Around a quarter (26%) are very or slightly dissatisfied, while the remainder are neither satisfied nor dissatisfied (27%). Satisfaction levels are higher among organisations, with 70% being very or slightly satisfied.
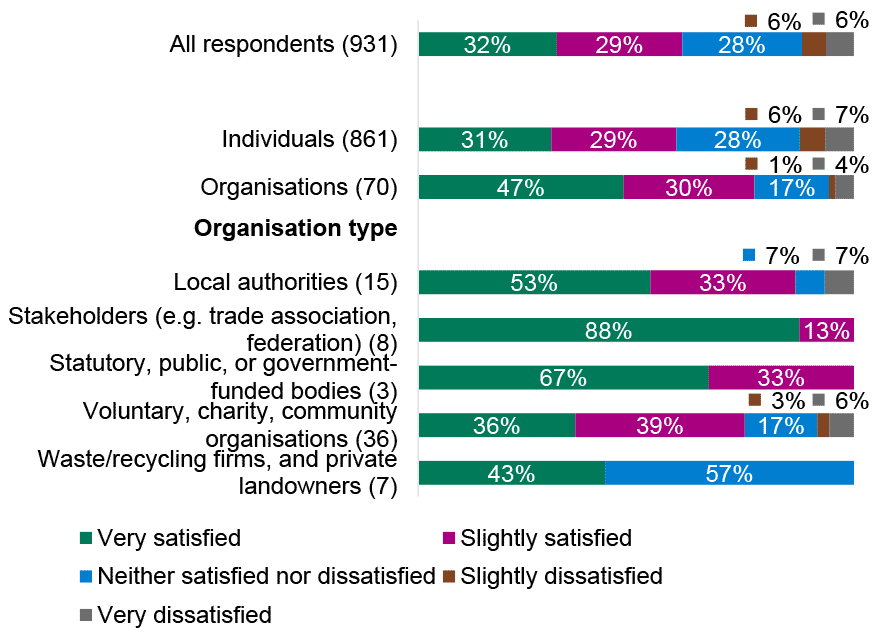
Around three in five (61%) respondents are very or slightly satisfied with using the platform (Citizen Space) to respond to the consultation. Around one in eight (12%) are very or slightly dissatisfied, while the remainder (28%) are neither satisfied nor dissatisfied. Satisfaction levels are higher among organisations, with over three quarters (77%) being very or slightly satisfied.
2.3 Anonymity and sharing responses
Over three in five (63%) respondents wish for their response to be published anonymously. A quarter (25%) are happy for their response to be published, while the remainder (12%) would not allow their response to be published.

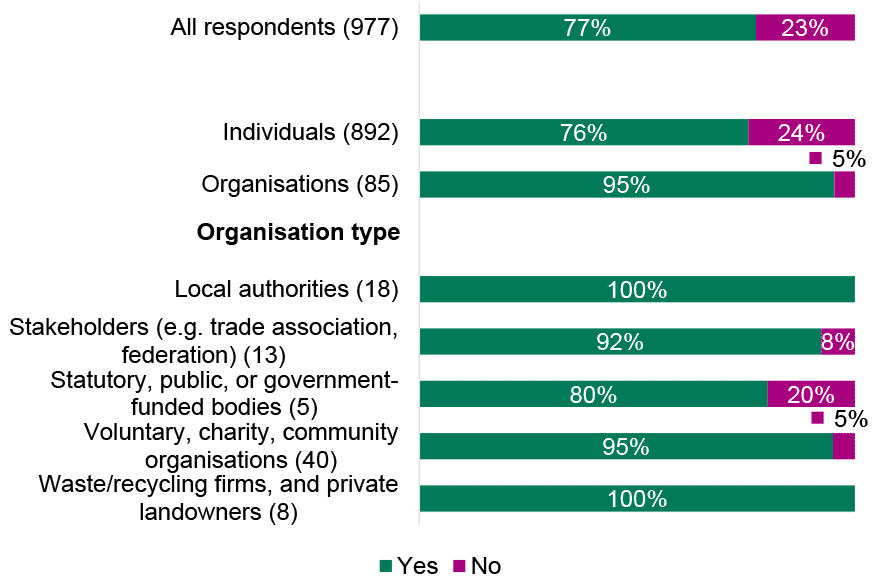
The Scottish Government will share responses internally with other policy teams who may be addressing related issues. Over three quarters (77%) of respondents are happy to be re-contacted by the Scottish Government in the future in relation to this consultation.
Contact
Email: NLFS@gov.scot