National Care Service - social care and caring experiences: evidence
Overview of recent evidence on experiences of social care and unpaid caring in Scotland. It is part of a collection of contextual evidence papers, setting out key sources of information about social care and related areas in Scotland.
3. Unpaid caring
This section of the survey asked questions about help and support that people provided to others, excluding caring responsibilities undertaken as part of paid employment or formal volunteering.
3.1 Provision of unpaid care
| Table 4: Reported caring intensity, 2019-20 and 2021-22 | |||
|---|---|---|---|
| 'Do you look after, or give any regular help or support, to family members, friends, neighbours or others because of either long term physical/mental health/disability or problems related to old age?' | 2019-20 | 2021-22 | Change(pp) |
| Yes, Up to 4 hours a week | 4.2% | 6.3% | 2.2 |
| Yes, 5-19 hours a week | 3.9% | 4.8% | 0.9 |
| Yes, 20-34 hours a week | 1.5% | 1.7% | 0.3 |
| Yes, 35-49 hours a week | 1.1% | 1.2% | 0.1 |
| Yes, 50 or more hours a week | 3.9% | 4.2% | 0.3 |
| No | 85.4% | 81.7% | -3.7 |
By contrast, the proportion of people without caring responsibilities has decreased, from 85.4% in 2019-20 to 81.7% in 2021-22. Over 1 in 20 people (5.5%) reported that they were providing 35 or more hours of care a week in 2021-22, up from 5.0% in 2019-20.
Figure 5 (below) shows that overall, respondents were much more likely to be supporting their parents/grandparents (48%), followed by spouses/partners (24%). The least-common recipient of care in proportional terms was “someone else” across all categories.
However, there is substantial variation in caring responsibility by age. People aged 65 and above were far more likely to be looking after a spouse/partner (53%) or a friend/neighbour (12%) than any other age group. By contrast, nearly three in four people (74%) caring for a parent/grandparent were aged 17-24, and over one quarter of people (27%) caring for a child/grandchild were aged 35-44.
This variation was likewise the case for sex. Males were more likely than females to be caring for a spouse/partner (32% to 19%). However, females reported greater proportions of looking after a parent/grandparent (52% to 42%) or a child/grandchild (19% to 14%), compared to males. No differences were identified between the proportions by sex across the other variables analysed.
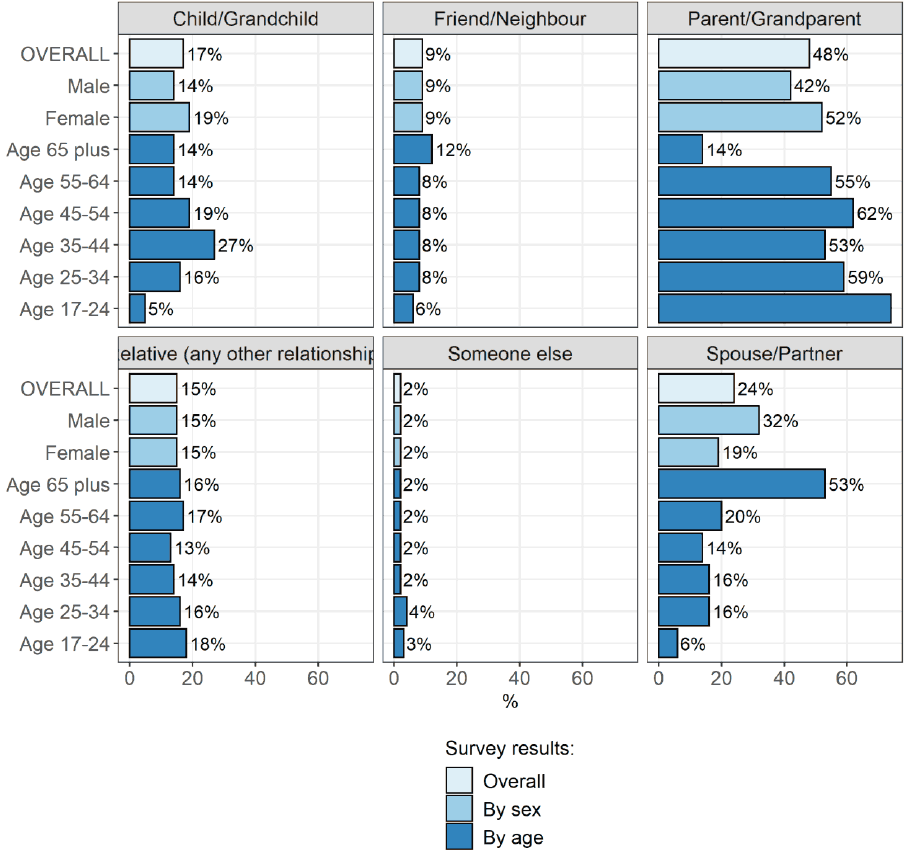
*Note: respondents could select more than one recipient of care
3.2 Support for caring
In addition to caring responsibilities, respondents were asked to comment on the support they had received in their caring roles. Figure 6 shows this data overall, and broken down by caring intensity. Overall, the most common type of support to help with the caring role came from family, friends or neighbours (27%). Only 2% of respondents had received support with a break from their caring responsibilities, and 2% had received services for the person being cared for to enable them to have a break. Furthermore, just 3% had a written plan about their caring role and support available to them.
Six in 10 respondents (60%) reported not receiving any support or help with their caring role. However the proportion of those not receiving support decreased as care intensity increased. Two in three (67%) of those with the lowest care intensity – up to four hours a week – did not receive any support or help, in contrast with 53% of those providing care in excess of 50 hours per week.
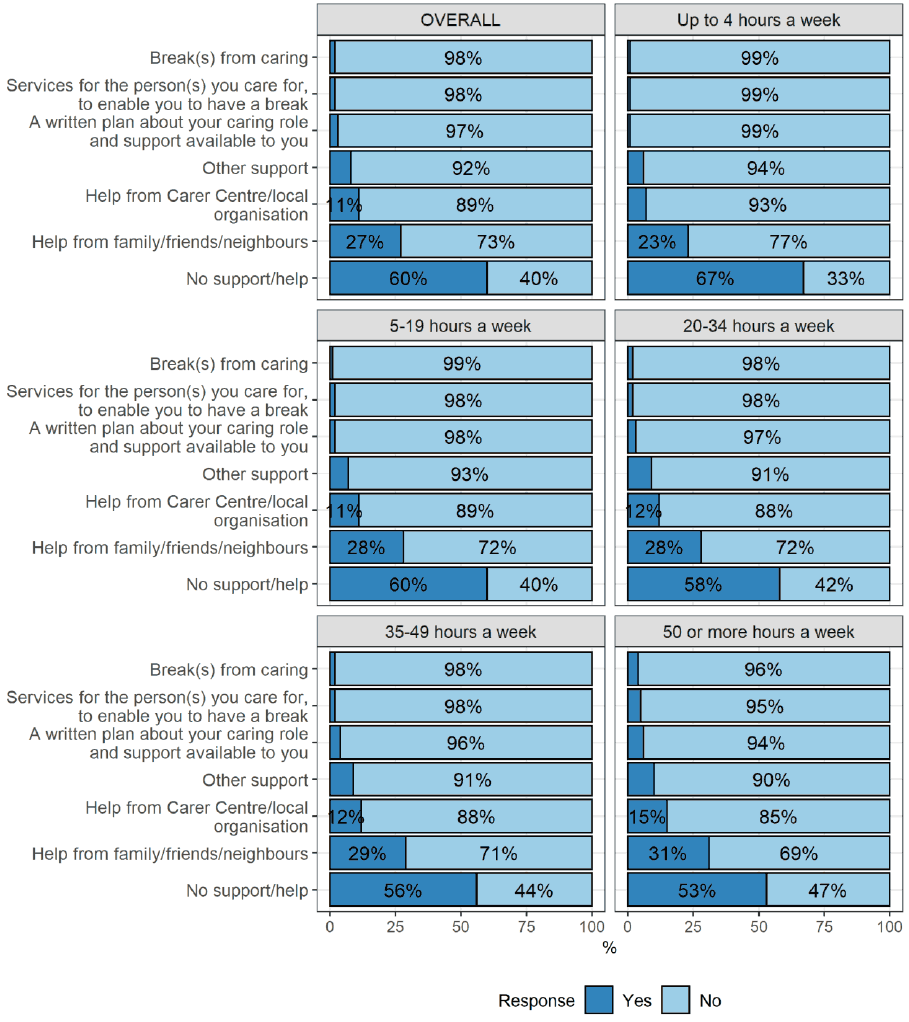
*Note: respondents could select more than one type of support
3.3 Experiences of unpaid carers
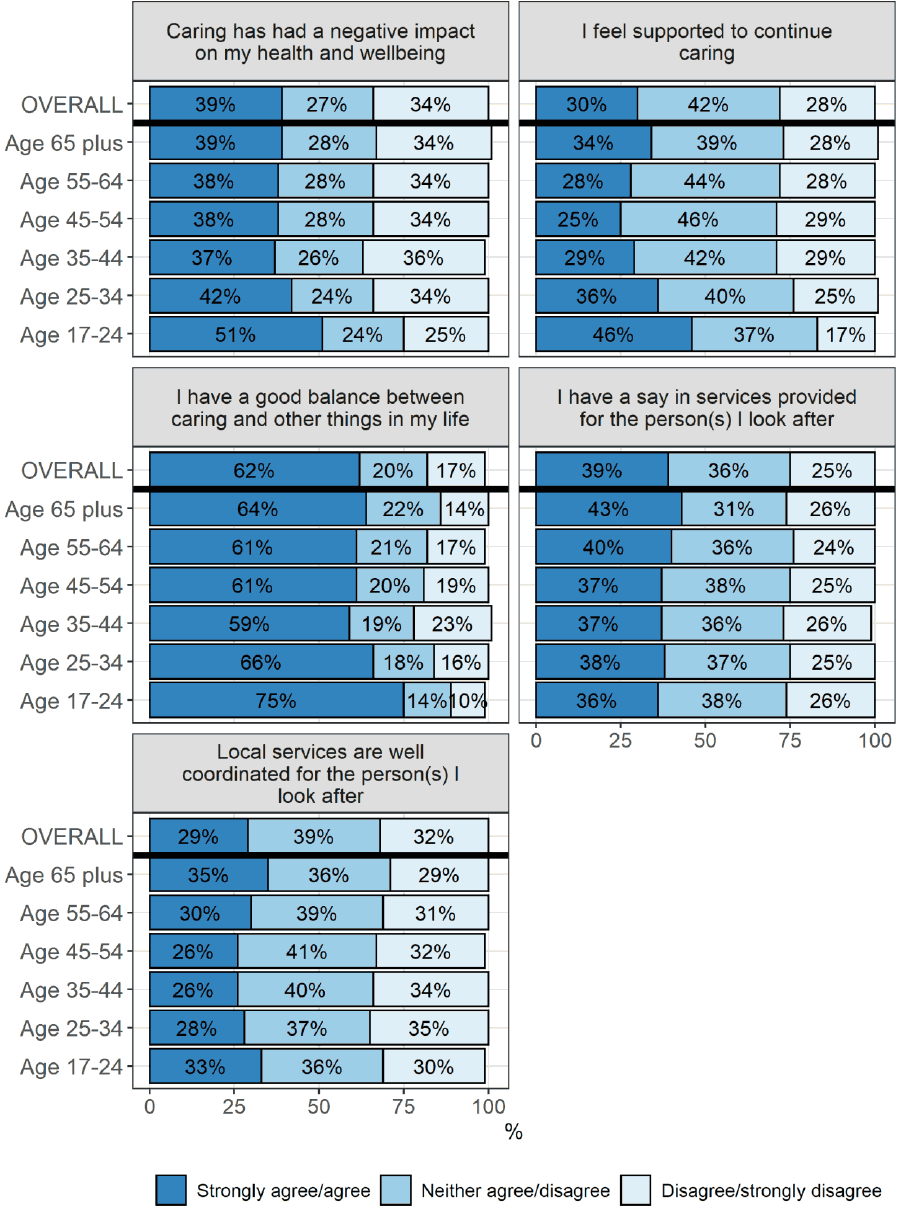
Survey respondents were also asked a range of questions about their experiences as a carer. The results of this question are shown in the following two figures. Figure 7a shows that 62% of respondents agreed or strongly agreed that they had a good balance between caring and other aspects of life. However, only 3 in 10 (30%) felt supported to continue in their caring role, while 42% neither agreed or disagreed with this statement. In addition, 39% reported that caring had a negative impact on their health and wellbeing. The lowest rates of agreement were with the statement “local services are well coordinated for the person I look after”, at 29%.
While rates of agreement with these questions by sex were nearly equal, Figure 7a shows there was notable variation in age. Survey respondents aged 17-24 were proportionally more likely to report feeling supported to continue caring (46%) and having a good balance between caring and other things (75%) compared to all other age groups. However, over half of the respondents in this younger cohort (51%) also reported that caring has had a negative impact on their health and wellbeing, higher than all other age groups. Meanwhile, carers aged 65+ were proportionally more likely to report having a say in services provided for the person they look after (43%), and that local services are well coordinated (35%).
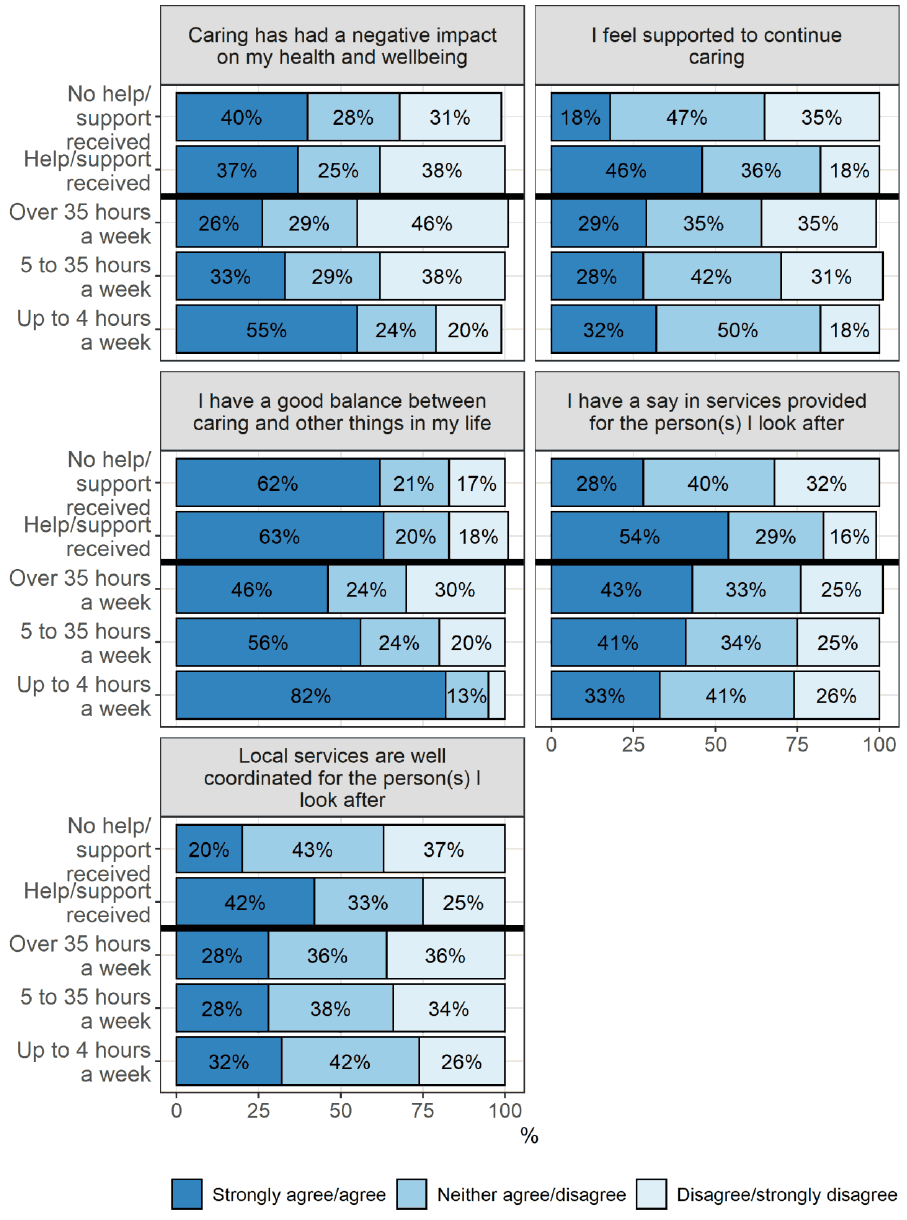
Data on self-reported feelings about being a carer are further explored in Figure 7b. In this chart, the question is broken down by caring intensity (measured by hours of care per week, see Table 4) and whether survey respondents received support for their caring role (see Figure 6).
There was notable variation in how respondents felt about being a carer by how much time they spent caring. People with low caring intensity (up to four hours a week) reported the highest rates of balance between caring and other things in their lives, with 82% in agreement. However, this group was also proportionally more likely to feel that caring had a negative impact on their health and wellbeing. 55% of respondents with low caring intensity agreed with this statement, which is over twice as high as respondents with the highest caring intensity of more than 35 hours a week (26%). Of this latter cohort, nearly half (46%) disagreed that caring had a negative impact on their health and wellbeing. In addition, respondents with caring responsibilities exceeding 35 hours a week were more likely to agree that they had a say in services provided for the person they looked after (43%) than carers with responsibilities of less than four hours per week.
This variation was likewise the case depending on whether respondents had help or support with their caring roles[7], for all responses except having a good balance between caring and other things in their lives, where responses were equal. Compared to people who had not received support or help, those who had received support or help were proportionally much more likely to agree that:
- They had a say in services provided (54% to 28%);
- They felt supported to continue caring (46% to 18%);
- Local services were coordinated for the person they looked after (42% to 20%), and;
- They felt caring has had a negative impact on their health and wellbeing (40% to 37%).
In addition, nearly half of respondents who had not received support (47%) neither agreed nor disagreed that they felt supported to continue caring. However, no differences were identified between rates of agreement for the statement “I have a good balance between caring and other things in my life” between these two groups. Nevertheless, Figure 7b shows that self-reported feelings about being a carer are generally worse for people who have not received help or support in their caring role.
Contact
Email: SWStat@gov.scot