National Care Service - social care and caring experiences: evidence
Overview of recent evidence on experiences of social care and unpaid caring in Scotland. It is part of a collection of contextual evidence papers, setting out key sources of information about social care and related areas in Scotland.
2. People receiving care and support
This section of the survey asked questions about help and care support for everyday living, including support with a caring role and help that people received from any organisations, friends or family.
2.1 Care and support received
Overall, around 10.4% of respondents to the HACE survey reported receiving any kind of help and support with everyday living within the last 12 months. The remaining 89.6% indicated they received no help, including 2.5% who said that they had not received any help but felt that they needed it. Table 1 shows the percentage of people receiving care and support by type for 2021-22, for the 10% of respondents that indicated they received help. The top three types of support reported were help with household tasks (6.1% of respondents), help with personal tasks (5.9% of respondents) and help for activities outside the home (4.9% of respondents).
| 'In the last 12 months, have you had any help or support with everyday living?*' | 2021-22 |
|---|---|
| Yes, help for me with personal tasks | 5.9% |
| Yes, help for me with household tasks | 6.1% |
| Yes, help for me for activities outside my home | 4.9% |
| Yes, help for me with adaptations, and/or equipment for my home | 3.3% |
| Yes, an alarm service that can get me help | 1.9% |
| Yes, help to look after someone else | 2.1% |
n=16,042
*Note: Respondents could select more than one service and the proportion who indicated 'no' (90%) are not presented.
Levels of satisfaction with services varied by help/support received, as shown in Figure 1:
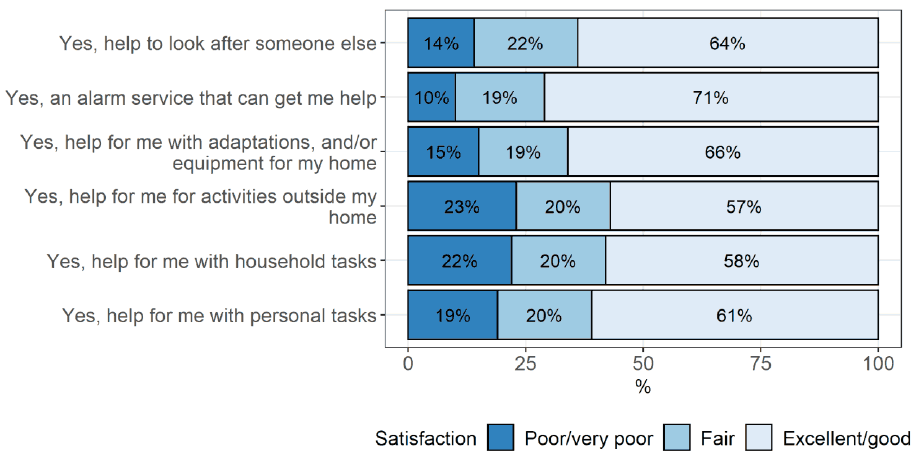
*Note: respondents could select more than one service
Nearly three out of four people rated their alarm service positively, although this was proportionally the lowest reported service (see Figure 1; Table 1). Note that respondents could choose more than one service. The highest levels of dissatisfaction were for help with activities outside the home (23%) and household tasks (22%). The top bar in Figure 1 shows satisfaction amongst those who care for others. Sixty-four percent of people who received help to look after someone else reported positive satisfaction with their service, compared to 14% with negative views and 22% who were neutral.
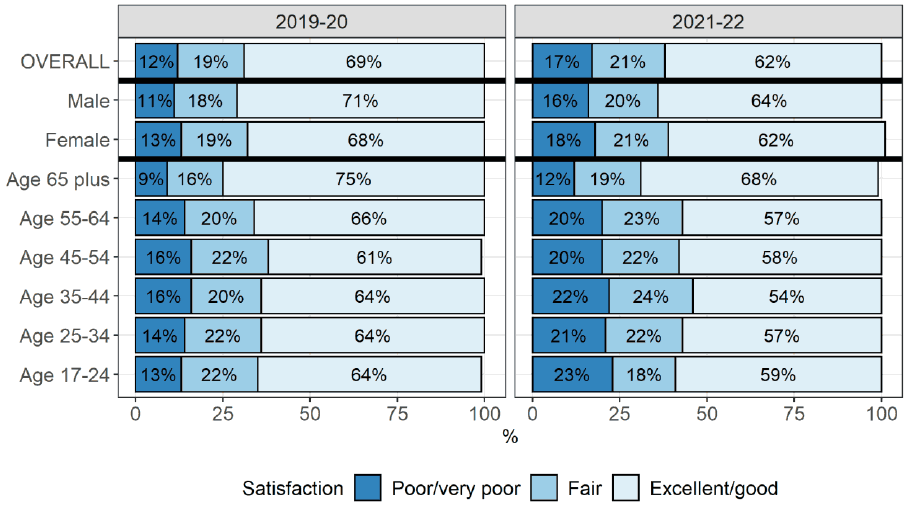
Figure 2 (next page) shows the survey results for satisfaction with care or support services overall. When asked to rate their help, care or support services (excluding care/help received from friends and family), 62% of respondents reported that their services were either ‘good’ or ‘excellent’ in 2021-22. This is a decrease from 69% in 2019-20. Conversely, the proportion of people considering their services ‘poor’ or ‘very poor’ increased five percentage points (12% to 17%).
These trends remained consistent when broken down by selected characteristics:
- The overall proportion of respondents rating their services as positive decreased between 2019-20 and 2021-22;
- In 2021/22, males were proportionally more likely than females to rate their quality of care as positive, at 64% and 62% respectively. Similarly, people aged 65 and over were proportionally more likely to rate their quality of care as positive compared to the national figure, at 68% and 62% respectively;
- The oldest age cohort was more likely to rate their services positively compared to the youngest age cohort (aged 17-24) in 2021-22 (68% and 59% respectively).
2.2 Experiences of care and support received
As well as considering the types of care and support people receive, it is important to understand the context in which this care was received, and people’s experiences of receiving care and support. Table 2 shows the sources of funding for people’s help and support with everyday living. There have been decreases in reported proportions of funding from all sources between 2019-20 and 2021-22, with the biggest drop being the NHS (-4.8 percentage points) This has coincided with a substantial increase in the rates of people for whom unpaid care from friends or family forms at least part of their support, which increased by 9.7 percentage points over the same period.
| 'Who funds your help or support with everyday living?' | 2019-20 % | 2021-22 % |
Percentage Point change between surveys |
|---|---|---|---|
| Unpaid care from friends/family | 36.4 | 46.2 | 9.7 |
| Me/family | 48.6 | 47.1 | -1.5 |
| Other | 12.3 | 11.5 | -0.8 |
| Council | 25.1 | 21.9 | -3.1 |
| NHS | 17.0 | 12.2 | -4.8 |
*Note: Respondents could select more than one source of funding
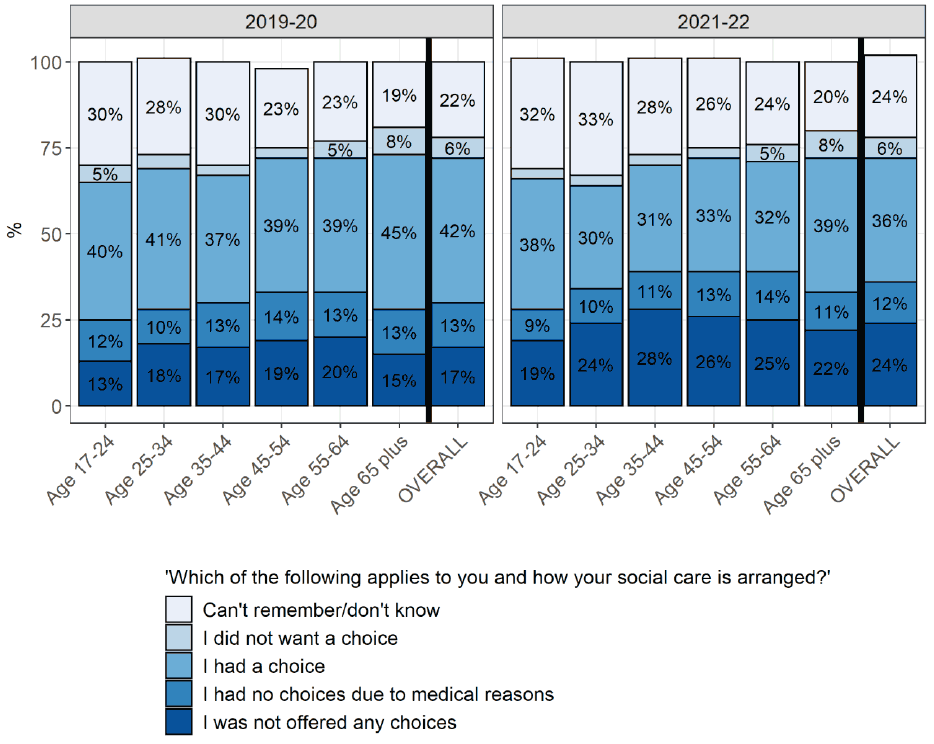
The survey results also suggested a decline in the proportion of people who had a choice in arranging their social care, as shown in Figure 3. The overall proportion of people reporting that they had a choice in arranging their social care fell from 42% to 36%, while those saying they were not offered a choice increased from 17% to 24% – an increase of 7 percentage points.
When broken down by age, the largest increase in those who were not offered any choice were aged 35-49 (17% in 2019-20 to 28% in 2021-22). Across both years, young people (aged 17-24) reported the lowest rates of not being offered any choice in their social care arrangements, at just under 1 in 20 (19%) in 2021-22. Respondents from the oldest age group (aged 65 and over) reported the highest rates of being offered a choice in their care across both years (45% in 2019-20 and 39% in 2021-22).
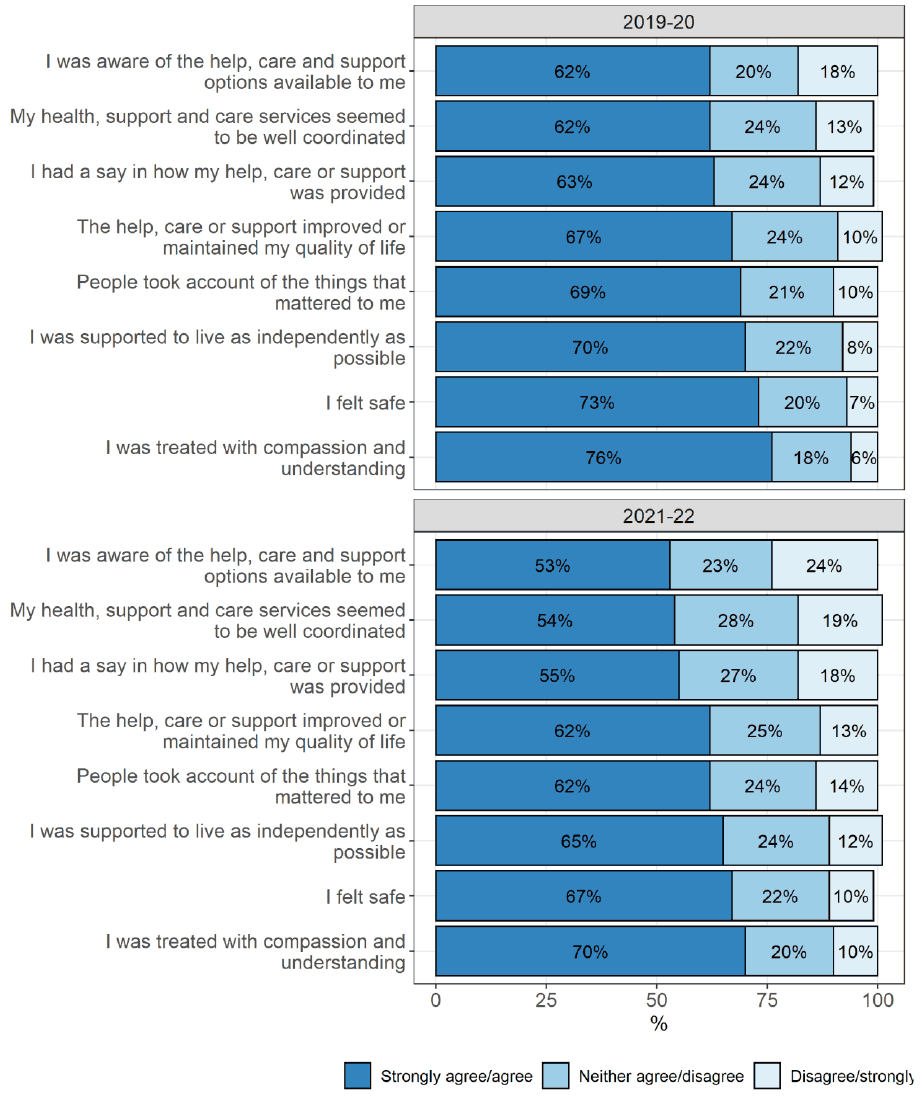
Finally, respondents were asked to assess how they felt about help, care and support services more generally. The results of this analysis for 2019-20 and 2021-22 are shown in Figure 4. Across both survey years, respondents agreed most often that they were treated with compassion and understanding (70% in 2021-22). However, the lowest rates of agreement were for awareness of health, care and support options available – just over half (53%) of respondents agreed with this in 2021-22, which is down 8 percentage points since 2019-20 (62%). This aligns with the results in Figure 3 which showed increasing proportions of people not offered a choice in arranging their care. Overall, Figure 4 shows that rates of positive responses declined, while negative responses increased, for every question between the 2019-20 and 2021-22 surveys.
2.3 Unmet need for care and support
There were 2.5% of respondents who reported that they had not had any help or support with everyday living, but felt they needed it. This proportion is unchanged since 2019-20. The 2021-22 survey data outlined in Table 3 shows that ‘unmet need’ was higher among some groups. People not receiving support but feeling they needed it in 2021-22 were proportionally more likely to be: non-white[4], disabled, from deprived areas, LGBO[5] and unpaid carers.
| Category | Variable | Not had any help but felt that I needed it (%) |
|---|---|---|
| Disability issues | Yes, limited a lot | 8.7 |
| Yes, limited a little | 3.8 | |
| No | 1.2 | |
| Ethnicity | Black/Minority/Ethnic | 4.5 |
| White | 2.4 | |
| Caring responsibilities | Up to 4 hours a week | 2.2 |
| 5-19 hours a week | 3.6 | |
| 20-34 hours a week | 7.6 | |
| 35-49 hours a week | 5.7 | |
| 50 or more hours a week | 9.1 | |
| No | 2.0 | |
| Sexual orientation | Heterosexual/Straight | 2.3 |
| Gay/Lesbian | 3.1 | |
| Bisexual | 6.3 | |
| Other | 7.2 | |
| SIMD[6] | 1 (most deprived) | 5.0 |
| 2 | 3.3 | |
| 3 | 2.2 | |
| 4 | 2.0 | |
| 5 (least deprived) | 1.4 | |
| Total | - | 2.5 |
Contact
Email: SWStat@gov.scot