National Adult Salmon Sampling Project
Report of a project developed by Marine Directorate, Fisheries Management Scotland and local District Salmon Fishery Boards and Trusts to investigate options for sampling adult salmon caught in rod fisheries and scientific netting during 2021-2023.
3. Results
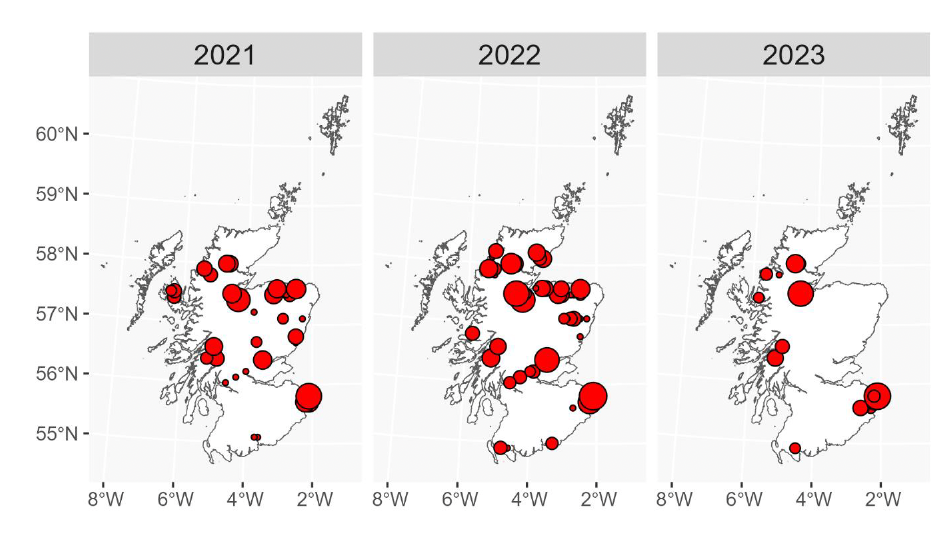
A total of 1119 adult salmon were sampled during 2021-2023 across 31 different rivers between May and October, with most samples in July and August (Table 2). The numbers sampled were a function of effort and were highest in 2022. There was also a wide geographic range in the numbers of salmon sampled with the largest numbers tending to be sampled on large east coast rivers (Figure 2).
|
Month |
2021 |
2022 |
2023 |
Total |
|---|---|---|---|---|
|
May |
3 |
32 |
6 |
41 |
|
June |
0 |
60 |
6 |
66 |
|
July |
45 |
212 |
107 |
364 |
|
August |
184 |
157 |
84 |
425 |
|
September |
92 |
123 |
7 |
222 |
|
October |
0 |
0 |
1 |
1 |
|
Total |
324 |
584 |
211 |
1119 |
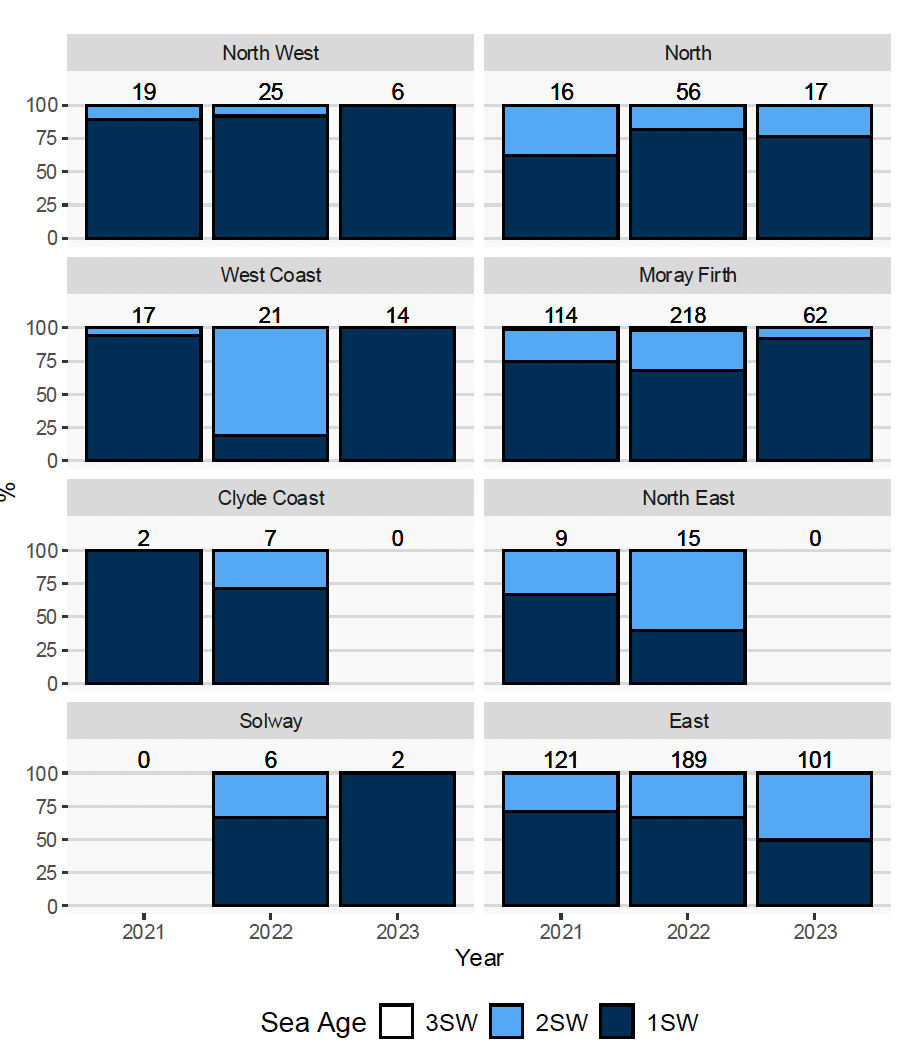
It was possible to identify the sea ages of 1037 of the 1119 (93%) salmon sampled, with fish becoming more difficult to age later in the season as the scales started to show greater levels of erosion. An overview of the sea ages of salmon sampled during 2021-23 is shown in Figure 3. The overall pattern of sea ages was similar in the three years with a greater number of one sea winter salmon (1SW) in the sample than MSW fish. The exception to this was the West Coast and North East fishery regions where MSW were more prevalent during 2022. Of the 311 multi-sea winter salmon (MSW) sampled during the project 306 (98%) had spent 2 winters at sea (2SW) while only 5 (2%) were 3SW salmon (all within the Moray Firth region).
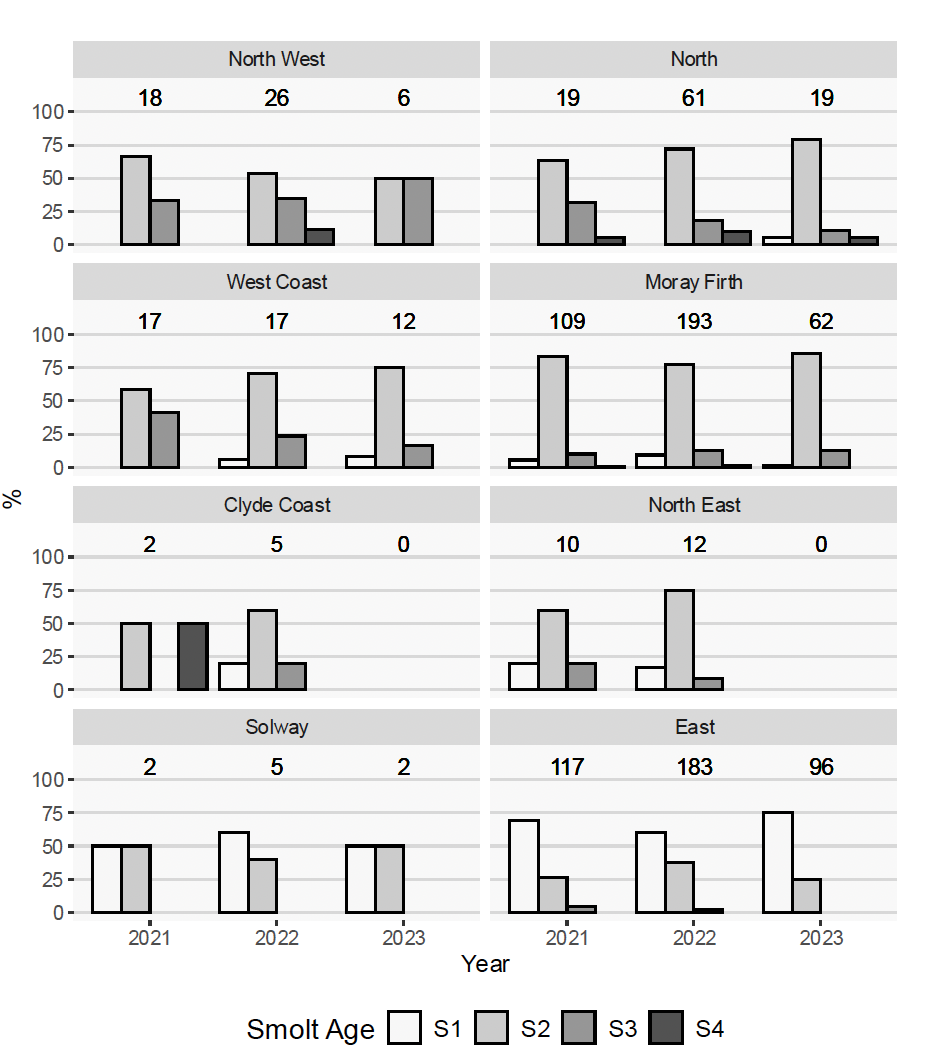
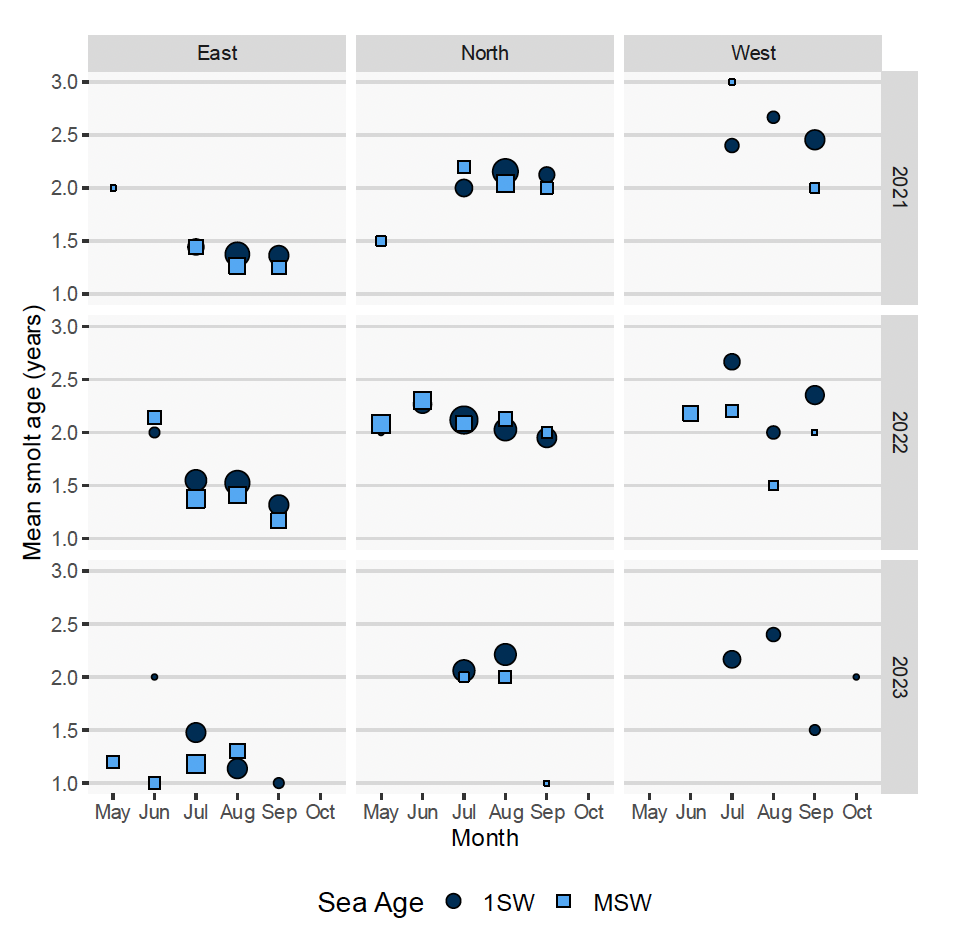
It was possible to identify the smolt ages of 993 (89%) of the salmon sampled over the three years. Smolt age was similar among the sampled years (Figure 4). Generally, S2s (two year old smolts) were the dominant age class, except in the East and Solway regions where S1s (one year old smolts) were the most common age class.
3.1 Sea Age
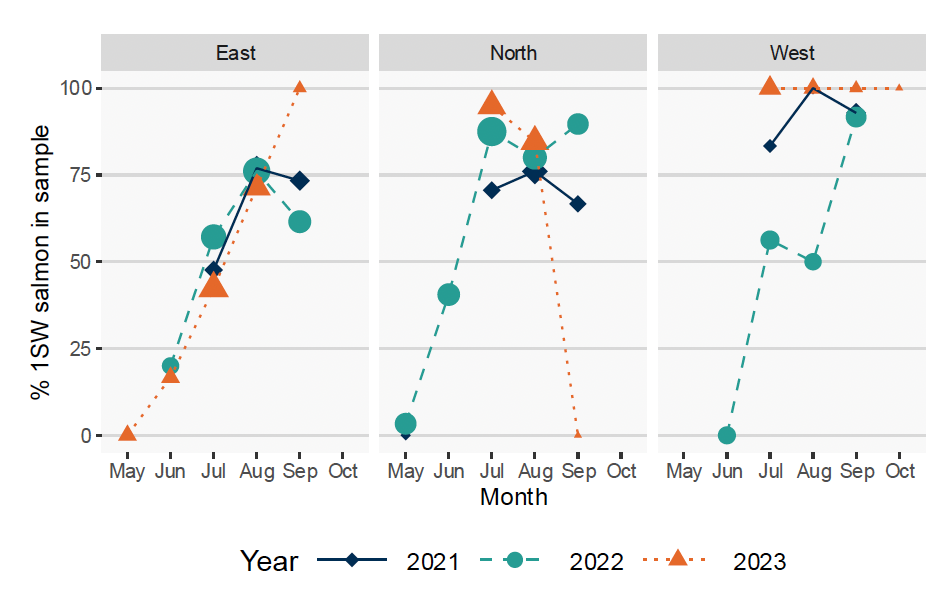
To examine how the sea age of salmon changed through the season the samples were first grouped into the East, North and West areas. The incidence of 1SW salmon increased over the season in all three areas, with few 1SW salmon sampled during May/June to them becoming the most prevalent age class during August/September (Figure 5). Beyond this, there were no consistent patterns in the data. For example, while the percentage of 1SW salmon was higher in the 2022 samples from the North compared to 2021 the opposite was true for the West.
3.2 Smolt Age
Examination of the mean smolt age shows little difference between years or sea ages (Figure 6). However, age did vary among areas and there was a suggestion that smolt age declined through the season.
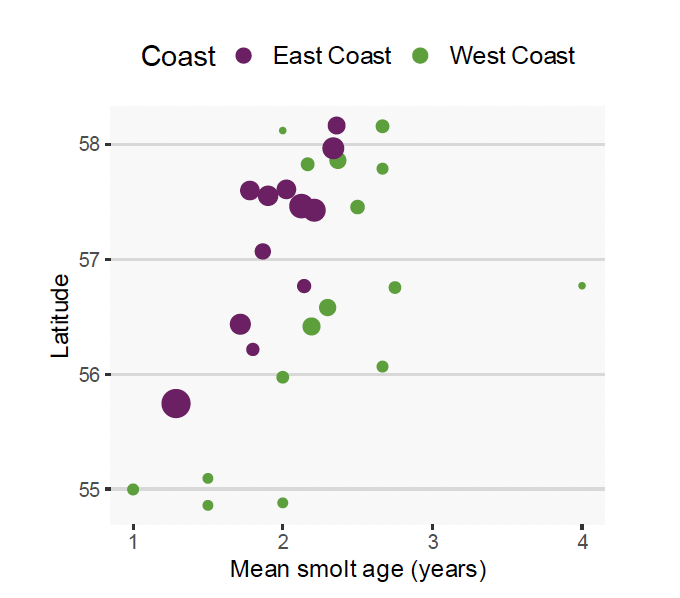
Mean smolt age varied with latitude on both East and West coasts of Scotland, with some evidence for a higher mean smolt age on the West compared to the same latitude on the East Coast (Figure 7).
3.3 Size
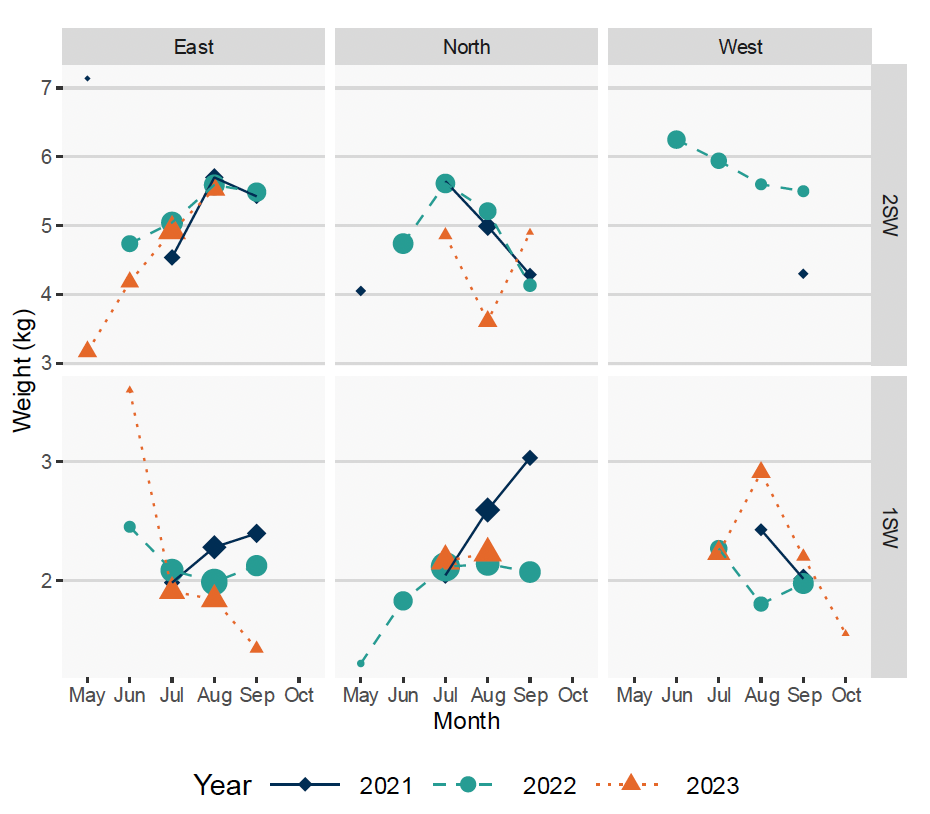
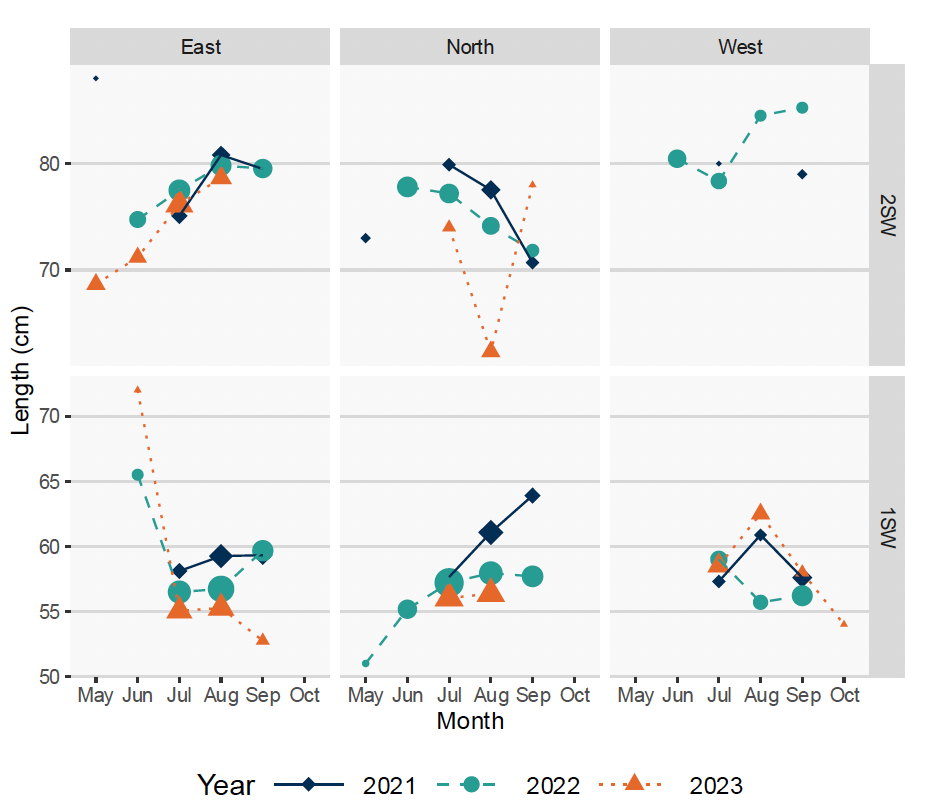
Although sample sizes were limited there were suggestions of consistent patterns in size among areas, with 1SW salmon tending to be larger in 2021 than in 2022 and 2023 while 2SW salmon were a similar size (Figures 8 and 9). However, there are also clear differences in the patterns. For example, while the size of 2SW salmon increases during the season in the East it declined in the North and West.
3.4 Sex
Results from the genetic determination of sex were available for 924 of the salmon where it was possible to determine a sea age from the scales. The reported (visual) percentage of females for both 1SW and MSW salmon was found to be lower than that determined using the genetics method in 2021 and 2023 but similar in 2022 (Figure 10).
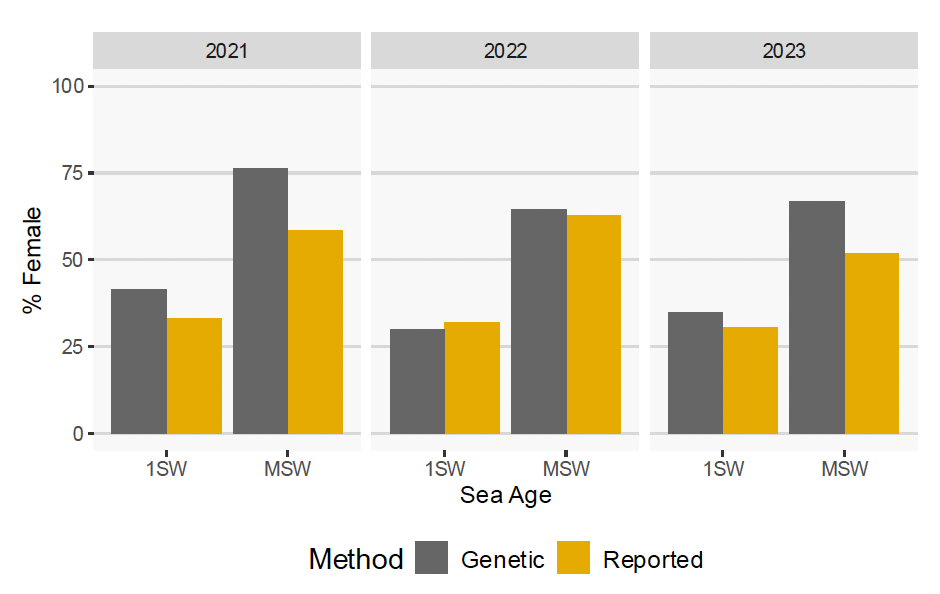 MSW salmon were found to be female than 1SW salmon in the study. The percentage female salmon identified using genetic assignments was greater than that from visual assessment, particularly in 2021 and 2023.">
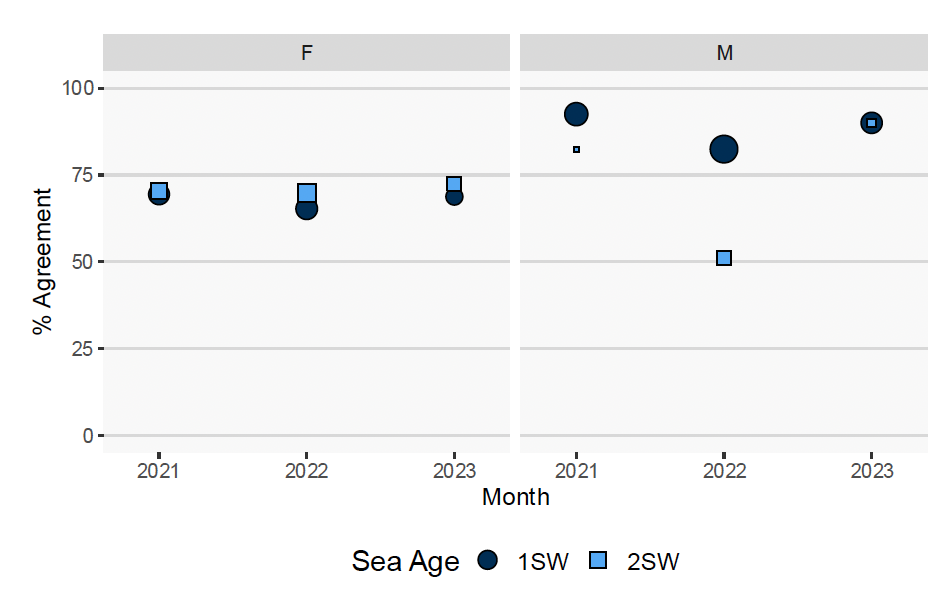
Overall the visual and genetic methods agreed in 69.1% cases for genetically assigned females (n = 408) compared to 83.5% of genetic males (n = 516). Closer examination of where the visual sex agreed with the genetic sex highlights that the level of disagreement differs between years, sea ages and genetic sex (Figure 11).
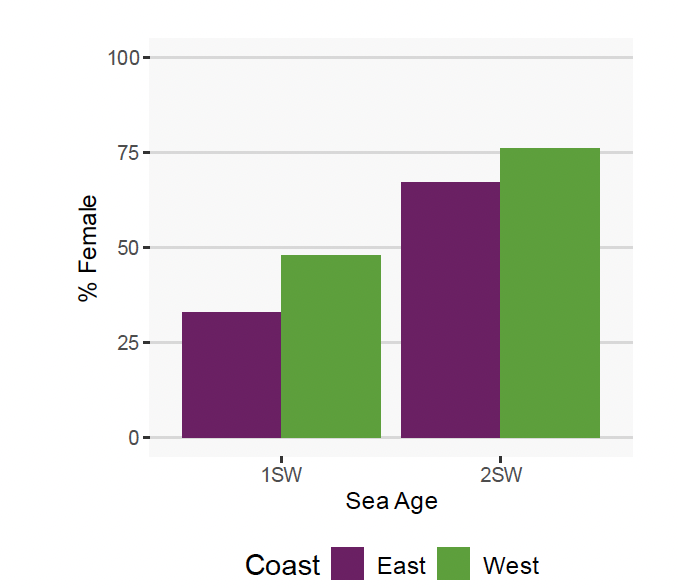
A greater percentage of 2SW salmon were found to be female compared to 1SW fish. In addition, there was a difference in the sex ratio between the East and West Coasts with a greater percentage of salmon on the West Coast being female for both 1SW and 2SW age classes (Figure 12).
3.5 Long Term Patterns
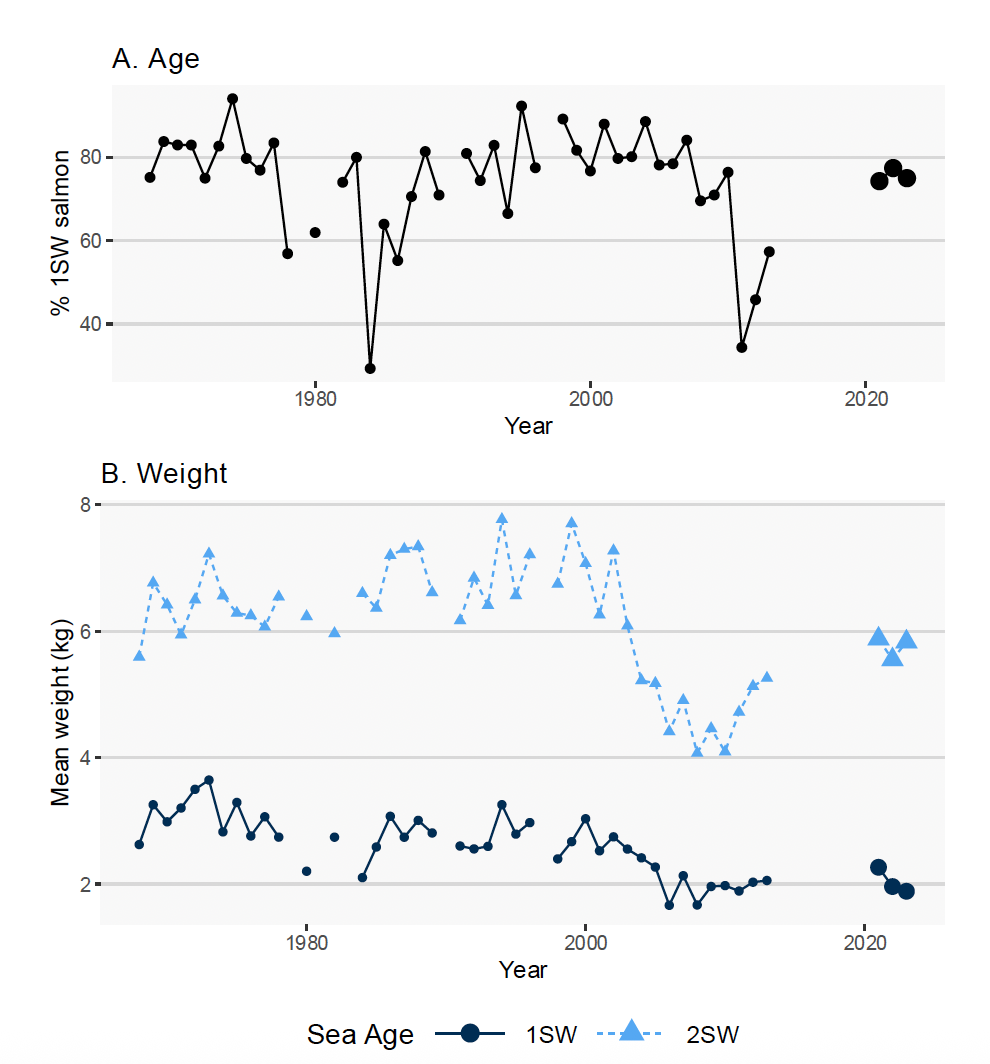
There are long term data available from sampling of commercial net catches on the River Tweed. These allow the 2021-23 samples to be placed into a wider context. To account for seasonal change in age and size, the percentage of 1SW fish and the weights of 1SW and 2SW fish sampled by net during the month of August were compared (Figure 12). There are clear long-term fluctuations in the ages and lengths of salmon sampled on the River Tweed. Compared to the early 2010s there were more 1SW fish in the 2021-23 samples (Figure 13A), while the weights of both age classes have recently increased from the low values seen from the mid 2000s (Figure 13B).
Contact
Email: stuart.middlemas@gov.scot