Publication - Research and analysis
Monthly economic brief: September 2021
The monthly economic brief provides a summary of latest key economic statistics, forecasts and analysis on the Scottish economy.
Consumption
Consumer sentiment continues to strengthen, albeit marginally, in August.
Consumer sentiment
- In August, consumer sentiment in Scotland continued to strengthen with the Scottish Consumer Sentiment Indicator rising 0.1 points to 6.8, and is a notable improvement from the series low levels of sentiment in the second half of 2020.
- The general improvement in sentiment is the result of several factors. Consumers on balance continue to respond that current circumstances regarding the economy and their household financial security are worse than they were in the previous year, however sentiment improved relative to July.
- Furthermore, looking ahead to the next 12 months, respondents still expect the economy and their household finances to improve over the coming year (relative to the current situation), though the level of optimisim slightly weakened over the month.[22]
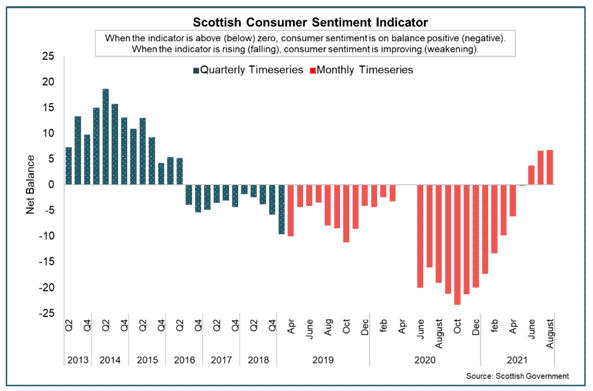
- Lastly, in terms of attitude to spending money currently, sentiment has strengthened significantly over the past year, consistent with the improvements in the economy and household finances indicators. Latest data for August showed sentiment on this declined slightly over the month with the indicator returning to negative territory, signalling that respondents confidence about spending money decreased over the month.
- Sentiment indicators continue to be highly sensitive to the rapidly moving developments on the pandemic and the unprecedented economic impacts that we have seen. As such, they will be a key indicator in understanding the level to which a recovery in consumer sentiment feeds through to changes in consumption over the course of the year.
Retail sales
- In August, retail sales in Great Britain fell 0.9% on July, however were up 0.3% in the three months to August (compared with the previous three months) and are 4.6% higher than their pre-pandemic level.[23]
- Over the month, food store sales fell 1.2% with some evidence to suggest that easing of restrictions on the hospitality sector had an impact on sales with people increasing their spend in restaurants and bars. Similarly, non-food sales fell 1.0% driven by falls in department stores sales and other stores such as for sports equipment and computers.
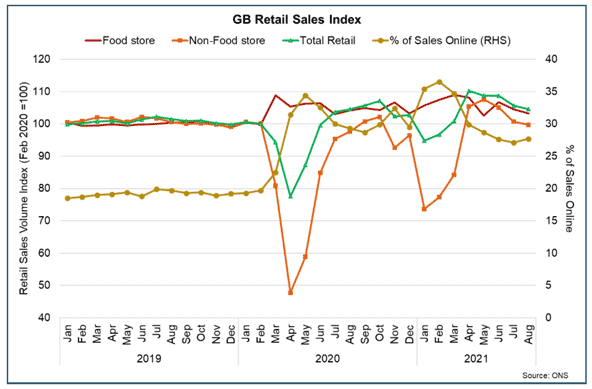
- On a monthly basis, the proportion of retail sales online increased slightly to 27.7% in August, though has remained broadly stable since June. While the share of retail sales online has fallen back from earlier in the year, it remains substantially higher than in February 2020 prior to the pandemic (19.7%).
Household Savings and Consumer Credit
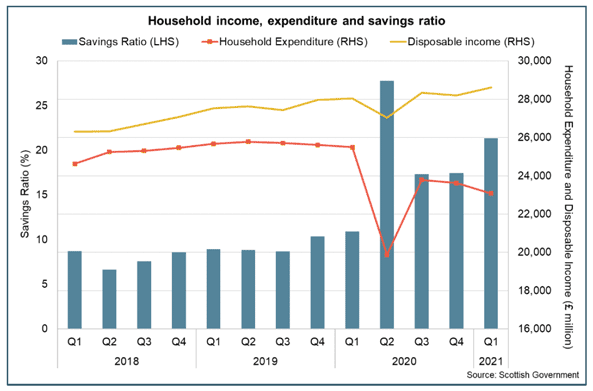
- At an aggregate level, household disposable income in Scotland continued to rise into the first quarter of 2021 with incomes supported by the furlough scheme while household expenditure fell reflecting the lockdown restrictions in place over the period. This has not been the case across all parts of the economy, with lower income households facing more significant financial challenges. At an aggregate level, the savings ratio rose in the first quarter of 2021 to 20%, though remained lower than the peak at the start of the pandemic.
- More recent Bank of England data for August provide insight into how UK household savings have changed over the period that restrictions have eased. At an aggregate level, net flows from UK households into deposit-like accounts increased to £9.1 billion in August. This continues to remain relatively high compared to pre-pandemic levels when the average net inflow in the year to February 2020 was £4.7 billion. However, it has fallen from periods of more elevated inflows over the past seventeen months during which the average inflow has been £13 billion.[24]

- Alongside this, growth in consumer credit remains relatively weak. In August, consumers borrowed £0.4 billion in credit, split between credit card debt and 'other' forms of consumer credit (such as card dealership finance and personal loans). This level of borrowing remains significantly lower than the pre-pandemic monthly average of £1.2 billion in the two years to February 2020.
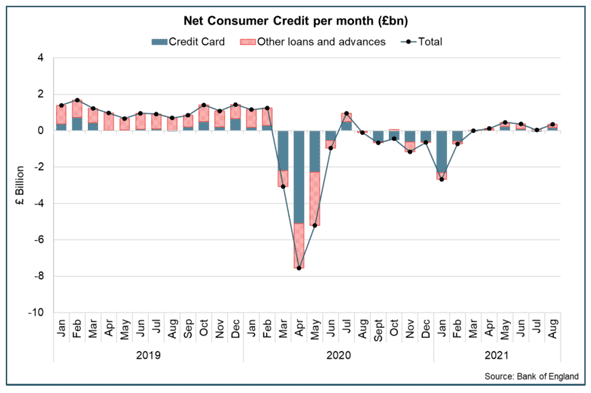
- Overall, the latest data shows the pace of household savings has slowed relative to the start of the year, however remains higher than pre-pandemic levels while growth in net borrowing remains subdued. Looking ahead, the extent and pace at which households subsequently spend accumulated savings and further increase borrowing remains uncertain.
Interest rate and inflation
- UK CPI inflation was 3.2% in August, up from 2.0% in July, while the inflation rate in the US was 5.3% and 3.0% in the Eurozone.
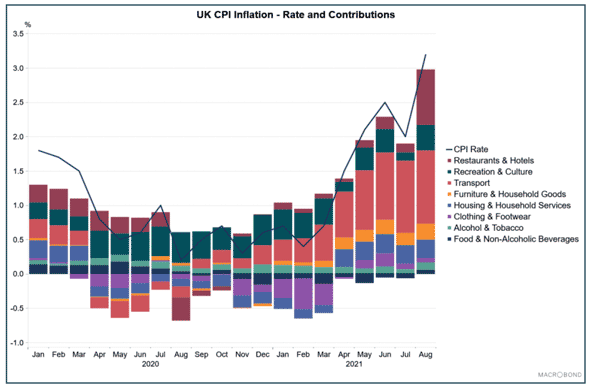
- UK inflation has risen sharply as the economy has reopened in recent months reflecting in part a global rise in input cost pressures (raw materials) which are in part being passed through to consumer goods, base effects from price falls at the start of the pandemic (e.g. in energy), and an increase in business activity and demand as restrictions have eased.
- The increase in August in part reflects price rises in restaurants and hotels, recreation and culture, and food and non-alcoholic beverages. However, the ONS set out that base effects are a key driver of the inflation rate increase within these goods and services. For example, in August 2020 there were restaurant and café price discounts resulting from the government's Eat Out to Help Out scheme and, to a lesser extent, reductions in Value Added Tax (VAT).[25]
- In August, the Bank of England forecast UK inflation to rise to 4% in Q4 2021 before falling back to the 2% target rate in late 2023 and consider the above target levels of inflation to be temporary as a result of the economy rebalancing. At their September meeting, the Monetary Policy Committee (MPC) made no change to monetary policy, maintaining the Bank Rate at 0.1% and the current programme of Quantitative Easing. However, the rise in gas prices and the sustained elevation of other cost pressures mean inflation could remain above 4% slightly longer than forecast in August.[26]
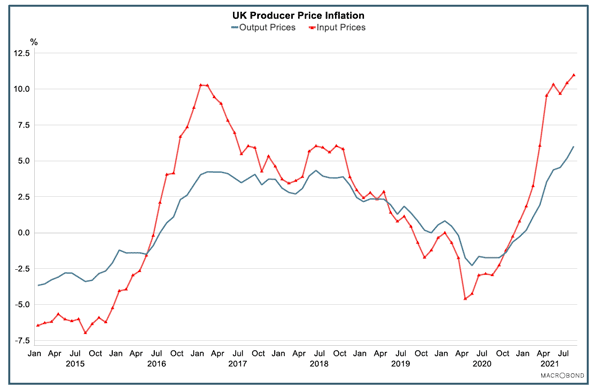
- In terms of producer price inflation, input price inflation was 11.0% in August while output price inflation was 5.9%; both having increased compared to July and at their highest rates since 2011.[27]
Contact
Email: OCEABusiness@gov.scot