Publication - Research and analysis
Monthly economic brief: March 2022
The monthly economic brief provides a summary of latest key economic statistics, forecasts and analysis on the Scottish economy.
Consumption
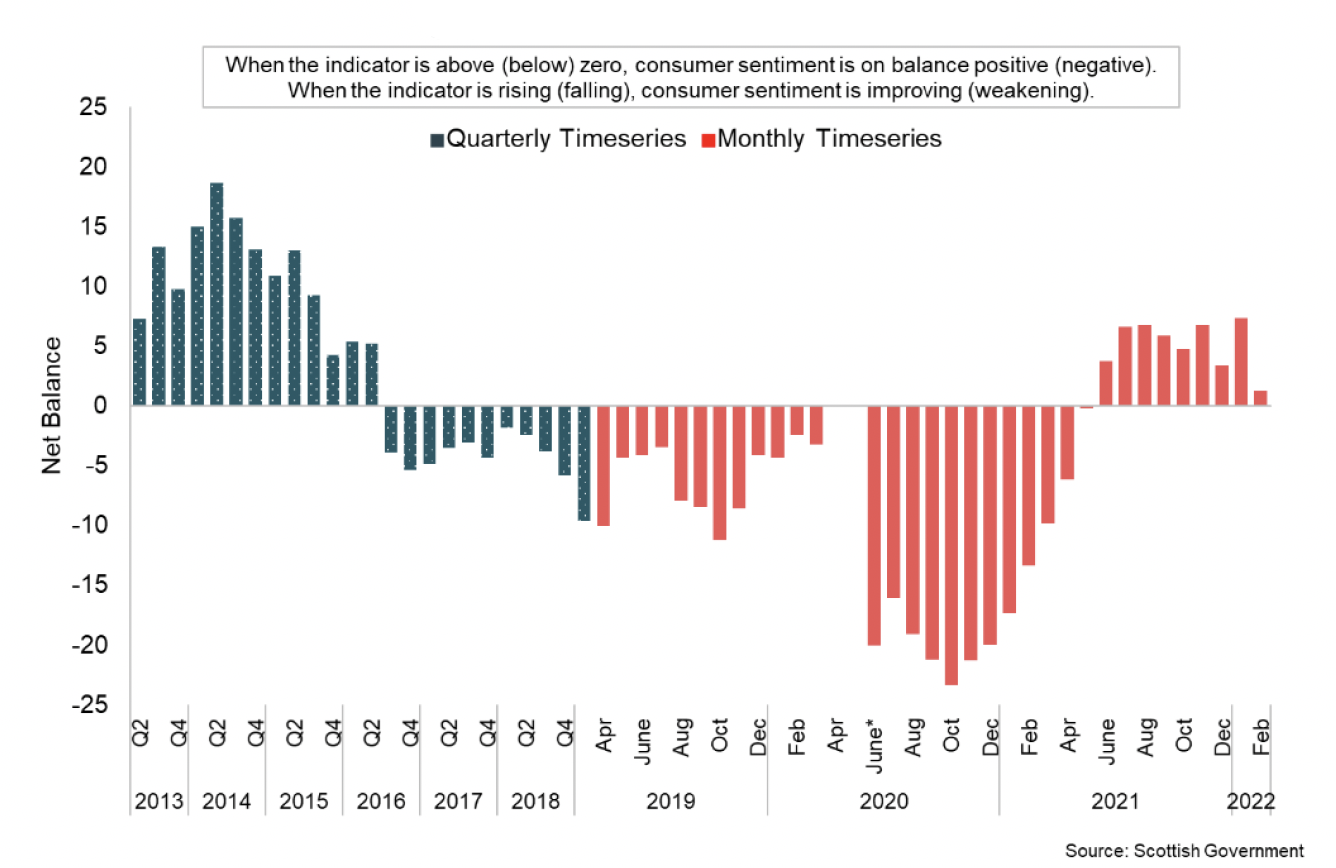
Consumer Sentiment fell sharply in February driven by a fall in household finance and spending indicators.
Consumer sentiment
- Consumer sentiment indicators continue to be highly sensitive to the rapidly changing economic environment and the unprecedented economic challenges that have occurred over the past few years.
- Having risen to its strongest monthly level in January (7.3), the composite indicator fell sharply to 1.3 in February, its lowest level since May 2021. While respondents' views of current economic performance improved over the month, the fall in February was driven by a broad based fall across the household finance and spend indicators and expectations for the economy over the coming year.[25],[26]
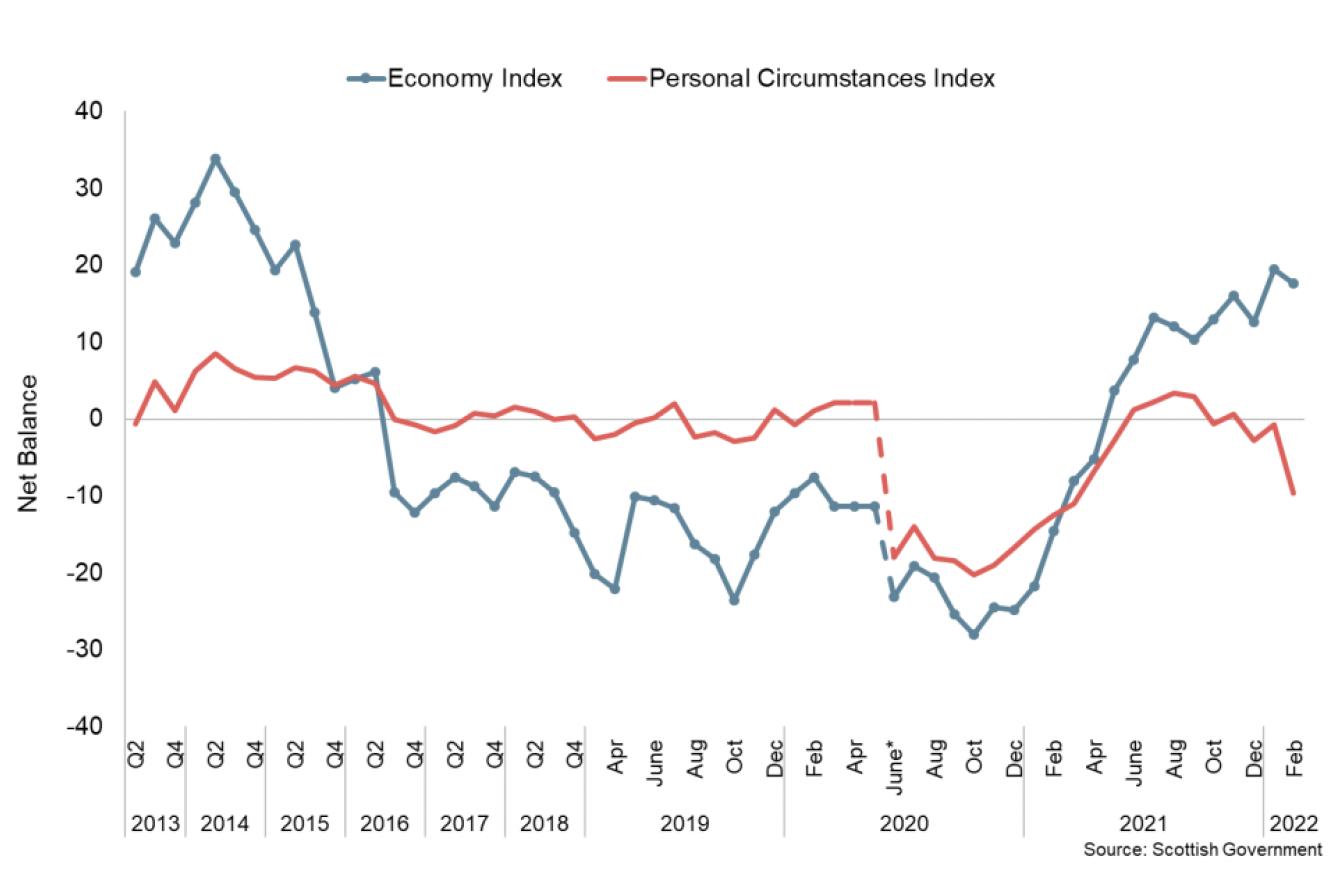
- In terms of the current indicators (comparing to 12 months ago), respondents' view of current economic performance was positive and rose 5.4 points, while views on security of household finances and attitude to spending fell by 3.1 points and 13.0 points respectively, remaining negative overall.
- Expectation indicators for economic performance and security of household finances over the next 12 months fell significantly in February with the indicators falling by 9.1 and 10.5 points respectively. The economy expectations indicator remained positive overall while the household finances indicator returned to negative levels.
- The overall economy index decreased by 1.8 points in February, remaining positive, however the overall personal circumstances index decreased by 8.9 points and remained negative.[27] This potentially reflects a combination of factors that are impacting consumer sentiment at this time with the economy continuing to recover from the pandemic while households are also facing increasing inflationary pressures which are impacting household finances and are likley to influence spending decisions.
Retail Sales
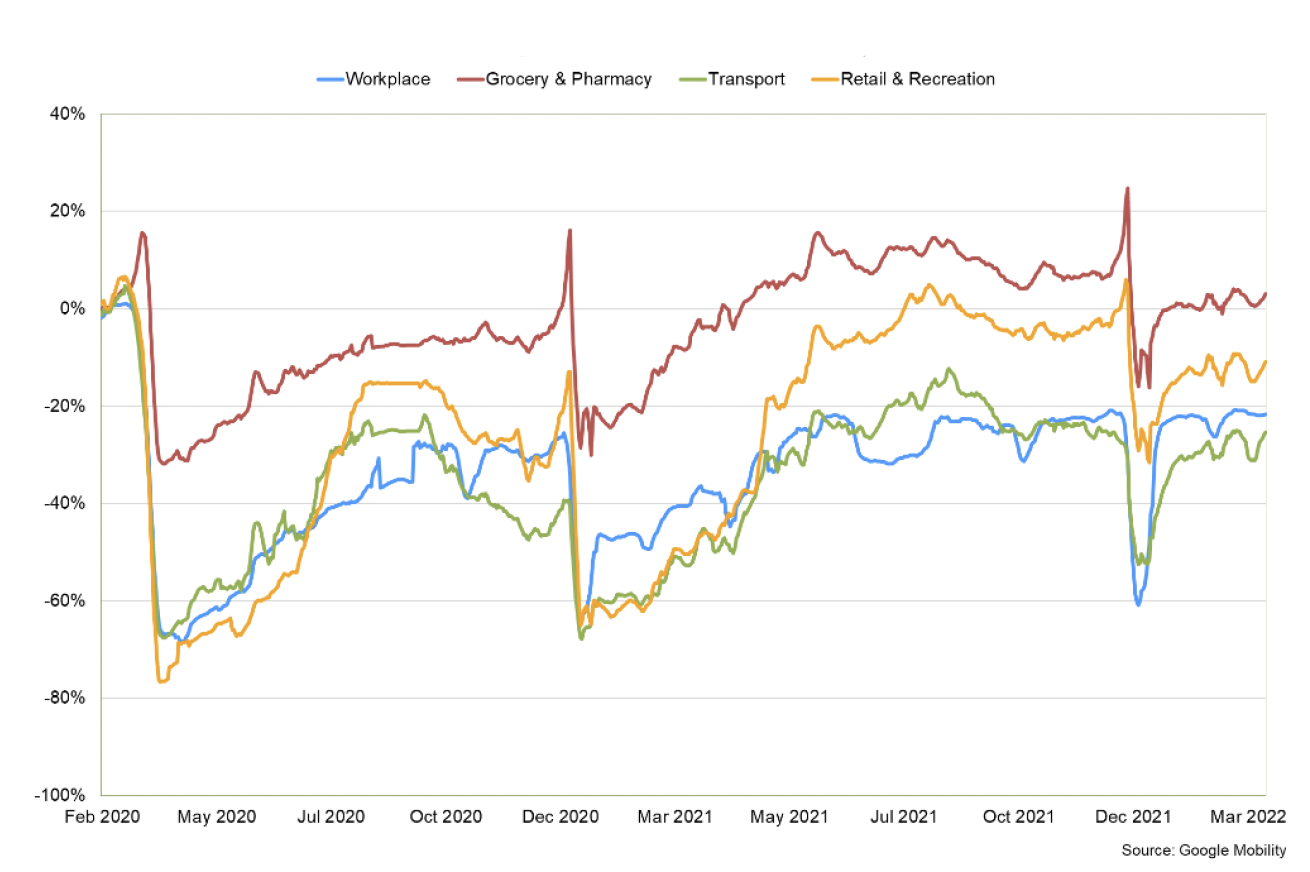
- Google Mobility data indicates that movement around retail and recreation hubs is continuing to gradually recover from the sharp fall in January during the Omicron wave and holiday period.
- Having fallen 30% below pre-pandemic levels in January, movement around retail and recreation hubs has partially recovered in March to around 9% below pre-pandemic levels.
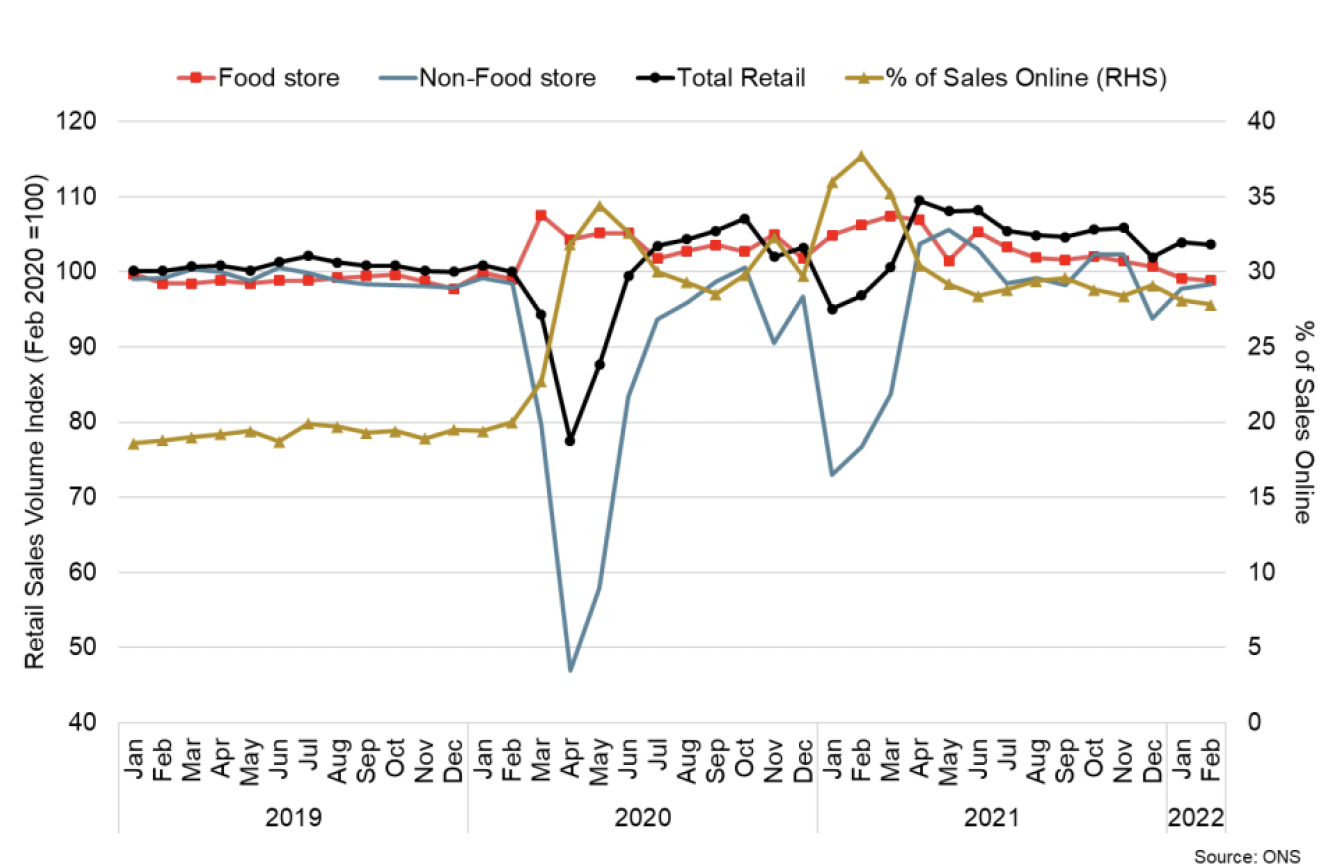
- Retail sales volumes in Great Britain continued to moderate in February 2022, and fell 0.3% over the month following a rebound of 1.9% in January.[28]
- Non-food stores sales rose by 0.6% over the month driven by an increase in clothing (+13.2%) and department stores (+1.3%), potentially driven by more socialising activity as restrictions eased. However, the increases were partly offset by a 7% fall in other non-food store sales including household goods stores which fell by 2.5%.
- Automotive fuel sales rose by 3.6% in February and were above their pre-pandemic level for the first time (+0.9%).
- Overall, retail sales have fallen 5.3% from their peak in April 2021, though remain 3.7% above their pre-pandemic level in February 2020.
- Online retail as a proportion of all retail sales, fell to 27.8% (down from 28.1% in January). This continues the wider downward trend since its peak in February 2021 (37.7%) though remains significantly higher than in February 2020 prior to the pandemic (20%).
Household Savings and Consumer Credit
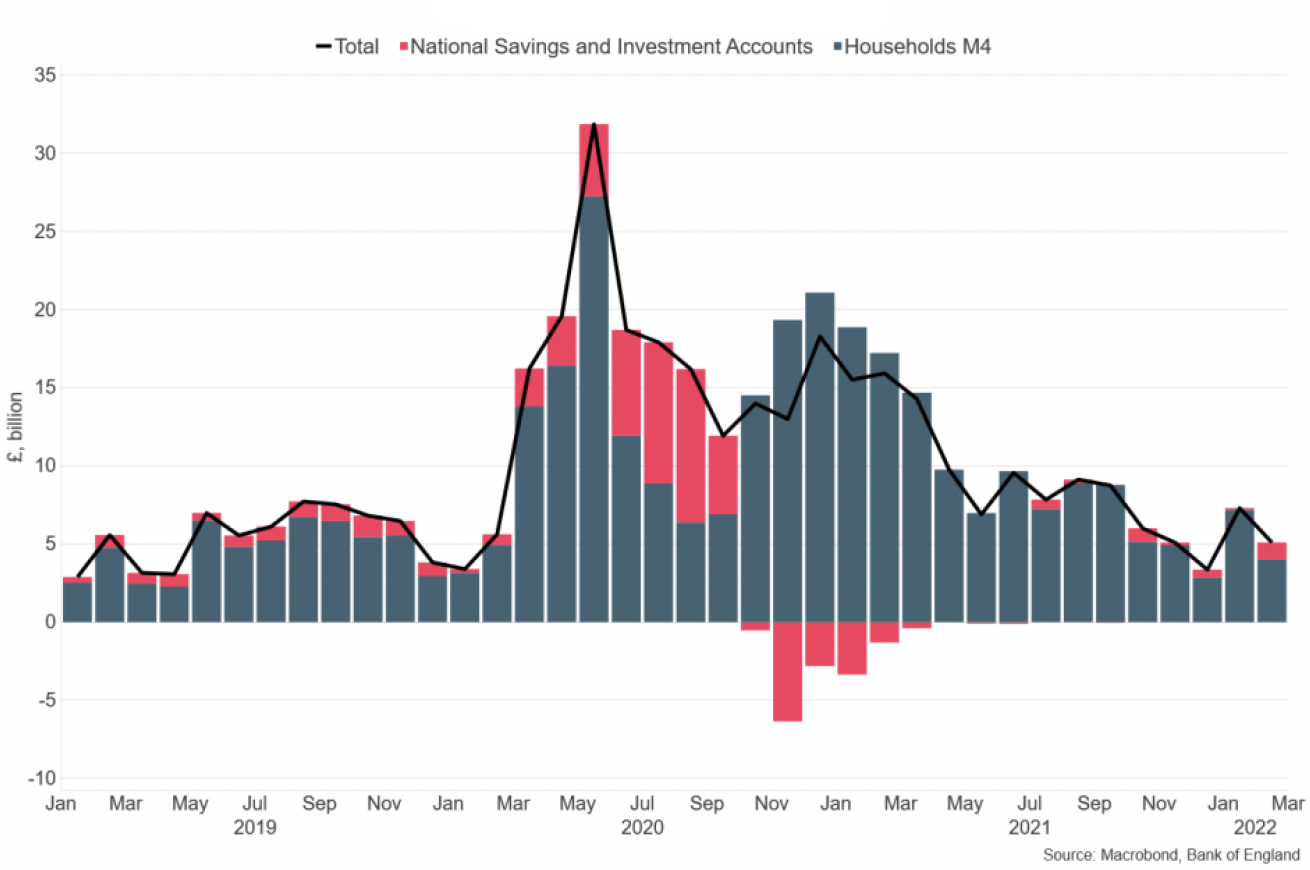
- At an aggregate level, households increased their levels of savings during the pandemic due to a reduction in expenditure coupled with a rise in disposable income through the retention of earnings. This was particularly evident during periods of lockdown in Q2 2020 and Q1 2021 when consumer facing services were largely closed.
- Bank of England data provides insights at an aggregate level of how savings and consumer credit flows have evolved as restrictions have been removed and economic activity has recovered alongside a rise in inflationary pressures.
- In recent months, at an aggregate level, net flows from UK households into deposit-like accounts have returned to a broadly similar position as they were prior to the pandemic. In February, net inflows eased slightly to £5.1 billion, down from £7.3 billion in January and is slightly lower than pre-pandemic flows which averaged £5.5 billion in the year to February 2020.[29]
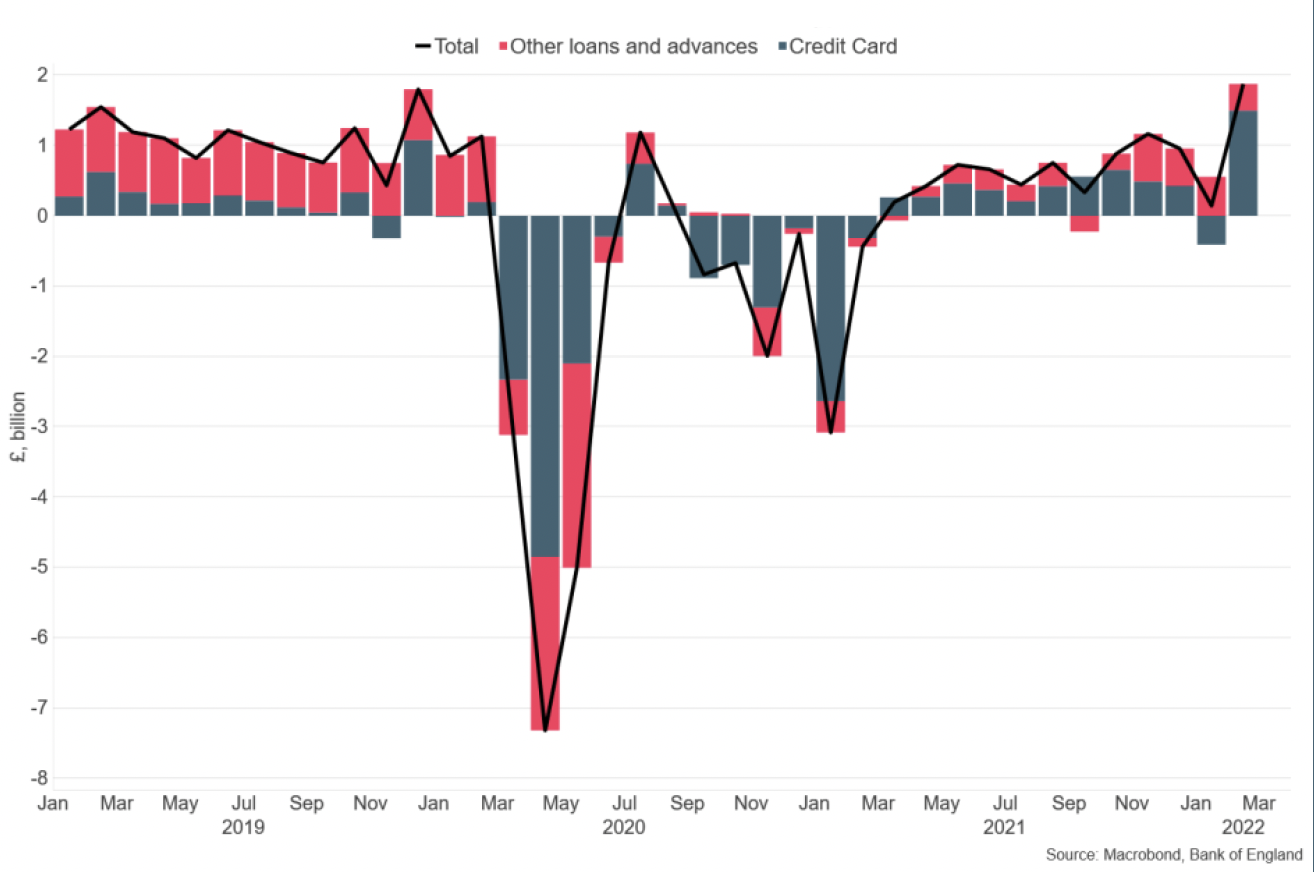
- Alongside this, net consumer credit fell significantly during the pandemic, however started to grow again over the course of 2021. In February, consumers' net borrowing picked up notably to £1.9 billion, its highest monthly level since 2017, reflecting predominantly a sharp rise in credit card borrowing to £1.5 billion while 'other' forms of consumer credit (such as card dealership finance and personal loans) was £0.4 billion over the month.
Inflation
- UK CPI inflation rose to 6.2% in February 2022, up from 5.5% in January and has risen to its highest rate since 1992 when it stood at 7.1%, presenting increased cost of living challenges.[30] Inflation rates have also continued to rise in the US (7.9%) and in the Eurozone (5.9%), in part reflecting rising energy prices over the past year.
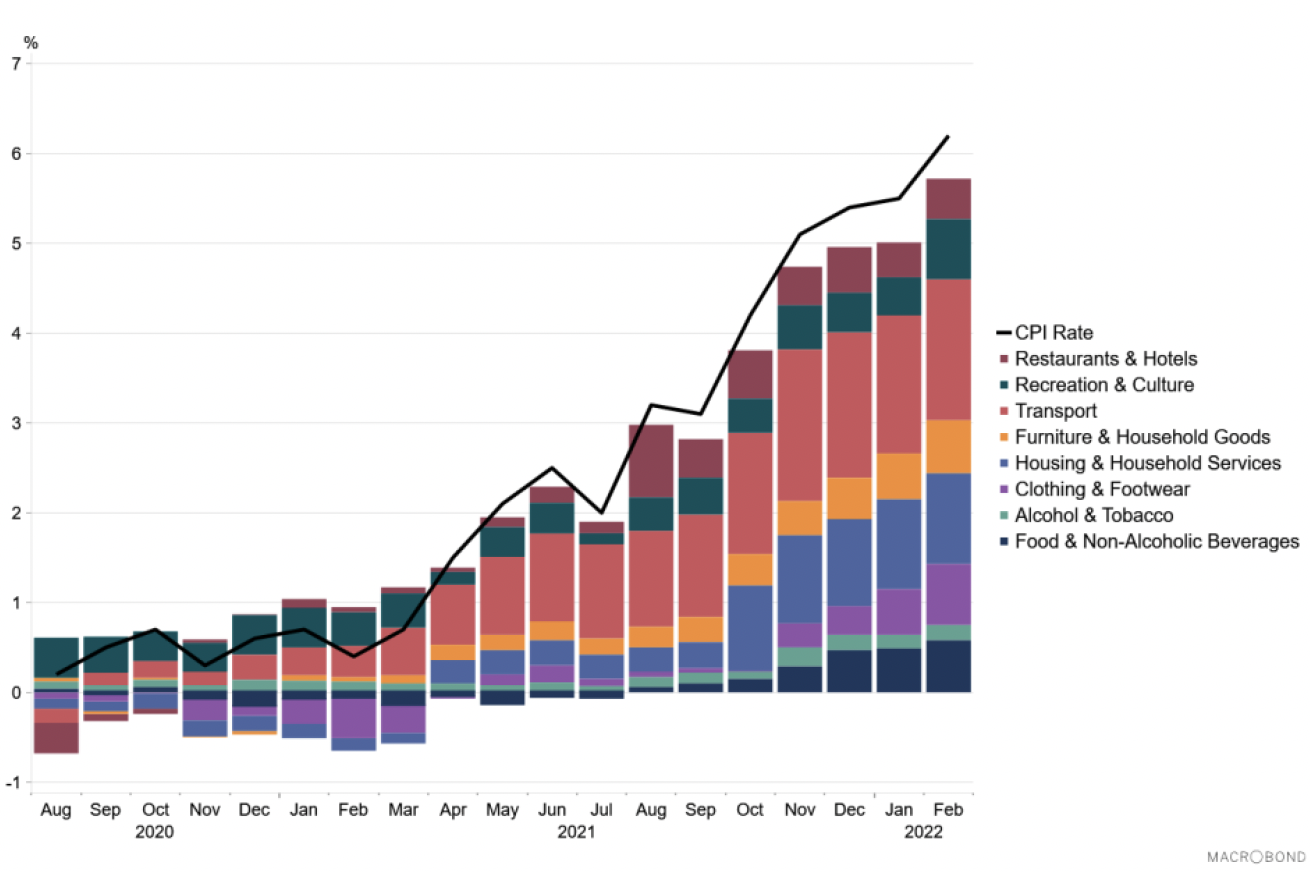
- In February, UK consumer prices rose over the year across almost all goods and services monitored. Most notably there was large increases in electricity and fuel prices (+23%), in transport (+11.5%, driven by second-hand car price increases +30.6%), clothing and footwear (+8.9%) and in furniture (9.1%).
- Further inflationary pressures are expected, exacerbated by the situation in Ukraine and the impact on global commodity prices, with the Bank of England forecasting inflation to rise to around 8% in the first half of 2022 and potentially rise further later in the year, intensifying the cost of living challenges.
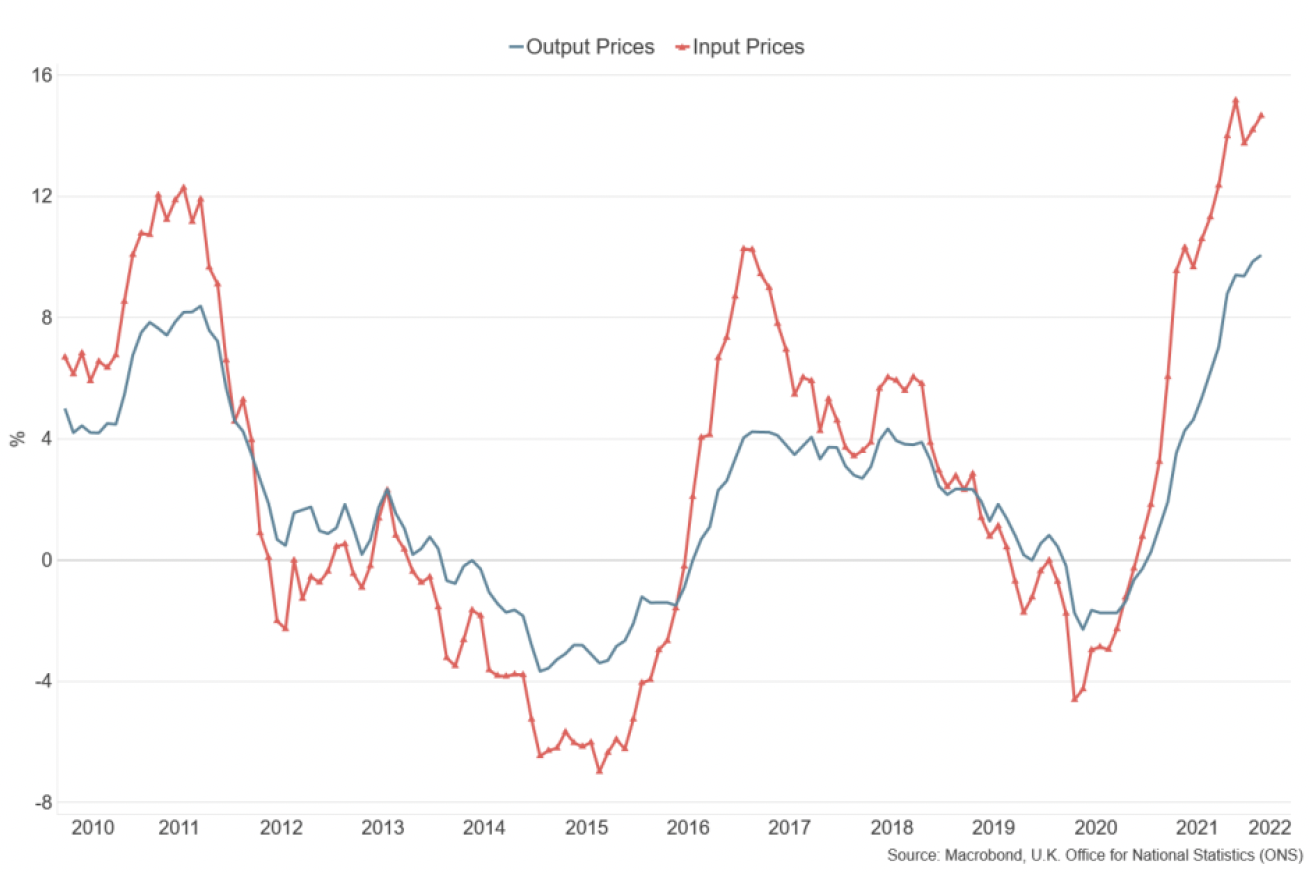
- This is expected to impact through a rise in energy prices and the pass through of higher producer costs to consumers. Producer price inflation (changes in the prices of goods bought and sold by UK manufacturers, including price indices of materials and fuels purchased and factory gate prices) has risen over the past year and remained elevated in February with input price inflation at 14.7% in February (up from 13.6% in January) while output price inflation was 10.1% (up from 9.9% in January).[31]
- In response to the further rise in underlying inflationary pressures for the year ahead, the Bank of England's Monetary Policy Committee (MPC) increased the Bank Rate by 0.25 percentage points to 0.75% in March, having previously raised it by 0.25 percentage points in February 2022.[32]
Contact
Email: OCEABusiness@gov.scot