Publication - Research and analysis
Monthly economic brief: July 2020
The monthly economic brief provides a summary of latest key economic statistics, forecasts and analysis on the Scottish economy.
Labour Market
The impacts of the coronavirus pandemic on Scotland's labour market are only starting to emerge with the Coronavirus Job Retention Scheme supporting jobs and incomes during lockdown.
Coronavirus Jobs Retention Scheme (CJRS) and Self Employment Income Support Scheme[13]
- The CJRS has supported job retention and incomes during the lockdown phase as businesses have been required to close or significantly scale down business operations.
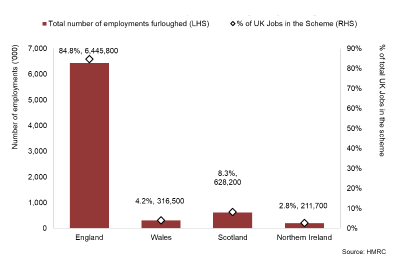
- At the end of May 2020 in Scotland, there were 628,200 jobs furloughed (8.3% of UK jobs in the scheme).
- Scottish Government estimates this is around 27.1% of employees in Scotland as being furloughed, broadly in line with other parts of the UK (England: 27.9%; Wales: 25.6%; NI: 29%).
- Glasgow City (74,400) and Edinburgh City (58,400) were the local authorities in Scotland with the most claims, followed by North Lanarkshire (41,800).
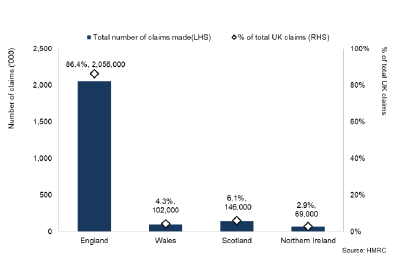
- In terms of self-employed in Scotland, 146,000 (70% of eligible) self- employed individuals made a claim to the Self Employed Income Support Scheme (SEISS) up to the end of May. This was 6.1% of all claims across the UK and potentially reflects the lower level of self employed in Scotland.
- Glasgow (15,500) and Edinburgh (14,200) were the local authorities in Scotland with the most claims to the SEISS.
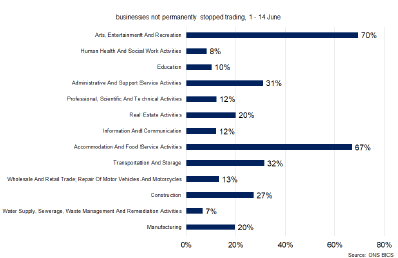
- ONS data[14] show that the CJRS remained an important element of support for businesses in the first half of June, particularly for sectors that remained largely closed. At a UK level, of businesses that had not permanently stopped trading, 23% of their workforce was estimated to be on furlough leave. The arts, entertainment and recreation sector and the accommodation and food services sector had the highest proportions of furloughed workers – 70% and 67% respectively.
Official labour market statistics
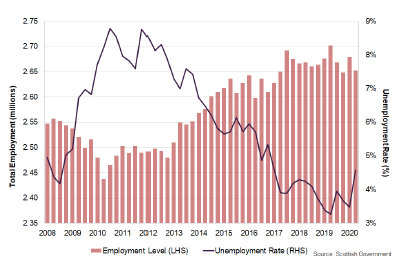
- The latest official labour market statistics for February to April 2020 record furloughed workers as employed, but temporarily away from work. Over the year to February to April 2020 the Labour Force Survey showed:[15]
- The employment level decreased by 50,000 and the employment rate fell by 1.7 percentage points to 74.3% (UK; 76.4%).
- The unemployment level increased by 36,000 and the unemployment rate increased by 1.3 percentage points to 4.6% (UK; 3.9%).
- The economic inactivity (those neither in employment or ILO unemployed) level increased by 22,000 and the inactivity rate increased by 0.6 percentage points to 22.1 (UK; 20.5%).
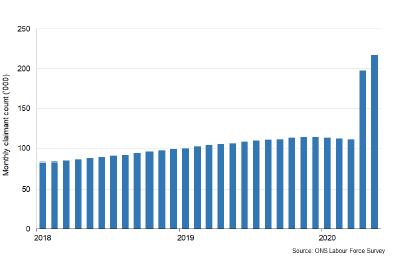
Claimant Count
- Scotland's Claimant Count[16] (the number of claimants of Job Seekers Allowance and Universal Credit 'searching for work' conditionality) has increased sharply since March signalling that despite the support provided by the CJRS, incomes have fallen and unemployment has risen.
- In May, the Claimant Count was 217,600 (a rate of 7.8%), up 20,000 over the month (10%) and over 100,000 since March (95%).
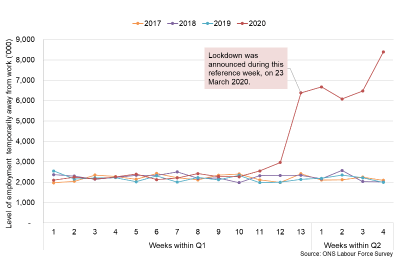
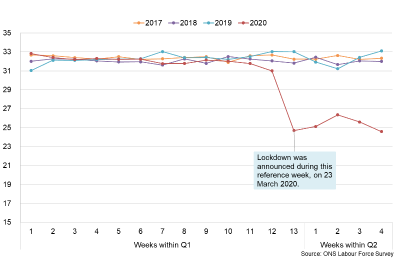
Hours worked
- Weekly ONS Labour Force survey data (published for the UK as a whole) showed a significant drop in hours worked and a sharp increase in the number of people temporarily away from work in the second half of March and throughout April, as lockdown measures were in place.
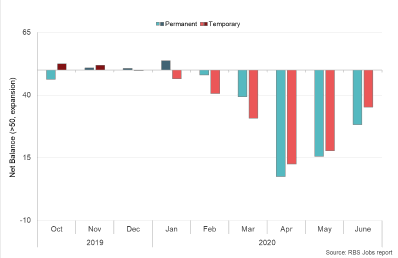
Demand for staff in Scotland
- The RBS Report on Jobs survey for June[17] reported further sharp falls in demand for permanent and temporary staff in Scotland, albeit to a lesser extent than in April and May.
- Staff placements and vacancies continued to fall sharply over the month reflecting that businesses continued to freeze or delay hiring activity.
- Alongside this, candidate availability rose sharply in June suggesting a rise in redundancies, while emerging pay pressures were evident with salaries appointed to new staff falling at their sharpest pace in the survey time series.
Earnings
- The impact of the coronavirus on business activity and Scotland's labour market has started to feed through to a significant slowdown in earnings growth.
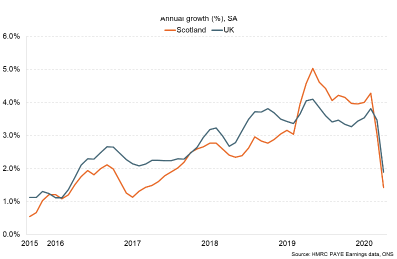
- Pay As You Earn (PAYE) earnings data[18] reported a significant slowdown in nominal median earnings growth in Scotland over the year to April 2020.
- Annual growth in PAYE median pay in Scotland was 1.4% in the year to April 2020 (UK: 1.9%), significantly lower than earnings growth prior to the lockdown measures.
- Prior to the COVID-19 crisis, Scotland saw a pick-up in PAYEearnings growth in 2019 and at the start of 2020, with annual growth in the year to February 2020 at 4.3% (UK: 3.8%). This period of stronger growth followed relatively weaker earnings growth in 2017 and 2018.
Contact
Email: OCEABusiness@gov.scot