Publication - Research and analysis
Monthly economic brief: February 2022
The monthly economic brief provides a summary of latest key economic statistics, forecasts and analysis on the Scottish economy.
Consumption
Following a weakening of sentiment in December amid the onset of Omicron, consumer sentiment picked up again in January.
Consumer sentiment
- Consumer sentiment indicators continue to be highly sensitive to the rapidly moving developments on the pandemic and the unprecedented economic challenges that have occurred during its initial stages and over the course of the recovery to date.
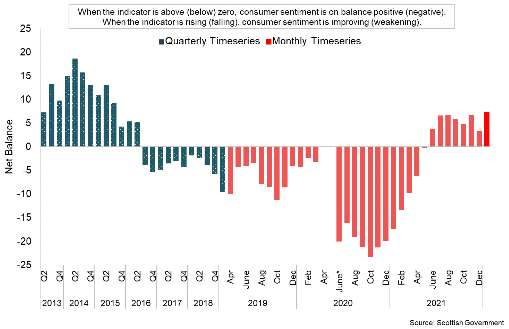
- The Scottish Consumer Sentiment Indicator returned to positive territory in the second half of 2021 having significantly improved from the series low levels of sentiment in the second half of 2020.
- Following a slight weakening in sentiment in the final quarter of 2021, consumer sentiment strengthened over the month in January with the composite indicator rising 3.9 points to 7.3, its highest level in the monthly time series.[20],[21]
- The rise in sentiment in January was driven by a broad based rise across the current and expectations indicators. In terms of the current indicators, respondents views of current economic performance had the largest rise (4.3) points and was positive overall while respondents views on security of household finances and attitude to spending improved over the month, but remained negative overall.
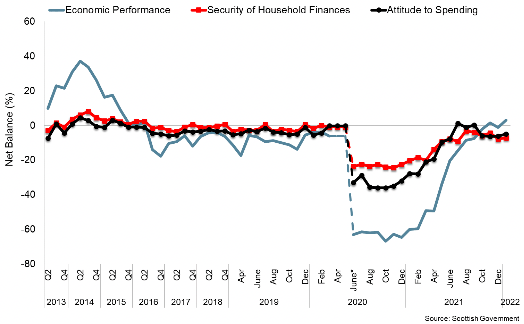
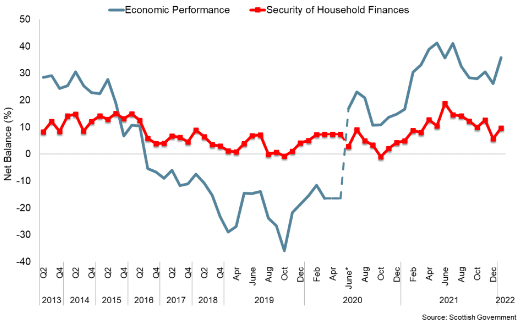
- Expectation indicators for economic performance and security of household finances notably improved in January by 9.6 and 4.0 points respectively and remained positive overall meaning that households on balance feel more positive about future economic performance and household finances over the coming year.
Retail Sales
- In January 2022, retail sales in Great Britain rose by 1.9%, following a fall of 4.0% in December with the overall volume of sales remaining above its pre-pandemic level in February 2020 (3.6%).[22]
- Non-food stores sales rose by 3.5% over the month driven by an increase in home improvement sales volumes, while food store sales fell by 2.3%. Both were below pre-pandemic levels (-1.1% and -0.8% respectively) with food store sales volumes falling below pre-pandemic levels for the first time and continuing its downward trend from the second half of 2021 as consumers diverted spending to wider hospitality, food and leisure services.
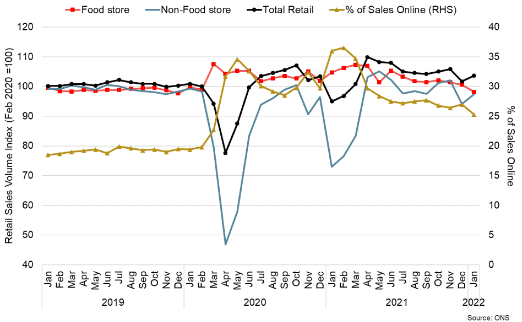
- Online retail sales also fell 4.5% in January and as a proportion of all retail sales, fell to 25.3% (down from 26.6% in December). This was its lowest proportion since March 2020, however remains significantly higher than in February 2020 prior to the pandemic (19.7%).
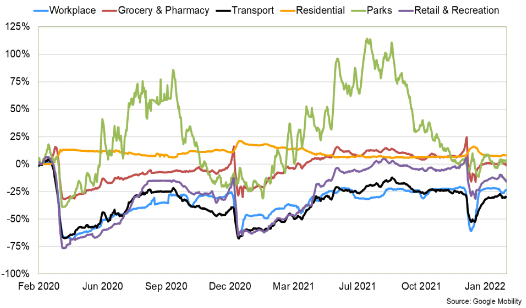
- Google Mobility data indicates that following a rise in visits to retail and recreation hubs in December, visits fell sharply in January 2022 (30% below pre-pandemic levels) reflecting a combination of the holiday period and Omicron. Movement around retail and recreation hubs have partially picked-up, though remain around 15% below pre-pandemic levels in mid-February.
Household Savings and Consumer Credit
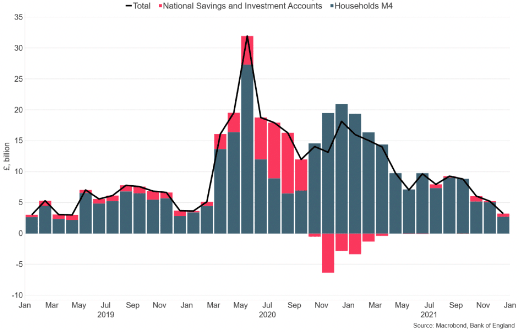
- At an aggregate level, households increased their levels of savings during the pandemic due to a reduction in expenditure coupled with a rise in disposable income through the retention of earnings. This was particularly evident during periods of lockdown in Q2 2020 and Q1 2021 when consumer facing services were largely closed.
- Bank of England data provides insights at an aggregate level of how savings and consumer credit flows have evolved over the year as restrictions have been removed and economic activity recovery has progressed.
- In recent months, at an aggregate level, net flows from UK households into deposit-like accounts has returned to a broadly similar position as they were prior to the pandemic. In December 2021, net inflows were £3.2 billion over the month, significantly lower than the monthly average in the year to November 2021 (£10.6 billion) and was lower than pre-pandemic flows which averaged £5.5 billion in the year to February 2020.[23]
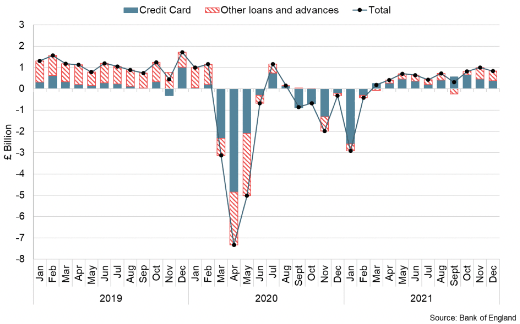
- Alongside this, net consumer credit fell significantly during the pandemic, however started to grow again over the course of 2021. In December, consumers net borrowing was £0.8 billion, reflecting £0.4 billion in credit card debt and £0.4 billion of 'other' forms of consumer credit (such as card dealership finance and personal loans).
- Monthly net borrowing remains lower than in 2019 prior to the pandemic, however the annual growth rate for consumer credit increased to 1.4% in December (up from 0.8% in November).
Inflation
- UK CPI inflation rose to 5.5% in January 2022, up from 5.4% in December and has risen to its highest rate since the 1990s, presenting increased cost of living challenges.[24] Inflation rates have also continued to rise in the US (7.5%) and in the Eurozone (5.1%), in part reflecting rising energy prices over the past year.
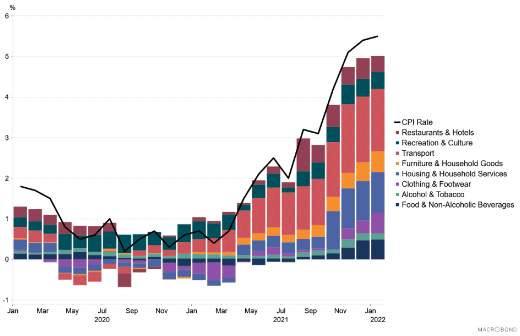
- In the UK, the consumer price index has risen over the year across almost all goods and services monitored, most notably in electricity and fuel prices (+23%), transport (+11%), and household goods (+8%), but also in key categories such as clothing (+6.1%) and food (+4.5%).
- Further price rises are expected, with the Bank of England forecasting inflation to peak at around 7.25% in the first half of 2022 and to remain high at more than 5% over 2022, intensifying the cost of living challenges.
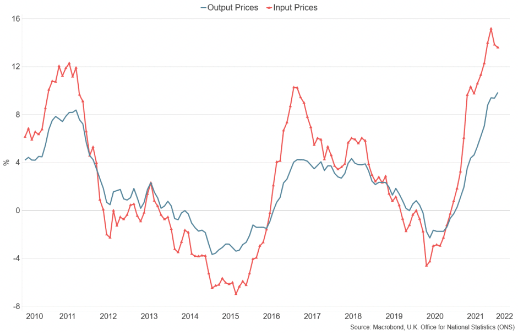
- Alongside the rise in energy prices, wider drivers of inflation such as the feed through from producer price inflation (changes in the prices of goods bought and sold by UK manufacturers, including price indices of materials and fuels purchased and factory gate prices) also remained elevated in January. Input price inflation was 13.6% in January (down from 13.8% in December) while output price inflation was 9.9% (up from 9.3% in December).[25]
- In response to the further rise in underlying inflationary pressures, the Bank of England's Monetary Policy Committee (MPC) increased the Bank Rate by 0.25 percentage points to 0.50% in February, having previously raised it by 0.15 percentage points in December 2021.[26]
Contact
Email: OCEABusiness@gov.scot