Publication - Research and analysis
Monthly economic brief: December 2021
The monthly economic brief provides a summary of latest key economic statistics, forecasts and analysis on the Scottish economy.
Consumption
Consumer sentiment picked-up in November, supported by improved expectations for the economy and personal household finances.
Consumer sentiment
- Consumer sentiment indicators continue to be highly sensitive to the rapidly moving developments on the pandemic and the unprecedented economic impacts that we have seen.
- In November, consumer sentiment in Scotland strengthened, with the Scottish Consumer Sentiment Indicator rising 2.0 points to 6.8, having softened slightly over September and October.[19] Overall consumer sentiment remains positive andnotably improvemed from the series low levels of sentiment in the second half of 2020.[20]
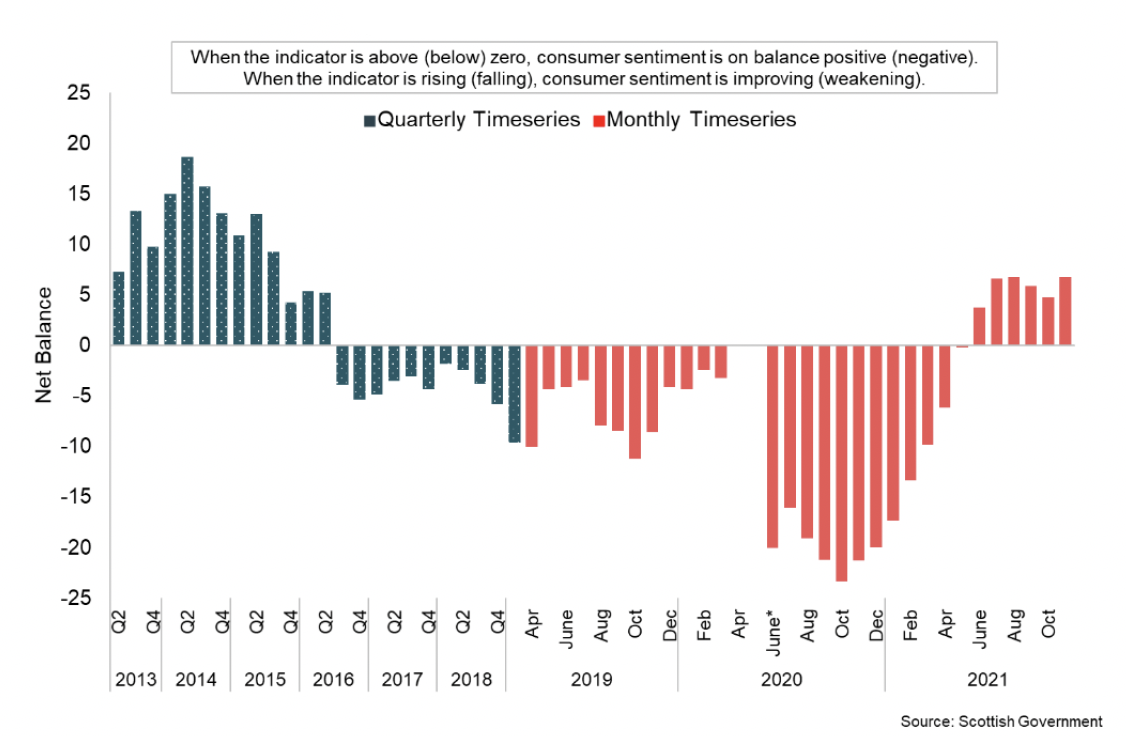
- The latest rise in consumer sentiment reflects an improvement in sentiment regarding current circumstances and expections for the economy and household finances over the coming year.
- In terms of attitude to spending money, sentiment has strengthened significantly over the past year, consistent with the improvements in the economy and household finances indicators. However, latest data for November showed sentiment on this declined for a second month with the indicator remaining in negative territory.
Retail sales
- In November, retail sales in Great Britain rose by 1.4% on October and were 7.2% higher than their pre-pandemic level in February 2020.[21]
- Despite a 0.2% fall in the volume of food store sales in November, volumes were 3.2% higher than their pre-pandemic level. In contrast, non-food sales volumes rose by 2.0%, driven by growth in clothing stores (2.9%) and non-food stores (2.8%) such as computer, toy and jewellery stores, with retailers noting Black Friday and Christmas shopping.
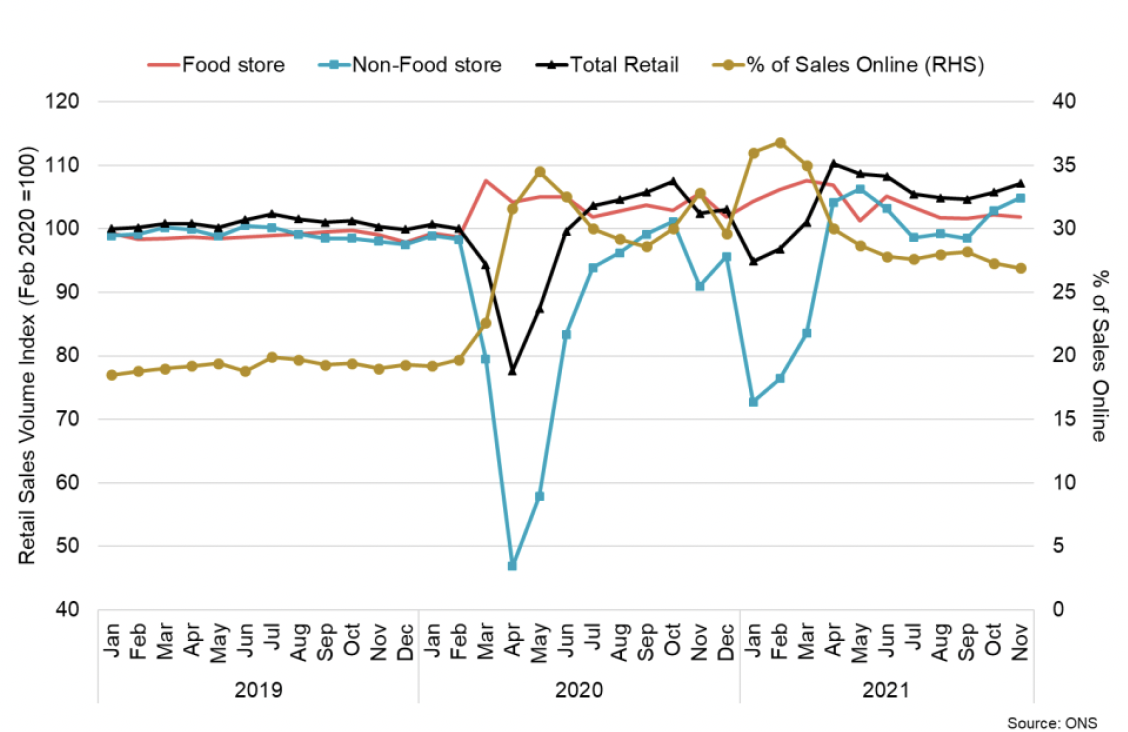
- On a monthly basis, the proportion of retail sales online was 26.9% in November, which has been trending down since its peak in February 2021 (36.8%). While the share of retail sales online has fallen back from earlier in the year, it remains substantially higher than in February 2020 prior to the pandemic (19.7%).
Household Savings and Consumer Credit
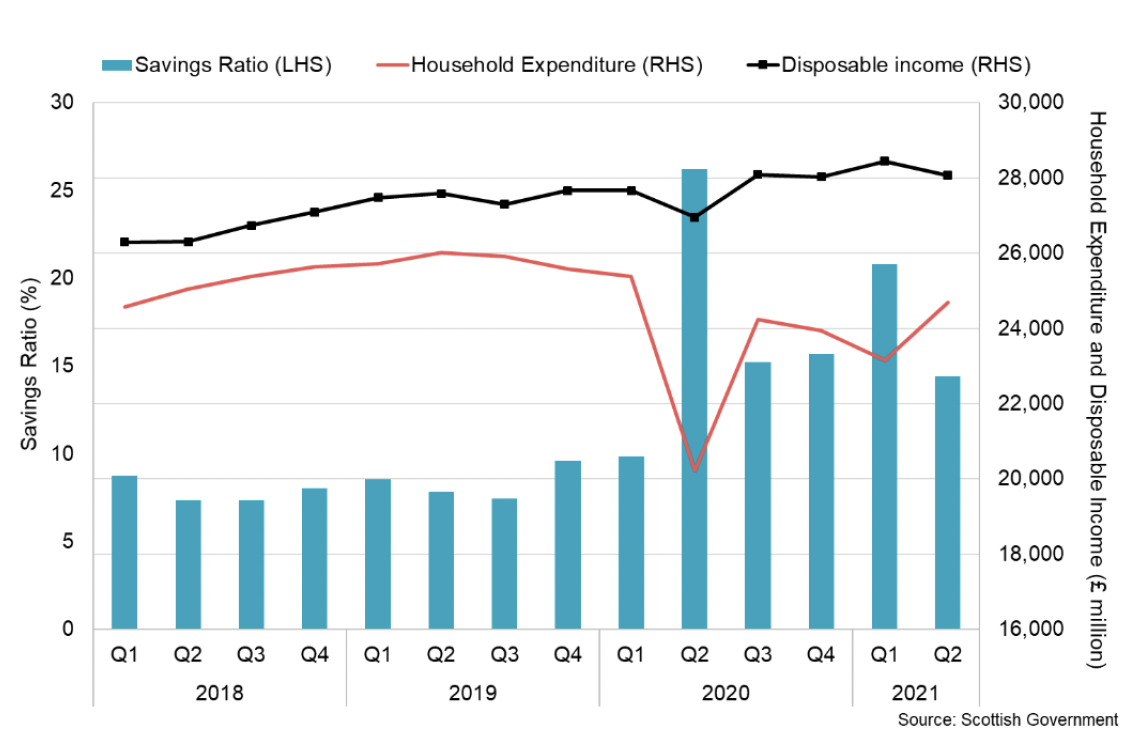
- At an aggregate level, households have increased their levels of savings during the pandemic due to a reduction in expenditure coupled with a rise in disposable income through the retention of earnings. This has been particularly evident during periods of lockdown in Q2 2020 and Q1 2021 when consumer facing services were largely closed.
- Following these peaks (26% and 21% respectively), the savings ratio fell over the second quarter to 14% reflecting, the pick-up in household expenditure as restrictions eased, however savings ratio remained notably higher than pre-pandemic levels (9.6% in Q4 2019).[22]
- More recent Bank of England data for October provide further insight at a UK level of how household savings have changed over the third quarter of the year. At an aggregate level, net flows from UK households into deposit-like accounts was £6.4 billion in October.[23] This is lower than in recent months during which the average monthly net flow into banks and building societies and national savings and investment accounts was £11.9 billion in the year to September 2021. However, the combined October net flow remains slightly higher than pre-pandemic flows when the average net flow in the year to February 2020 was £5.5 billion.

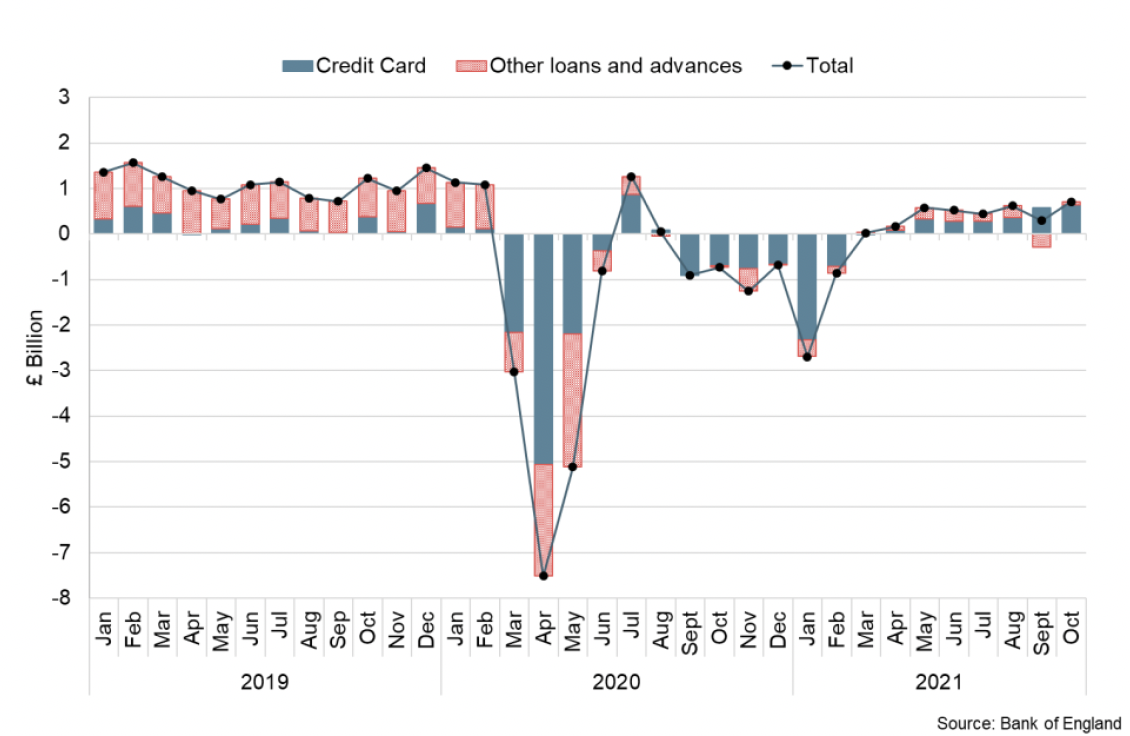
- Alongside this, net consumer credit fell significantly during the pandemic, however started to grow again over the second and third quarters and in October, consumers borrowed £0.7 billion in credit on net. Within this, they borrowed £0.6 billion in credit card debt and £0.1 billion of 'other' forms of consumer credit (such as card dealership finance and personal loans). Net borrowing continues to remain lower than the pre-pandemic monthly average of £1.1 billion in the year to February 2020.
Interest rate and inflation
- UK CPI inflation was 5.1% in November, up from 4.2% in October, while the inflation rate in the US was 6.8% and 4.9% in the Eurozone. The UK CPI rate is the highest since September 2011 when it was 5.2%.
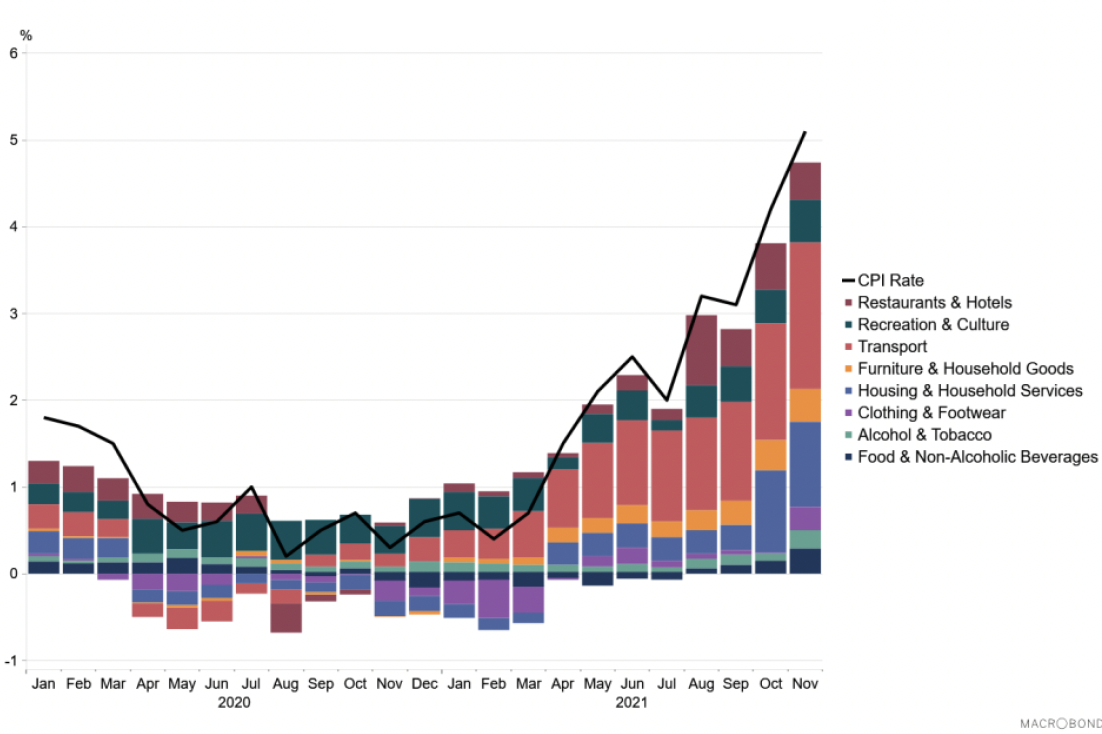
- UK inflation continues to rise, as forecast, in part reflecting the global rise in input cost pressures (raw materials) which are partially being passed through to consumer goods, base effects from price falls earlier in the pandemic (e.g. in energy), and increased business activity and demand.
- The largest contribution to the increase in November came from transport which increased by 25% over the month. Within transport, fuels and lubriants and the purchase of second-hand cars were the largest drivers of increased prices. The ONS reported that the price of petrol rose by 7.2 pence per litre between October and November 2021 and is the largest monthly rise on record (since 1990).[24] The used car market continues to be competitive with the easing of restrictions contibuting to an increased demand and some buyers switching to second-hand cars due to a shortage of new cars caused by supplychain bottlenecks.
- The other largest upward contributions to the 12-month rate came from clothing and footwear, food and non-alcoholic beverages, and alcoholic beverages and tobacco.
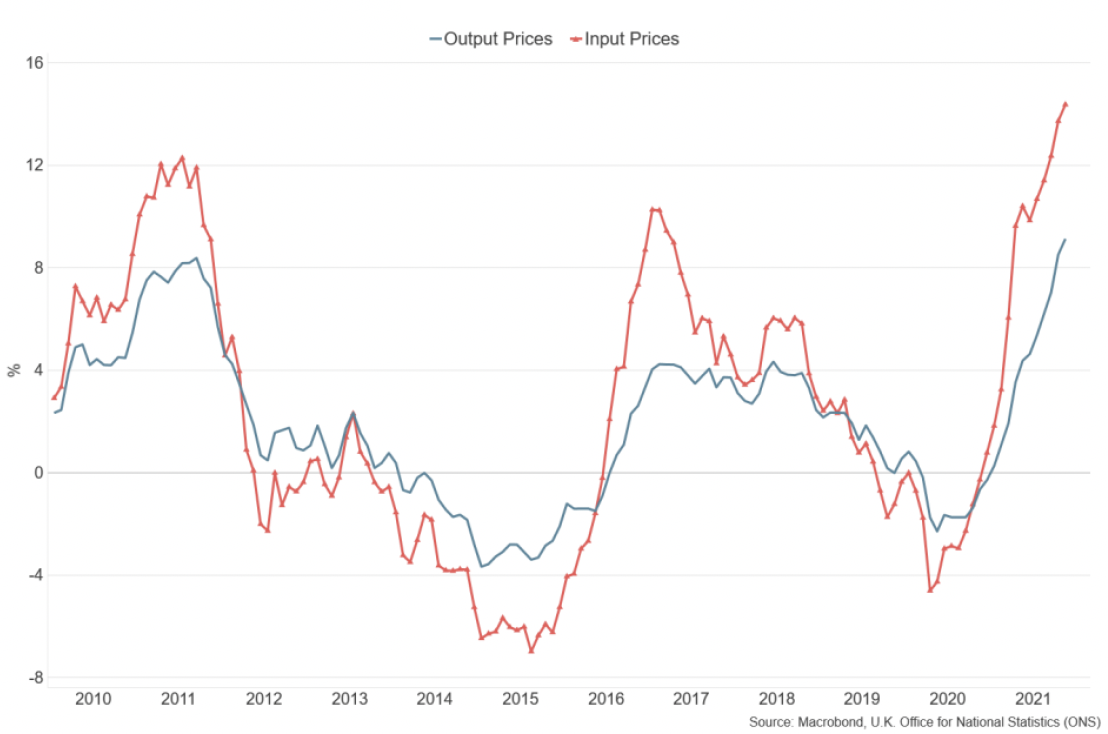
- In terms of producer price inflation, input price inflation was 14.3% in November while output price inflation was 9.1%; both having increased compared to October.[25]
- In response to the further rise in underlying inflationary pressures, at their December meeting, the Bank of England's Monetary Policy Committee (MPC) increased the Bank Rate by 0.15 percentage points to 0.25%, with no change to the current programme of Quantitative easing.[26] The MPC noted that inflation in advanced economies has risen by more than expected in their November Monetary Policy Report and there are some signs of greater persistence in domestic cost and price pressures. In terms of the potential impact of Omicron, the MPC consider that it presents downside risks to economic activity in the short term, however, the medium term impacts on inflationary pressures remain unclear. The MPC expect CPI inflation to remain around 5% before peaking at 6% in April 2022.
Contact
Email: OCEABusiness@gov.scot