Minimum Income Guarantee - modelling of social security options
A paper modelling the social security options of a Minimum Income Guarantee (MIG) developed by the independent Expert Group.
Results
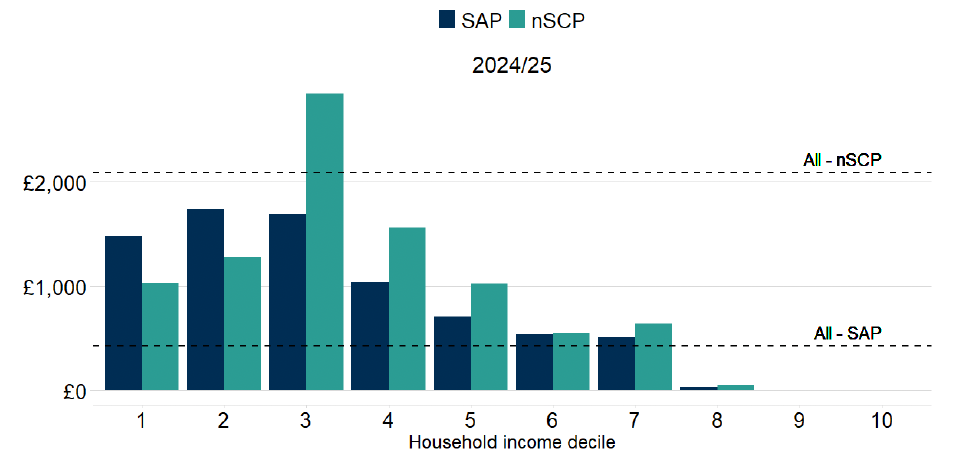
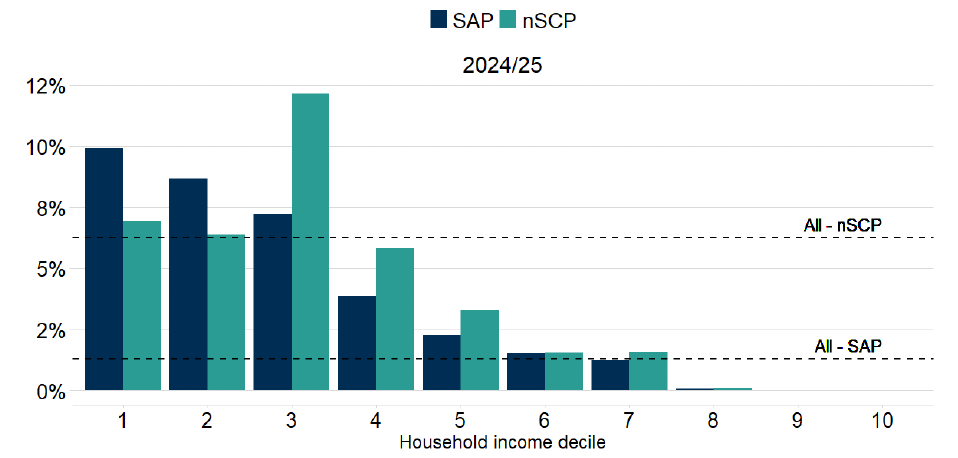
Table 2 sets out the headline results for each option. In addition to the cost, the table shows the estimated percentage-point impact on various measures of poverty, for all people and for children. Meanwhile Figures 1-3 show the number of people who benefit from each policy by household income decile (with all people in affected households included) as well as the impact of each policy on average household income by decile in pound and percentage terms. Deciles represent equally-sized groups of the population ordered by net equivalised household income after housing costs.
The first observation is that nSCP is over 50% more expensive as SAP. Accordingly, it generally has larger impacts on poverty, and unsurprisingly this difference is particularly pronounced when it comes to children. However, the difference in impact is concentrated in the less stringent measures of poverty (relative poverty and low income) and is less apparent in measures that set the poverty line further down the income distribution (absolute poverty and deep poverty). Indeed, SAP would lift more people out of absolute and deep poverty overall. The figures similarly show the impacts of nSCP are greatest in the third decile rather than among households further down the income distribution, whereas the impacts of SAP are more progressively distributed.
These results largely reflect the effect of the nSCP taper in extending the policy further up the earnings distribution than SAP, such that the main beneficiaries are those who currently earn too much to be eligible for SCP but are within range of the taper. In many cases, that is, the difference between receiving zero SCP and positive nSCP (for those previously ineligible for SCP) is greater than the difference between receiving positive SCP and positive nSCP (for those already eligible for SCP). Note however that the maximum value of the award interacts with the taper to produce this effect, since all else equal a higher maximum requires more earnings before it tapers to zero.
| All people | SAP | nSCP |
|---|---|---|
| Relative poverty | -170,000 (-3 ppts) | -190,000 (-4 ppts) |
| Absolute poverty | -160,000 (-3 ppts) | -100,000 (-2 ppts) |
| Deep poverty | -140,000 (-3 ppts) | -90,000 (-2 ppts) |
| Low income | -280,000 (-5 ppts) | -390,000 (-7 ppts) |
| Relative poverty among unpaid carers | -10,000 (-5 ppts) | … |
| Children | SCP | nSCP |
| Relative poverty | -40,000 (-4 ppts) | -110,000 (-11 ppts) |
| Absolute poverty | -40,000 (-4 ppts) | -50,000 (-5 ppts) |
| Deep poverty | -40,000 (-4 ppts) | -50,000 (-5 ppts) |
| Low income | -90,000 (-9 ppts) | -220,000 (-22 ppts) |
| Relative poverty among priority groups | -30,000 (-5 ppts) | -100,000 (-15 ppts) |
| Annual cost | £1,957m | £3,183m |
Source: SG analysis using UKMOD
Notes: rounded to nearest 10,000. ‘..’ indicates that figure is too small to disclose. Unpaid carers defined as those performing at least 20 hours of unpaid care per week. Relative poverty is defined as having household income less than 60% of the contemporaneous UK median. Absolute poverty is defined as having household income less than 60% of the 2010-11 UK median, uprated by inflation. Deep poverty is defined as having household income less than 50% of the UK median. Low income is defined as having household income less than 70% of the UK median. In all cases, income is defined as net equivalised household income. Assumes full benefit take-up. Poverty line is allowed to vary when the policy is introduced. The priority groups are: lone-parent households; a household where someone is disabled; households with three or more children; minority ethnic households; households with a child under one year old; and households where the mother is under 25 years of age. Figures not comparable to official poverty statistics.

Source: SG analysis using UKMOD
Source: SG analysis using UKMOD
Source: SG analysis using UKMOD
Contact
Email: MIGsecretariat@gov.scot