Innovation data baseline: final report
Independent consultant EKOS were commissioned to undertake a review of the methods for measuring the impacts of investments in innovation. The study is part of a wider programme of work - which primarily focuses on the innovation activities of the Enterprise and Skills agencies in Scotland.
3. Mapping Investment and Support
3.1 Introduction
Using the conceptual model presented in Figure 2.1, we can begin to map Scotland's innovation support against this framework. This is shown in Figure 3.1, via a series of examples and have also populated this framework with measures that could be used under each heading and within the overall theory of change (Figure 3.2).
While specific support has been allocated against one of the five categories, a case could be made for the inclusion of some elsewhere. This underlines the overlapping nature of the categories. It should also be noted that spend in other areas (not captured or considered specifically innovation activity) may also impact on the success of innovation projects (e.g. export promotion leading to sales of new products).
We have also maintained the Scottish Government categorisation of support activities into three headings:
Innovation and R&D Finance (agency spend of £331.3m);
Organisation, Capacity Building and Peer Support (£3.5m); and
Infrastructure (£14.2m).
Finally, the mapping also includes an indicative estimate of the total agency spend against each of the five categories.
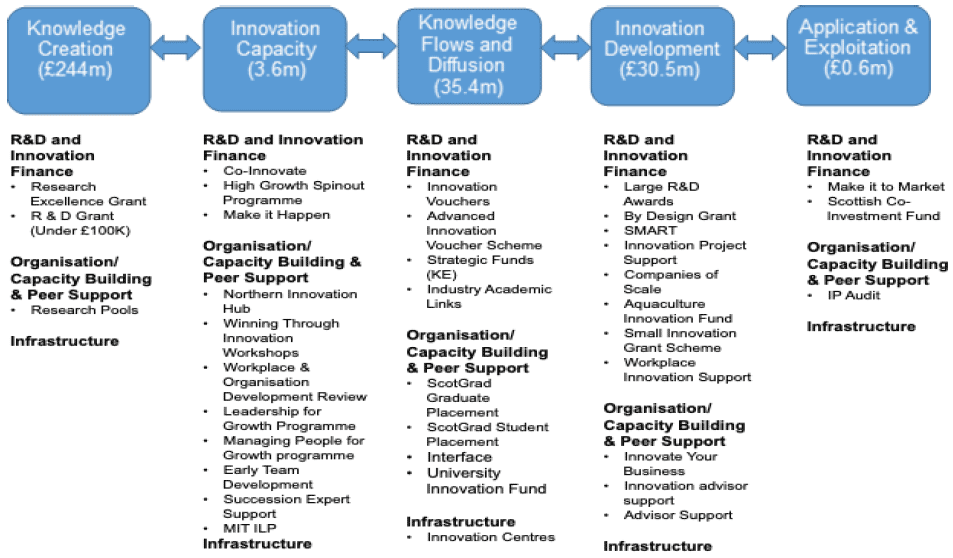
Figure description:
This diagram maps the current landscape of innovation support, showcasing what support programs are in place for each stage of the innovation process. There is also a note of total spend in each stage of the innovation process; Knowledge Creation £244m, Innovation Capacity £3.6m, Knowledge Flows and Diffusion £35.4m, Innovation Development £30.5m and Application & Exploitation £0.6m.
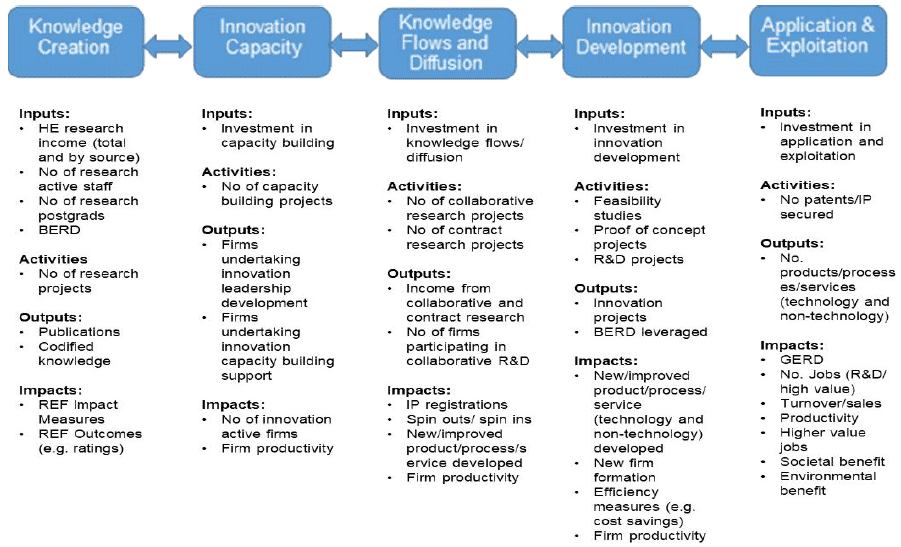
Figure description:
Show the headline indicators for Inputs, Activities, Outputs and Impacts for each of the 5 stages of innovation.
Developing this framework in more detail, Tables 3.1 to 3.5, over, present a set of measures that can be used to assess progress in each of the five domains of innovation support activity defined in the model. A number of key points can be taken from this summary:
- while there are available sources of data against most of the measures, some are high level (macro) and do not relate directly to the investment and support provided by the agencies;
- some of the data sources provide only a sample of data (e.g. REF) and others rely on forecast rather than actual figures;
- there are some gaps, most notably in the measurement of productivity impacts arising from innovation support; and
- given that failures would be expected across the model (as discussed above) there seems to be no source of data to capture the extent of these or how the 'spillover' knowledge gained from failure may inform/support future activity.
Sources |
Details |
|
|---|---|---|
Input Measures |
||
HE Research Income:
|
HE BCI Survey (HESA - under review) SFC KE Metrics (under review) TRAC data HE Income and Expenditure (HESA) |
Annual survey of HEIs Annual Data on income and expenditure against full economic costs provided by HEIs |
Number of research active staff in HEIs |
Research Excellence Framework (REF) HE Staff (HESA) |
Every seven years sample of research active staff in each HEI Annual survey of HEIs |
Number of research students (postgraduate) |
HESA |
Annual survey of HEIs |
Business Enterprise on Research and Development (BERD) |
Scottish Government via ONS |
Annual survey of businesses |
Gross Expenditure on Research and Development (GERD) |
Scottish Government via ONS |
|
Activity Measures |
||
Investment by HEIs in research capacity/ infrastructure |
n/a |
n/a |
Number of HE research projects |
Research Excellence Framework (REF) |
Every seven years Sample of research activities in each HEI |
Quality of HE research |
Research Excellence Framework (REF) |
Every seven years Provides ratings by Unit of Assessment (discipline) |
Output Measures[20] |
||
No of academic research publications (including peer reviewed journals, books and book chapters and conference presentations) |
Research Excellence Framework (REF) |
Every seven years Details samples by Unit of Assessment (discipline) |
Impact Measures |
||
HE Research Quality Ratings |
Research Excellence Framework (REF) |
Every seven years Ratings by Unit of Assessment (discipline) |
HE Research Impacts |
Research Excellence Framework (REF) |
Every seven years Provides case studies and some limited data (eg no of spin out companies) by Unit of Assessment (discipline) |
Sources |
Details |
|
|---|---|---|
Input Measures |
||
Investment in innovation capacity building activities |
Agency data on project expenditure |
Available but not routinely reported in this way |
Activity Measures |
||
Number of innovation capacity building programmes |
Agency data on project activities |
Available but not routinely reported in this way |
Output Measures |
||
No of firms participating in innovation capacity building programmes |
Agency data on programmes |
Ongoing |
No of firms participating in leadership development programmes |
Agency data on programmes |
Ongoing |
Impact Measures |
||
No of new innovation active firms |
EU Community Innovation Survey (economy-wide and not for specific support programmes) HIE innovation ladder SE programme monitoring data |
Bi-annual Ongoing Ongoing |
Increase in (firm) productivity |
Not currently collected |
n/a |
Sources |
Details |
|
|---|---|---|
Input Measures |
||
Investment in knowledge flows/ diffusion activities/ projects |
Agency data on project expenditure |
Available but not routinely reported in this way |
Investment in collaborative R&D (companies) |
Agency and project data may be available through ongoing monitoring |
Data likely to be patchy |
Activity Measures |
||
No of HE/ Industry collaborative projects |
Agency and project data collected through ongoing monitoring |
Ongoing |
No of business to business collaborative projects |
Agency and project data collected through ongoing monitoring |
Ongoing |
Output Measures |
||
No of firms involved in collaborative R&D/ innovation projects |
Agency and project data collected through ongoing monitoring |
Ongoing |
No of HEIs involved in HE/ industry collaborative projects |
Agency and project data collected through ongoing monitoring |
Ongoing |
HE income from collaborative and contract research |
HE BCI Survey (HESA - under review) SFC KE Metrics (under review) |
Annual survey of HEIs |
IP registrations (patents, disclosures, licences) |
HE BCI Survey (HESA - under review) |
Annual survey of HEIs |
No of firms licensing technologies from HEIs |
n/a |
n/a |
No of new products/ processes/ services developed |
Agency and project data collected through ongoing monitoring |
Ongoing |
Impact Measures |
||
R&D jobs created/ safeguarded |
Agency and project data collected through ongoing monitoring |
Ongoing |
No of academic spin-outs |
HE BCI Survey (HESA - under review) |
Annual survey of HEIs |
Sales from new products/ processes/ services developed |
Some agency and project data collected through ongoing monitoring |
Ongoing but largely forecast data |
Increase in (firm) productivity |
Not currently collected |
n/a |
Sources |
Details |
|
|---|---|---|
Input Measures |
||
Investment in innovation development projects |
Agency data on project expenditure |
Available but not routinely reported in this way |
Leveraged industry investment in innovation projects |
Agency monitoring data |
Available |
Activity Measures |
||
No of innovation projects:
|
Agency monitoring data |
Available |
No of business to business collaborative projects |
Agency and project data collected through ongoing monitoring |
Ongoing |
Output Measures |
||
No of new products/ processes/ services developed |
Agency and project data collected through ongoing monitoring |
Ongoing |
IP registrations (patents, disclosures, licences) |
HE BCI Survey (HESA - under review) |
Annual survey of HEIs |
Follow on investment in R&D (BERD) |
Agency and project data collected through ongoing monitoring |
Ongoing |
Impact Measures |
||
R&D jobs created/ safeguarded |
Agency and project data collected through ongoing monitoring |
Ongoing (some forecast data) |
R&D FDI |
Agency data |
Ad-hoc |
Sales from new products/ processes/ services developed |
Some agency and project data collected through ongoing monitoring |
Ongoing but largely forecast data |
Increase in (firm) productivity |
Not currently collected |
n/a |
Sources |
Details |
|
|---|---|---|
Input Measures |
||
Investment in application and exploitation (e.g. marketing new product, export promotion, IP protection etc.) |
Agency and project data collected through ongoing monitoring |
Ongoing |
Activity Measures |
||
No of IP Audits |
Agency and project data collected through ongoing monitoring |
Ongoing |
No of projects taking innovations to market |
n/a |
n/a |
Output Measures |
||
No of firms taking new products/ processes/ services to market |
Agency and project data collected through ongoing monitoring |
Ongoing |
No of new products/ processes/ services launched on the market |
Agency and project data collected through ongoing monitoring |
Ongoing |
IP registrations (patents, disclosures, licences) |
HE BCI Survey (HESA - under review) |
Annual survey of HEIs |
Impact Measures |
||
R&D jobs created/ safeguarded |
Agency and project data collected through ongoing monitoring |
Ongoing |
Sales from new products/ processes/ services developed |
Agency and project data collected through ongoing monitoring |
Ongoing but largely forecast data |
Increase in (firm) productivity |
Not currently collected |
n/a |