Coronavirus (COVID-19): impact on wellbeing - research
This report contains the findings from a telephone survey commissioned by Scottish Government to better understand the impact of the COVID-19 pandemic on people in Scotland.
Chapter 2. Happiness, anxiety, loneliness and worries
Respondents were asked a series of questions about their anxiety and happiness levels and how these compared to before the pandemic, as well as whether they had experienced loneliness and what they were worried or concerned about.
Happiness level 'yesterday'
Respondents were asked how happy they felt 'yesterday' on a scale of 0 to 10, where 0 is 'not at all happy' and 10 is 'completely happy'. As shown in Figure 6, just under half of respondents gave a score of 7 or 8 (21% and 23% respectively), which is considered a score of 'high' happiness. Scores of 9 and 10 were each reported by 8% of respondents. At the other end of the scale, 3% gave a score of 0, whilst 2% gave a score of 2, 4% a score of 3 and 6% a score of 4, all of which are considered 'low' happiness. The mean score overall was 6.61.
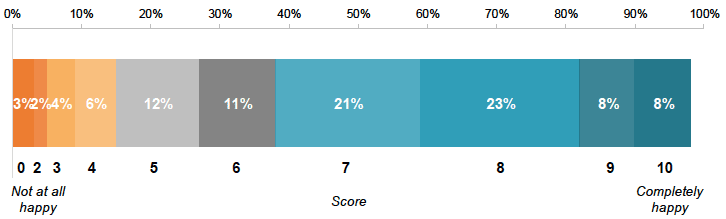
Base: All (1000)
Figure 6 Description
This horizontal bar chart shows the proportions of respondents who answered with a score of between 0 to 10 on a scale when 0 is ‘not happy at all’ and 10 is ‘completely happy’. It shows that the most common score given was 8 (23%), closely followed by a score of 7 (21%).
As shown in Table 2, although most respondents reported feeling happy, the proportion who gave a 'very high' score (9-10) was lower than in the 2018/19 ONS Annual Population Survey.[4] Similarly, a higher proportion reported feeling low and medium happiness, compared with the ONS benchmark.[5]
| Happiness score | Survey responses | ONS benchmark |
|---|---|---|
| Low 0-4 | 15% | 9% |
| Medium 5-6 | 23% | 16% |
| High 7-8 | 45% | 41% |
| Very high 9-10 | 16% | 35% |
Happiness level yesterday
Respondents were also asked how happy they felt yesterday compared to a typical day before the Coronavirus pandemic. As shown in Figure 7, a substantial minority (44%) of respondents reported feeling 'a little' or 'a lot' less happy than on a typical day previously. However, over one in ten (12%) said they felt happier, while 43% said they felt 'about the same'.
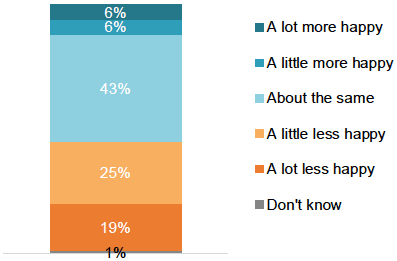
Base: All (1000)
Figure 7 Description
This bar chart shows the proportions of respondents who rated their happiness levels now compared to before the pandemic, specifically, whether they indicated they were ‘a lot more happy’, ‘a little more happy’, ‘about the same’, ‘a little less happy’, ‘a lot less happy’ or ‘don’t know’. It shows that the most common answer was ‘about the same’, for 43% of respondents, followed by ‘a little less happy’, for 25% of respondents.
Subgroup differences - happiness yesterday and before the pandemic
Women were more likely to report not being happy at all 'yesterday' (4%) than men (1%). The mean happiness score was also higher for men (6.91) than for women (6.35). Similarly, women were more likely to report being 'a lot less happy' (22%) compared to a typical day before the Coronavirus pandemic than men (15%), while men were more likely than women to say 'about the same' (48% compared with 39%).
There were also differences by age, with older age groups more likely to be happy than younger groups. In particular, those aged 70+ were more likely to report a score of 10 ('completely happy') (17%) than those aged 16-24 (4%), 25-34 (7%), 35-54 (5%) and 55-69 (10%). The mean happiness score was also higher for those aged 70+ (7.15) than those aged 16-24 (6.42), 25-34 (6.52) and 35-54 (6.3).
However, while older age groups were more likely to be happy 'yesterday', younger age groups were more likely to report being happier than on a typical day before the Coronavirus pandemic. In particular, those aged 16-24 and 35-54 were more likely to report being more happy compared to previously (both 15%) than those aged 70+ (6%). Those aged 35-54 were more likely to say a lot less happy (25%) than those aged 55-69 (18%) and 70+ (14%).
Those in less deprived areas also had higher happiness scores on average, with the mean score for the least deprived areas (7.02) higher than the two most deprived (6.31 and 6.11 respectively). However, when comparing happiness to a typical day before the Coronavirus pandemic, those in the most deprived areas were more likely to report being more happy (10%) than those in the two least deprived (4% and 2% respectively). Relatedly, those in the least deprived areas were more likely to be less happy (47%) compared to a typical day previously than those in the most deprived (36%).
Disabled respondents were more likely to report lower happiness levels; 10% reported a score of 0 (not happy at all) compared with 1% of non-disabled respondents. The mean score for those who were non-disabled was also higher (6.92) than for those with (5.52). Similarly, disabled respondents were more likely to be 'a lot less happy' (32%) compared to a typical day before the Coronavirus pandemic (16% of non-disabled respondents).
Happiness level yesterday compared to a typical day before the pandemic
Further analysis explored how respondents' happiness scores 'yesterday' related to their happiness levels compared to a typical day before the Coronavirus pandemic. Figure 8 below shows happiness level yesterday by whether respondents were more or less happy than on a typical day in March. In summary:
- The vast majority (78%) of those with 'very high' happiness (score of 9-10) felt 'about the same' compared to previously.
- Just over half (52%) of the 'high happiness' group (scores of 7-8) felt 'the same as usual', whilst just over a third were less happy than before, suggesting they may previously have been in the 'very high' group.
- The majority (61%) of those in the 'medium happiness' group (scores of 5-6) felt either a little or a lot less happy than usual.
- Those in the 'low happiness' group (scores of 0-4) were the most likely to say that they were a lot less happy than usual (75%). However, just under a quarter (23%) felt 'the same' or more happy compared to a typical day in March.
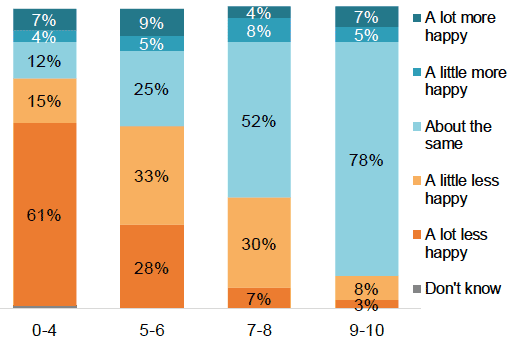
Base: All 0 - 4 (137) 5 - 6 (240) 7 - 8 (455) 9 - 10 (161)
Figure 8 Description
This bar chart shows the proportions of respondents within four happiness groups (Low 0-4, Medium 5-6, High 7-8 and Very high 9-10; based on a previous question) who indicated that they are ‘a lot more happy’, ‘a little more happy’, ‘about the same’, ‘a little less happy’, or ‘a lot less happy’ than they were before the pandemic. It shows that within the ‘Very high’ happiness group, 78% said their happiness was ‘about the same’ compared to 12% of the ‘Low’ happiness group. It also shows that within the ‘Low happiness’ group, 61% said they were ‘a lot less happy’ now than before the pandemic, compared to 3% of the ‘Very high’ happiness group.
Anxiety level 'yesterday'
Respondents were also asked how anxious they felt 'yesterday' on a scale of 0 to 10, where 0 is 'not at all anxious' and 10 is 'completely anxious'. As shown in Figure 9, a quarter (26%) gave a score of 0, whilst 5% gave a score of 1, both considered 'very low' levels of anxiety. At the other end of the scale, 3% reported a score of 10, 2% reported a score of 9, 9% reported a score of 7 and 8% gave a score of 6, all of which are considered to be 'high' anxiety.
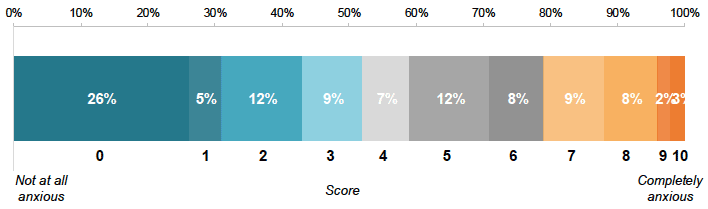
Base (1000)
Figure 9 Description
This horizontal bar chart shows the proportions of respondents who answered with a score of between 0 to 10 on a scale when 0 is ‘not anxious at all’ and 10 is ‘completely anxious’. It shows that the most common score given was 0 (26%), followed by 2 and 5 (both 12%).
As shown in Table 3, 29% of respondents reported high levels of anxiety (scores of 6-10), which is higher than in the 2018/19 ONS Annual Population Survey benchmark,[6] shown. The proportion reporting very low anxiety levels was also lower than the benchmark.[7]
| Anxiety score | Survey responses | ONS benchmark |
|---|---|---|
| Very low 0-1 | 31% | 42% |
| Low 2-3 | 21% | 23% |
| Medium 4-5 | 18% | 16% |
| High 6-10 | 29% | 20% |
Anxiety level compared to a typical day before the pandemic
Respondents were also asked how anxious they felt yesterday compared to a typical day before the Coronavirus pandemic. As shown in Figure 10, 40% of respondents felt more anxious than on a typical day previously, with 16% feeling a lot more anxious. However, around half (49%) of respondents said they felt 'about the same', while 11% said they felt less anxious than on a typical day previously.
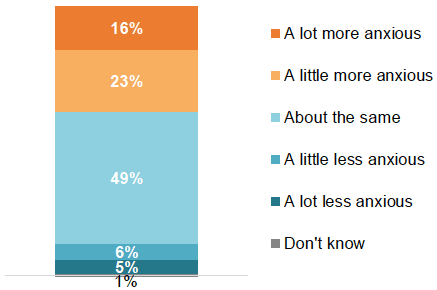
Base: All (1000)
Figure 10 Description
This bar chart shows the proportions of respondents who rated their anxiety levels now compared to before the pandemic, specifically, whether they indicated that they were ‘a lot more anxious’, ‘a little more anxious’, ‘about the same’, ‘a little less anxious’, ‘a lot less anxious’ or ‘don’t know’. It shows that the most common answer was ‘about the same’, for 49% of respondents, followed by ‘a little more anxious’, for 23% of respondents.
Subgroup differences - anxiety yesterday and before the pandemic
Women were more likely to be anxious than men, with men more likely to report a score of 0 ('not anxious at all') (30%) than women (22%). The mean anxiety score was also higher (more anxious) for women (4.05) than for men (3.01). Similarly, when comparing anxiety levels with a typical day before the Coronavirus pandemic, women were more likely to report being 'a lot more anxious' (20%) than men (13%), while men were more likely to report being 'about the same' (54%) than women (45%).
There were also differences by age group, with younger age groups more anxious than older age groups. In particular, those aged 70+ were more likely to report a score of 0 ('not anxious at all') (38%) than those in the three middle age groups; 25-34 (23%), 35-54 (22%) and 55-69 (27%). Those aged 25-34, 55-69 and 70+ were also more likely to report a score of 10 ('completely anxious') (5%, 4% and 5% respectively) than those aged 16-24 (0%).
When comparing anxiety levels with a typical day previously, those aged 25-34, 35-54 and 55-69 were more likely to say they were 'a lot more anxious' (18%, 20% and 17% respectively) than were those aged 70+ (7%). However, those aged 16-24, 25-34 and 35-54 were also more likely to say they were 'a little less anxious' (8%, 8% and 6% respectively) than were those aged 70+ (2%).
Those in the most deprived areas were also more likely to report a score of 10 ('completely anxious') (6%) than those in the second least deprived (1%). However, when comparing anxiety levels with previously, those in the most deprived areas were more likely to report being 'about the same' (60%) than those in the two least deprived areas (both 44%), as well as the second most deprived areas (also 44%). Conversely, those in the least deprived areas were more likely to report being 'a little more' anxious (34%) than those in the three most deprived areas (17%, 15% and 20% respectively).
Disabled respondents were also more likely to report a score of 10 ('completely anxious') (10%) than non-disabled respondents (1%). Furthermore, the mean anxiety score was higher (more anxious) for disabled respondents (4.51 compared with 3.30). Similarly, disabled respondents were more likely to report being 'a lot more anxious' compared to a typical day before the Coronavirus pandemic (22%) than non-disabled respondents (15%).
Anxiety level yesterday compared to a typical day before the pandemic
Further analysis explored how respondents' anxiety scores related to their perceived changed in anxiety compared to a typical day before the Coronavirus pandemic. Figure 11 below shows anxiety level yesterday by whether respondents were more or less anxious than on a typical day in March. In summary:
- The vast majority (86%) of the 'very low' anxiety group (score of 0-1), felt 'about the same' as previously.
- Just over half (51%) of those in the low anxiety group (score of 2-3) felt about the same as usual. However around a third were less happy than before, suggesting movement from the 'very low' group.
- The majority (64%) in the 'medium anxiety' group (score of 4-5) felt either a little or a lot more anxious than usual, although 13% felt less anxious.
- The majority (65%) of those in the high anxiety group (score of 6-10) felt more anxious than usual. However a quarter (24%) of the highly anxious group indicated that they usually feel this way, and 11% felt less anxious than usual.
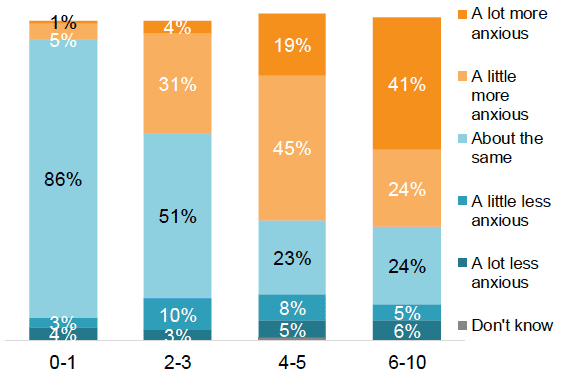
Base: All 0 - 1 (320) 2 - 3 (205) 4 - 5 (190) 6 - 10 (278)
Figure 11 Description
This bar chart shows the proportions of respondents within four anxiety groups (Low (‘Very low 0-1’, ‘Low 2-3’, ‘Medium 4-5’ and ‘High 6-10’; based on a previous question) who indicated that they are ‘a lot more anxious’, ‘a little more anxious’, ‘about the same’, ‘a little less anxious’, or ‘a lot less anxious’ than they were before the pandemic. It shows that within the ‘Very low’ anxiety group, 86% said their anxiety was ‘about the same’ compared to 24% of the ‘High’ anxiety group. It also shows that within the ‘High anxiety’ group, 41% said they were ‘a lot more anxious’ now than before the pandemic, compared to 1% of the ‘Very low’ anxiety group.
Loneliness
Respondents were asked how much of the time during the last week they felt lonely. As shown in Figure 12, the majority of respondents had not felt lonely, with 60% reporting 'none or almost none of the time'.
However, four in ten (40%) reported that they had felt lonely in the last week, with 5% feeling lonely 'all or almost all of the time' and 27% feeling lonely some of the time. Furthermore, the proportion who had felt lonely was higher compared with the benchmark figure from the 2018 Scottish Household Survey[8] (40% compared with 21%), shown below.
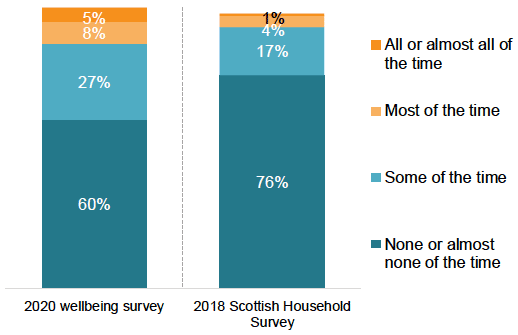
Base: All (1000), Scottish Household Survey (9700)
Figure 12 Description
This bar chart shows the proportions of respondents who reported having experienced loneliness in the past week ‘all or almost all of the time’, ‘most of the time’, ‘some of the time’ and ‘none or almost none of the time’, with breakdowns from the 2018 Scottish Household Survey (9700 respondents) as a benchmark comparison. It shows that 5% experienced loneliness ‘all or almost all of the time’ in the wellbeing survey, and 1% in 2019 SHS. It also shows that 60% did not experience loneliness in the wellbeing study, while this was 76% in the 2019 SHS sample.
Subgroup differences - loneliness
Men were more likely to report feeling lonely 'none or almost none of the time' (68%) than women (52%), while women were more likely to report feeling lonely 'some of the time' (33%) than men (20%).
Those in the youngest age group were more likely to be lonelier than older groups, with those aged 16-24 more likely to have experienced any loneliness (56%) than those aged 25-34 (42%), 35-54 (38%), 55-69 (36%) and 70+ (37%). Similarly, those aged 16-24 were more likely to say 'most of the time' or 'all or almost all of the time' (20%) than those aged 35-54 (10%) and 55-69 (9%).
Respondents in households with children were less likely to have experienced loneliness than those in households without children (34% and 42% respectively).
Those in the two most deprived areas were more likely to have experienced loneliness (49% and 46% respectively) compared with those in the least deprived (33%). Those in the most deprived areas were also more likely to report feeling lonely 'most of the time' (15%) than those in the two least deprived (5% and 6% respectively).
As shown in Figure 13, disabled respondents were more likely than non-disabled respondents to report feeling lonely 'some of the time' (34% compared with 25%), 'most of the time' (16% compared with 6%) and 'all or almost all of the time' (15% compared with 2%). Relatedly, non-disabled respondents were more likely to report 'none or almost none of the time' (67% compared with 35%).
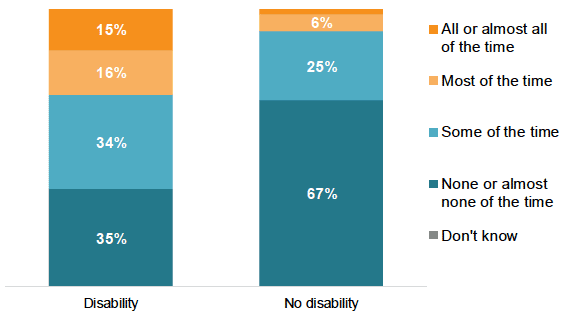
Base: Disabled (194) Non-disabled (797)
Figure 13 Description
This bar chart shows two groups (respondents with a disability, and with no disability) and the proportions within these groups who reported having experienced loneliness in the past week ‘all or almost all of the time’, ‘most of the time’, ‘some of the time’, ‘none or almost none of the time’ or answered ‘don’t know’. It shows that 67% of respondents with no disability did not experience loneliness, compared to 35% of respondents with a disability. It also shows that 34% of those with a disability experienced loneliness ‘some of the time’, compared to 25% of those without a disability.
Worries
Respondents were asked what their major worries are at the moment. As shown in Figure 14, the most common worry was friends or family becoming seriously ill with COVID-19 (75%). Around four in ten reported being worried about a friend or family's mental health (41%) or becoming seriously ill themselves with COVID-19 (37%), while a quarter reported being worried about their own mental health (26%) and their financial situation or losing their job (24%).
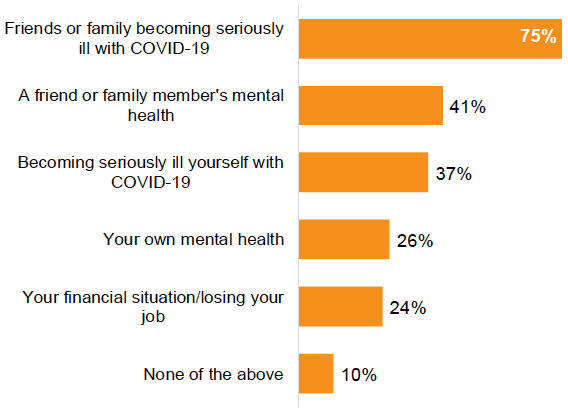
Base: All (1000)
Figure 14 Description
This bar chart shows the proportion of respondents worried about the following response options: ‘Friends or family becoming seriously ill with COVID-19’, ‘A friend or family member’s mental health’, ‘Becoming seriously ill yourself with COVID-19’, ‘Your own mental health’, ‘Your financial situation/ losing your job’, or ‘None of the above’. It shows that the most common worry is ‘Friends or family becoming seriously ill with COVID-19’, with 75% of respondents answering this, followed by ‘a friend or family member’s mental health’ which was chosen by 41% of respondents.
Subgroup differences - worries
Women were more likely than men to be worried about a friend or family member's mental health (47% compared with 34%), as well as their own mental health (30% compared with 23%). However, men were more likely to be worried about their financial situation or losing their job (28%) than women (20%).
As shown in Figure 15, those in the oldest age group (70+) were less likely to be worried about most issues than younger age groups, including friends or family becoming seriously ill with COVID-19 (62%, compared with 74-81%), a friend or family's mental health (20% compared with 34-51%) and their financial situation or losing their job (1% compared with 13-36%). However, those aged 55-69 were the most concerned about becoming seriously ill with COVID-19 (48% compared with 28-38% for other age groups).
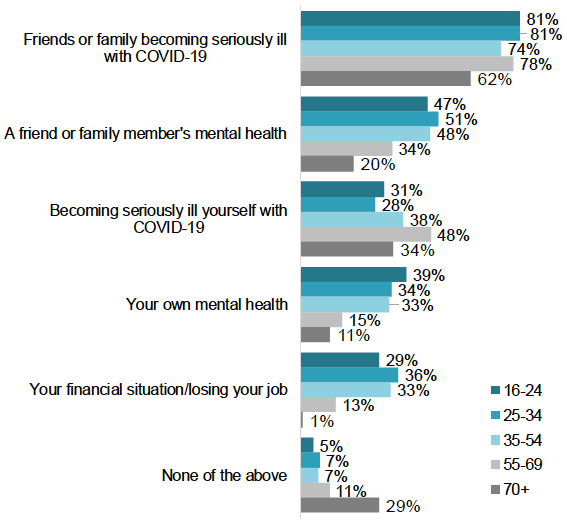
Base: 16-24 (127) 25-34 (150) 35-54 (325) 55-69 (255) 70+ (143)
Figure 15 Description
This bar chart shows the proportions of respondents worried about six different outcomes by age group (16-24, 25-34, 35-54, 55-69 and 70+). The concerns provided are: ‘Friends or family becoming seriously ill with COVID-19’, ‘A friend or family member’s mental health’, ‘Becoming seriously ill yourself with COVID-19’, ‘Your own mental health’, ‘Your financial situation/ losing your job’, or ‘None of the above’. It shows that 81% of 16-24 and 25-34 year olds are worried about ‘Friends or family becoming seriously ill with COVID-19’, compared to 62% of those aged 70+. It also shows that 48% of 55-69 are worried about ‘Becoming seriously ill with COVID-19 yourself’ compared to 28% of 25-34 year olds.
Those in households with children were more likely to be worried about a number of issues compared with those without children:
- Your financial situation/losing your job (31%, compared with 20%)
- Your own mental health (34%, compared with 23%)
- A friend or family member's mental health (54%, compared with 36%)
Those in the most deprived areas were more likely to be worried about their own mental health (32%) than those in the least deprived areas (22%).
Disabled respondents were more likely than non-disabled respondents to be worried about becoming seriously ill with COVID-19 (49% compared with 34%), as well as their own mental health (45% compared with 21%).
Worries and anxiety level 'yesterday'
The worries of those who reported feeling anxious were also explored. As shown in Figure 16, those who were highly anxious (score of 6-10) were more likely than those with low or medium anxiety levels (scores of 0-5) to be worried about:
- A friend or family member's mental health (51% compared with 37%)
- Becoming seriously ill themselves with COVID-19 (47% compared with 33%)
- Their own mental health (48% compared with 18%)
- Their financial situation or losing their job (33% compared with 20%).
Meanwhile, those with low or medium anxiety levels were more likely to say 'none of these' than those with high scores (13% compared with 4%).
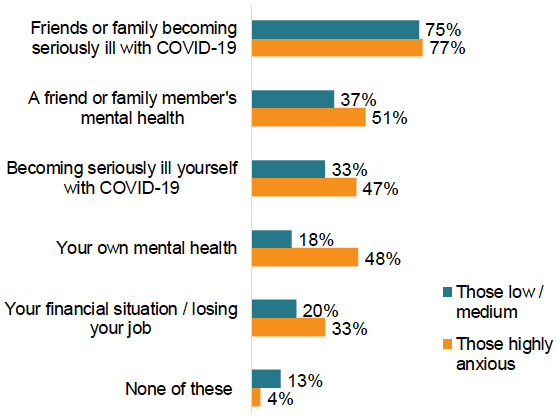
Base: All who were highly anxious (score of 6-10) (285) and those who were low / medium (709)
Figure 16 Description
This bar chart shows the proportions of respondents worried about six different outcomes by anxiety categories (‘Those low/ medium’ and ‘Those highly anxious’). The concerns provided are: ‘Friends or family becoming seriously ill with COVID-19’, ‘A friend or family member’s mental health’, ‘Becoming seriously ill yourself with COVID-19’, ‘Your own mental health’, ‘Your financial situation/ losing your job’, or ‘None of the above’. It shows that the most common worry is ‘Friends or family becoming seriously ill with COVID-19’, for 75% of those low/ medium anxious and 77% of those highly anxious.
Further concerns
Respondents were also asked if they were worried about anything else in relation to the coronavirus crisis and just under half (45%) were not concerned about anything further. As shown in Figure 17, around a fifth were worried about the economic impact (22%) and lack of contact with friends and family (20%), while 16% were worried about children's learning and education.
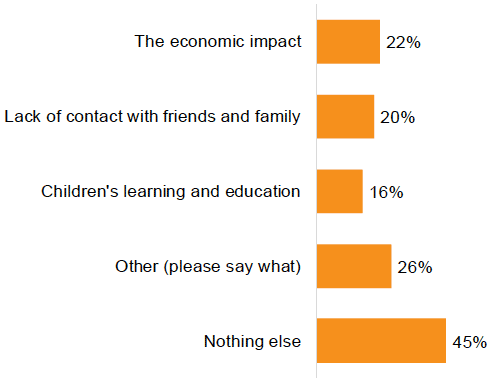
Base: All (1000)
Figure 17 Description
This bar chart shows the proportions of respondents who indicated that they were concerned about the following consequences of COVID-19: ‘The economic impact’, ‘Lack of contact with friends and family’, ‘Children’s learning and education’ ‘Other (please say what)’ or ‘Nothing else’. It shows that the most common response was ‘Nothing else’ (45%) followed by ‘Other’ (26%).
Subgroup differences - further concerns
Although the majority of respondents were not worried about anything else in relation to the Coronavirus crisis, women were more likely than men to be worried about lack of contact with friends and family (24% compared with 16%) and children's learning and education (19% compared with 13%).
Those aged 35-54 were also more likely to say the economic impact (29%) than those aged 25-34 (16%) and 70+ (18%). Those in the two least deprived areas were also more likely to say they were worried about this (28% and 26% respectively) than those in the most deprived (13%).
Those in households with children were more likely to be concerned about 'children's learning and education' than those in households without children (31%, compared with 11%).
Contact
Email: socialresearch@gov.scot