Housing Statistics For Scotland Quarterly Update (Published 14th June 2022)
A summary of activity in new build housing, affordable housing and long term empty properties and second homes in Scotland.
5. Social sector new housebuilding
Social sector housing consists of local authority and housing association housing, and has accounted for 29% of all new build homes completed over the 12 months to the end of September 2021.
Chart 8a shows the number of local authority and housing association homes started and completed each year to end September. Between 2008 and 2009 the number of housing association completions increased from around 3,800 to over 5,700, after which the number of homes completed dropped until reaching a low of around 2,500 in 2017. Following this, housing association completions increased after 2017, to just under 4,000 in 2019. Housing association completions then dropped to around 3,300 in 2020, then rose again to over 3,700 in the year to end September 2021.
Housing association new build approvals fell between 2009 and 2011, to a low of around 2,300, before rising year on year to around 5,500 in 2020. The latest year, the 12 months ending September 2021, has however seen a sharp fall to the lowest number of approvals since 2015, to under 3,100.
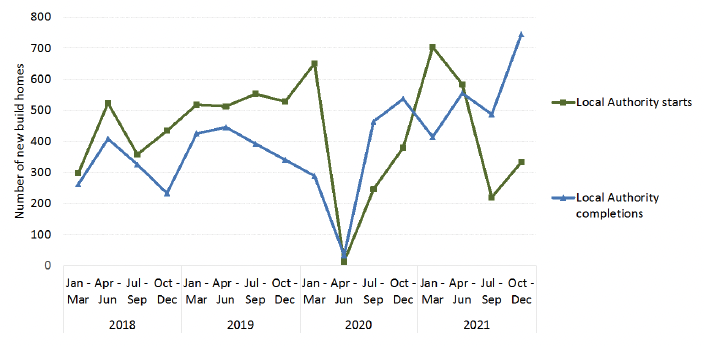
The number of local authority homes built gradually increased from under 100 homes in 2008 up to just over 1,200 in 2012 (years to end September). Completions then dropped slightly to just under 1,000 in 2014, after which they rose to almost 1,500 in 2019. COVID-19 restrictions saw completions fall to around 1,100 in 2020, with completions rising again to almost 2,000 in the year ending September 2021 after restrictions were lifted. Local authority new build starts have followed a generally similar pattern to that of completions, starting around 200 in 2008, and reaching almost 1,900 in 2021.
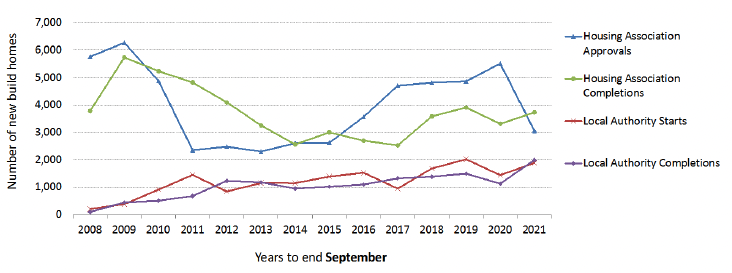
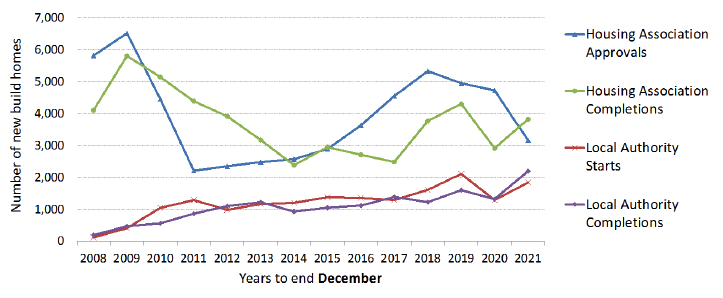
Chart 8b below shows the same figures but for years to end December.
| Social sector homes |
Total Social starts |
Total Social completions |
Local authority starts |
Local authority completions |
Housing association approvals |
Housing association completions |
|---|---|---|---|---|---|---|
| Jul - Sep 2018 |
826 |
1,344 |
358 |
326 |
468 |
1,018 |
| Jul - Sep 2019 |
1,299 |
1,300 |
553 |
392 |
746 |
908 |
| Jul - Sep 2020 |
730 |
1,011 |
246 |
464 |
484 |
547 |
| Jul - Sep 2021 |
1,088 |
1,649 |
220 |
487 |
868 |
1,162 |
| Change |
358 |
638 |
-26 |
23 |
384 |
615 |
| Change (%) |
49% |
63% |
-11% |
5% |
79% |
112% |
| Year to Sep-18 |
6,496 |
4,970 |
1,682 |
1,384 |
4,814 |
3,586 |
| Year to Sep-19 |
6,880 |
5,401 |
2,018 |
1,496 |
4,862 |
3,905 |
| Year to Sep-20 |
6,949 |
4,442 |
1,438 |
1,128 |
5,511 |
3,314 |
| Year to Sep-21 |
4,947 |
5,722 |
1,888 |
1,993 |
3,059 |
3,729 |
| Change |
-2,002 |
1,280 |
450 |
865 |
-2,452 |
415 |
| Change (%) |
-29% |
29% |
31% |
77% |
-44% |
13% |
A total of 1,649 social sector new build homes were completed between July to September 2021, an increase of 63% (638 homes) on the same quarter in 2020 which was affected by COVID-19 lockdown restrictions. This brings the total completions for the 12 months to end September 2021 to 5,722, an increase of 29% (1,280 homes) on the 4,442 social sector new build homes completed in the previous year.
Meanwhile, 1,088 social sector new build homes were started between July to September 2021. This is 49% (358 homes) higher than the same quarter the previous year. This brings the total for the 12 months to end September 2021 to 4,947, a decrease of 29% (2,002 homes) on the 6,949 social sector homes started in the same period in 2020.
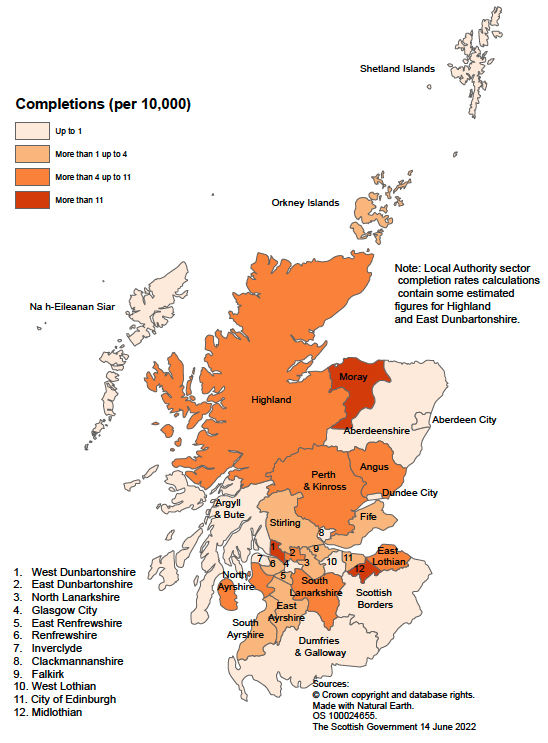
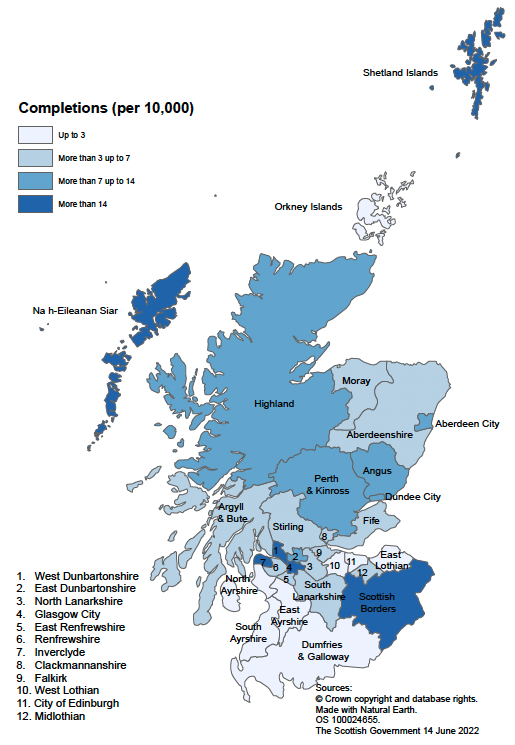
Maps C and D show the rates of housing association and local authority new build completions in each local authority for the year to end September 2021 per 10,000 of the population. The housing stock of 6 local authorities (Argyll & Bute, Dumfries & Galloway, Glasgow, Inverclyde, Na h-Eileanan Siar and Scottish Borders) has been transferred to housing associations and so these areas do not build new local authority houses.
In the year to end September 2021 local authority new build rates were highest in West Dunbartonshire and Moray and Midlothian, with rates over 11 homes per 10,000 households. As well as the 6 stock transfer authorities mentioned above, Aberdeen City, Aberdeenshire, Clackmannanshire, Dundee City, Shetland Islands, and West Lothian built no new local authority homes in the year ending September 2021.
Meanwhile rates of housing association new build completions were highest in Inverclyde, Scottish Borders, Shetland Islands, West Dunbartonshire, Nah-Eilian Siar, and Glasgow City, with rates of over 14 homes per 10,000 households. There were no completions in the Orkney Islands.
Charts 9 and 10 along with Table 5 show the latest quarterly figures for housing associations and local authorities to end December 2021.
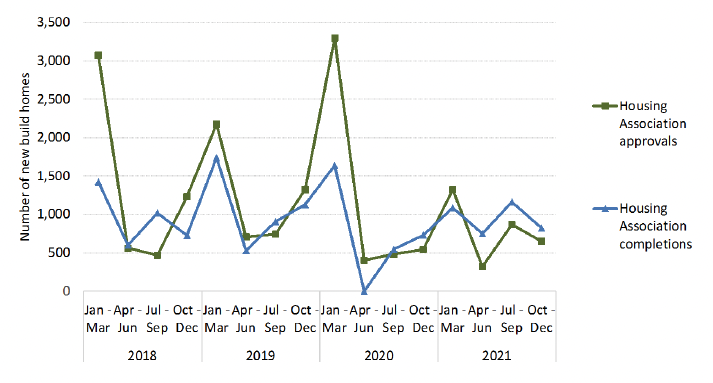
A total of 1,570 social sector new build homes were completed between October to December 2021, an increase of 24% (303 homes) on the 1,267 completions in the same quarter in 2020. This brings the total completions for the 12 months to end December 2021 to 6,025, an increase of 42% (1,178 homes) on the 4,240 social sector new build homes completed in the previous year.
Meanwhile, 984 social sector new build homes were started between October to December 2021. This is an increase of 6% (60 homes) compared to the same quarter in the previous year. This brings the total for the 12 months to end December 2021 to 5,007, a decrease of 17% (1,013 homes) on the 6,020 social sector homes started in the same period in 2020.
In the year to end December 2021, housing association new build completions are up by 31% (908 homes), local authority new build completions are up by 66% (877 homes) and local authority new build starts are up by 43% (551 homes). Housing association new build approvals have however fallen by 33% (1,564 homes).
| Social sector homes |
Total Social starts |
Total Social completions |
Local authority starts |
Local authority completions |
Housing association approvals |
Housing association completions |
|---|---|---|---|---|---|---|
| Oct - Dec 2018 |
1,667 |
961 |
434 |
233 |
1,233 |
728 |
| Oct - Dec 2019 |
1,853 |
1,469 |
528 |
341 |
1,325 |
1,128 |
| Oct - Dec 2020 |
924 |
1,267 |
380 |
537 |
544 |
730 |
| Oct - Dec 2021 |
984 |
1,570 |
333 |
745 |
651 |
825 |
| Change |
60 |
303 |
-47 |
208 |
107 |
95 |
| Change (%) |
6% |
24% |
-12% |
39% |
20% |
13% |
| Year to Dec-18 |
6,950 |
4,999 |
1,613 |
1,229 |
5,337 |
3,770 |
| Year to Dec-19 |
7,066 |
5,909 |
2,112 |
1,604 |
4,954 |
4,305 |
| Year to Dec-20 |
6,020 |
4,240 |
1,290 |
1,324 |
4,730 |
2,916 |
| Year to Dec-21 |
5,007 |
6,025 |
1,841 |
2,201 |
3,166 |
3,824 |
| Change |
-1,013 |
1,785 |
551 |
877 |
-1,564 |
908 |
| Change (%) |
-17% |
42% |
43% |
66% |
-33% |
31% |