Housing Statistics For Scotland Quarterly Update (Published 14th June 2022)
A summary of activity in new build housing, affordable housing and long term empty properties and second homes in Scotland.
2. All-sector new housebuilding
Chart 1 on page 1 shows that annual all-sector new build starts and completions in the years to end September both showed a broadly decreasing direction of trend following the financial crisis in 2008. Starts fell to a low in 2011 and completions reached their lowest point in 2013. Following this, starts and completions have then generally increased year on year, reaching a peak in 2019, before dropping due to the impact of COVID-19 lockdown measures in 2020.
Starts and completions have since picked up in 2021 following the easing of these restrictions, with starts up by 13% and completions up by 26% in the latest year to end September 2021, to stand at 21,666 and 20,056 homes respectively. Private-led completions rose by 25% (2,894 homes), local authority completions increased by 77% (865 homes), and housing association completions rose by 13% (415 homes). Increases were seen across private-led starts (37% or 4,478 homes) and local authority starts (31% or 450 homes), whilst housing association approvals fell by 44% or 2,452 homes).
Chart 2 below presents the latest quarterly trends in completions to end September 2021, in which there were 4,913 all-sector completions in the latest quarter July to September 2021. This is an increase of 23% (904 homes) on the 4,009 completions in the same quarter in 2020, but a decrease of 8% (439 homes) on the 5,352 completions in the same quarter in 2019.
The 3,264 private sector led completions in July to September 2021 is an increase of 9% (266 homes) on the 2,998 completions in the same quarter in 2020, but a decrease of 19% (788 homes) on the 4,052 completions in the same quarter in 2019.
The 487 local authority completions in July to September 2021 is an increase of 5% (23 homes) on the 464 completions in the same quarter in 2020, and an increase of 24% (95 homes) on the 392 completions in the same quarter in 2019.
Meanwhile the 1,162 housing association completions in July to September 2021 is an increase of over double (615 homes) on the 547 completions in the same quarter in 2020, and an increase of 28% (254 homes) on the 908 completions in the same quarter in 2019.
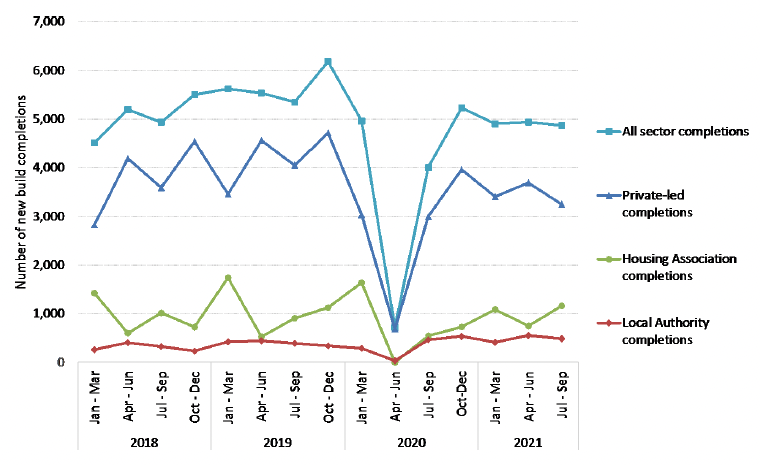
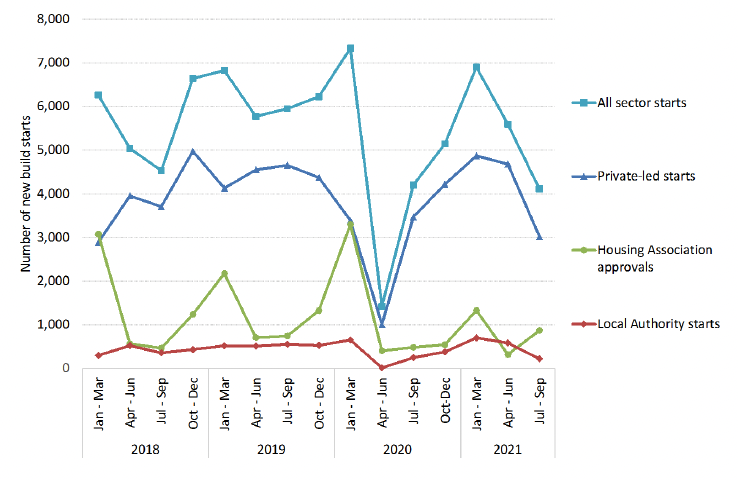
Chart 3 shows the quarterly trends in starts, in which there were 4,077 all-sector starts in the latest quarter July to September 2021. This is a decrease of 3% (123 homes) on the 4,200 completions in the same quarter in 2020, and a decrease of 32% (1,876 homes) on the 5,953 completions in the same quarter in 2019.
The 2,989 private sector led starts in July to September 2021 is a decrease of 14% (481 homes) on the 3,470 starts in the same quarter in 2020, and a decrease of 36% (1,665 homes) on the 4,654 starts in the same quarter in 2019.
The 220 local authority starts in July to September 2021 is a decrease of 11% (26 homes) on the 246 starts in the same quarter in 2020, and an fall of 60% (333 homes) on the 553 starts in the same quarter in 2019.
Meanwhile the 868 housing association approvals in July to September 2021 is an increase of 79% (384 homes) on the 484 approvals in the same quarter in 2020, and an increase of 16% (122 homes) on the 746 approvals in the same quarter in 2019
| All sector homes |
Starts |
Completions |
|---|---|---|
| Quarter Jul to Sep 2018 |
4,530 |
4,938 |
| Quarter Jul to Sep 2019 |
5,953 |
5,352 |
| Quarter Jul to Sep 2020 |
4,200 |
4,009 |
| Quarter Jul to Sep 2021 |
4,077 |
4,913 |
| Change from Q3 2020 to Q3 2021 |
-123 |
904 |
| Change from 2020 to 2021 (%) |
-3% |
23% |
| Year to Sep 2018 |
20,236 |
18,779 |
| Year to Sep 2019 |
25,188 |
22,019 |
| Year to Sep 2020 |
19,190 |
15,882 |
| Year to Sep 2021 |
21,666 |
20,056 |
| Change from 2020 to 2021 |
2,476 |
4,174 |
| Change from 2020 to 2021 (%) |
13% |
26% |
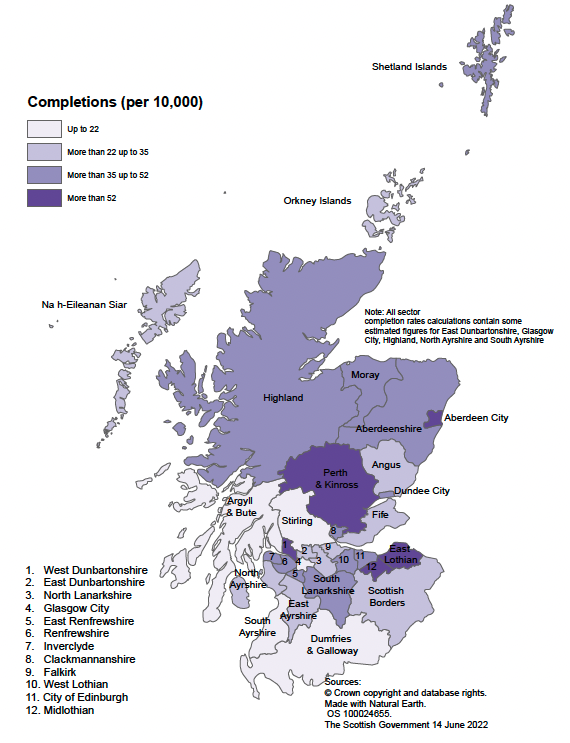
Map A below shows that in the year to end September 2021, the highest new build rates were observed in the local authority areas of Midlothian, Perth & Kinross, East Lothian, West Dunbartonshire and Aberdeen City, which had rates of more than 52 homes per 10,000 population.
The lowest rates were observed in South Ayrshire, Glasgow City, Stirling, and Dumfries & Galloway and Argyll and Bute, which had rates of 22 homes or fewer per 10,000 population.
Note that the all-sector completion rates calculations contain some estimated figures. Estimated figures have been used for private sector completions for East Dunbartonshire Council and South Ayrshire council from October to December 2020, Glasgow City Council from January to March 2021, and North Ayrshire for April to June 2021. Local authority completions are estimated for Highland from January to March 2021.
New housebuilding across UK countries
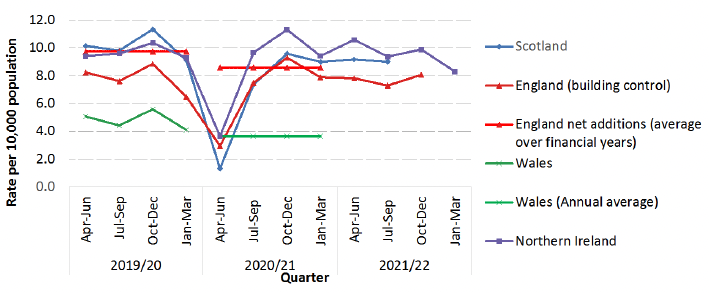
Chart 4a presents trends in the rates of new housebuilding per 10,000 population across each of the UK countries on a financial year basis (years to end March) to allow for comparisons with both the England financial year 'net additional dwelling' statistics and financial year rates derived from each of the quarterly UK series.
The England financial year 'net additional dwellings' series is considered the primary and most comprehensive measure of housing supply in England. The quarterly new build statistical collection for England is not currently capturing all new build activity, and so is seen more as a leading indicator of activity throughout the year.
This shows that whilst Scotland had a higher rate of completions per 10,000 head of population than England over the period 2006/07 to 2013/14, that Scotland and England have seen broadly similar rates of housebuilding each year across the period 2014/15 to 2019/20, when comparing the Scotland figures to the England net addition figures.
Whilst all four countries have seen a decrease from 2019/20 to 2020/21 due to the impacts of COVID-19, Scotland has seen a sharper fall in 2020/21, down to a rate of 27 homes per 10,000 population, which may be due to the stricter lockdown restrictions that were in place for housing building in Scotland.
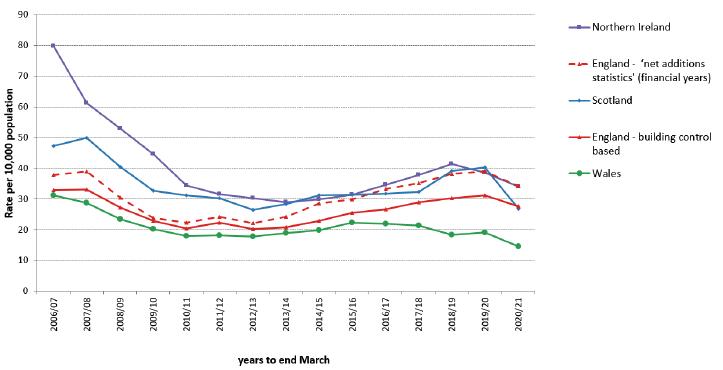
Chart 4b presents more recent trends in the rates of new housebuilding per 10,000 population across each of the UK countries on a quarterly basis[1], based on the latest published information available for each country. The England 'net additional dwelling' figures for the financial years 2019/20 and 2020/21 are also included as averages across each of the quarters within these years, to help demonstrate the difference in the relative level between this figure and the separate quarterly England building control based figures.
The chart shows the clear impact of COVID-19 lockdown restrictions on construction activity in the quarter April to June 2020, with the rates of new housebuilding per 10,000 population dropping compared to the same in quarter in the previous year by 87% in Scotland, 64% in England (building control based figures), and 61% in Northern Ireland, which may reflect stricter lockdown restrictions for Scottish housing building compared to England and Northern Ireland.
Following this, the rates of new housebuilding in each of these countries subsequently increased back up to higher levels, although the available quarterly rates for Scotland, England and Northern Ireland have shown a slight downward trend over the quarters following the October to December 2020 quarter.