Housing statistics quarterly update: December 2021
A summary of activity in new build housing, affordable housing and long term empty properties and second homes in Scotland.
6. Social sector new housebuilding
Note in this section that housing association new build approvals are used as a proxy for housing association new build starts due to data quality considerations, which is an approach consistent with that taken in previous publications.
Social sector housing consists of local authority and housing association housing, and has accounted for 28% of all new build homes completed over the 12 months to the end of December 2020.
Social sector figures are collected a quarter ahead of those for the private sector, meaning that figures are available up to the end of March 2021. However to enable easier understanding of how each sector contributes to the all sector totals described previously, some figures are also presented to end December 2020.
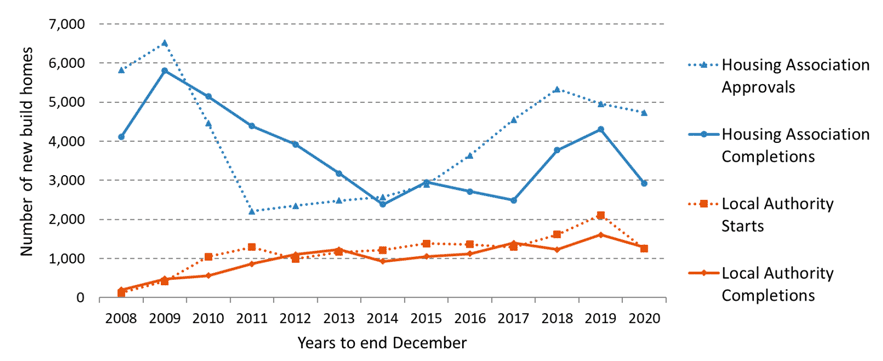
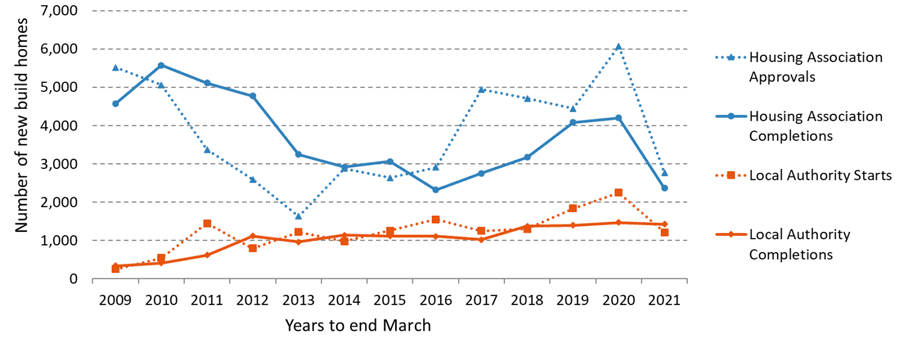
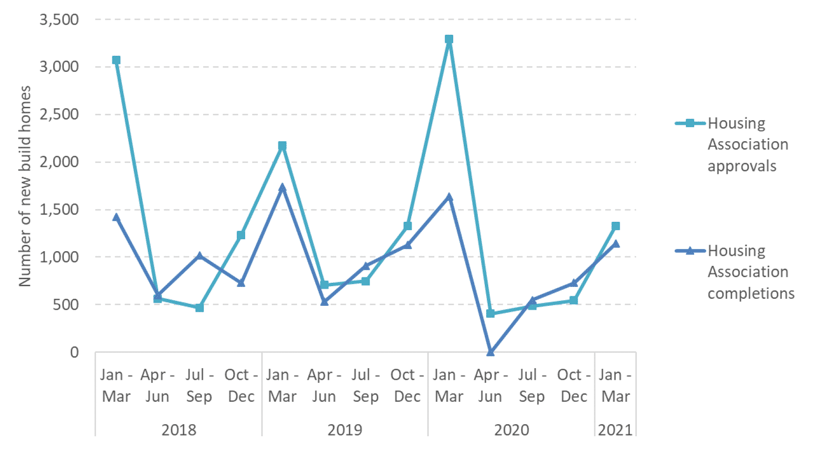
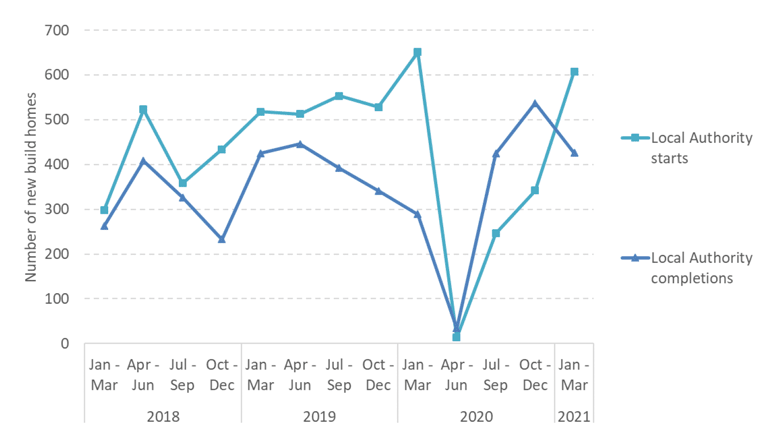
Chart 8a shows the number of local authority and housing association homes started and completed each year up to end December 2020, whilst Chart 8b shows the same information but up to end March 2021 (the most recent information available). Charts 9 and 10 show quarterly figures for housing associations and local authorities, respectively.
Between 2008 and 2009 (years to end December) the number of housing association completions increased from 4,100 to just over 5,800, after which the number of homes completed dropped in each year until reaching nearly 2,400 in 2014. After fluctuating around this level for the three years after this, housing association completions increased to just over 4,300 in 2019, before decreasing to 2,900 in 2020 due to the introduction of measures to reduce the spread of the coronavirus (COVID-19) from mid-March to late June 2020.
The number of local authority homes built gradually increased from just 195 homes in 2008 up to just over 1,100 in 2012 (years to end December). Completions were then broadly flat until 2017 where they reached nearly 1,400 homes. Similar levels were seen in 2018, after which the number of local authority homes completed increased to 1,600 before decreasing in the latest year to end December 2020 to 1,300 completions.
Figures for the year to end December 2020
There were 1,267 social sector completions between October and December 2020; a decrease of 14% (202 homes) on the same quarter in 2019. This brings the total for the year to end December 2020 to 4,200, a decrease of 29% (1,709 homes) on the 5,909 social sector completions in the previous year.
Meanwhile, 886 social sector homes were started between October and December 2020; a decrease of 52% (967 homes) on the same quarter in 2019. This brings the total for the year to end December 2020 to 5,982, which is a 15% decrease (1,084 homes) on the 7,066 social sector starts in the previous year.
| Social sector homes | Total Social starts | Total Social completions | Local authority starts | Local authority completions | Housing association approvals | Housing association completions |
|---|---|---|---|---|---|---|
| Oct to Dec-17 | 1,213 | 932 | 503 | 388 | 710 | 544 |
| Oct to Dec-18 | 1,667 | 961 | 434 | 233 | 1,233 | 728 |
| Oct to Dec-19 | 1,853 | 1,469 | 528 | 341 | 1,325 | 1,128 |
| Oct to Dec-20 | 886 | 1,267 | 342 | 537 | 544 | 730 |
| Change | -967 | -202 | -186 | +196 | -781 | -398 |
| Change (%) | -52% | -14% | -35% | +57% | -59% | -35% |
| Year to Dec-17 | 5,845 | 3,880 | 1,291 | 1,393 | 4,554 | 2,487 |
| Year to Dec-18 | 6,950 | 4,999 | 1,613 | 1,229 | 5,337 | 3,770 |
| Year to Dec-19 | 7,066 | 5,909 | 2,112 | 1,604 | 4,954 | 4,305 |
| Year to Dec-20 | 5,982 | 4,200 | 1,252 | 1,284 | 4,730 | 2,916 |
| Change | -1,084 | -1,709 | -860 | -320 | -224 | -1,389 |
| Change (%) | -15% | -29% | -41% | -20% | -5% | -32% |
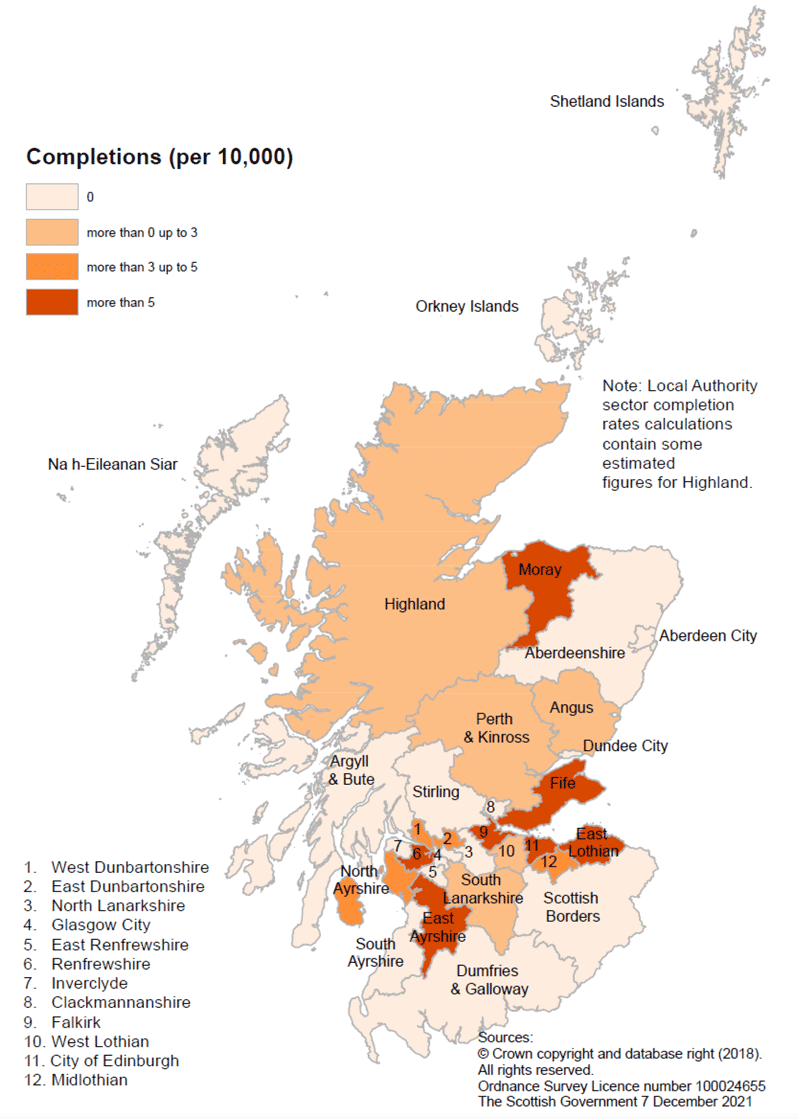
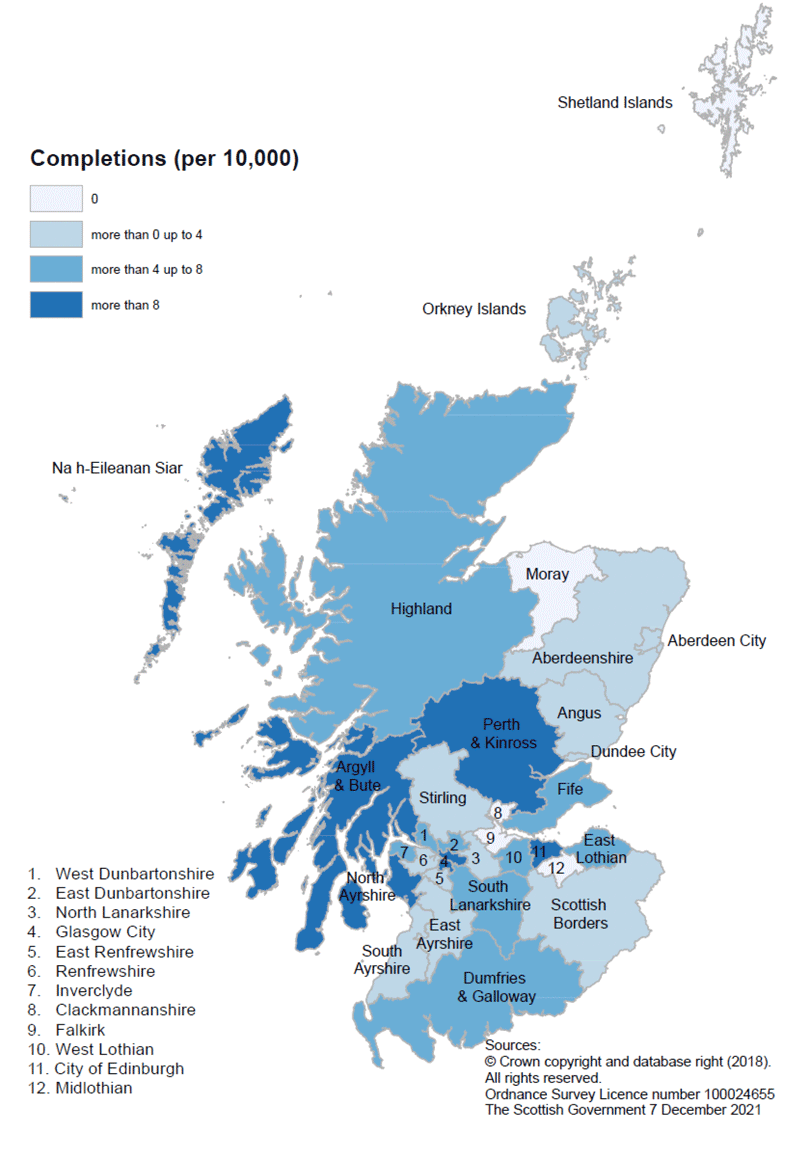
Sub-national local authority figures for the year to end December 2020
Maps C and D show the rates of housing association and local authority new build completions in each local authority for the year to end December 2020 per 10,000 of the population (based on the latest mid-2020 population estimates). The housing stock of 6 local authorities (Argyll & Bute, Dumfries & Galloway, Glasgow, Inverclyde, Na h-Eileanan Siar and Scottish Borders) has been transferred to housing associations and so these areas do not build new local authority houses.
It should be noted that the rates of social sector new housebuilding activity recorded will have been impacted by the introduction measures to reduce the spread of the coronavirus (COVID-19) from mid-March to late June, which will have impacted on the year to end December totals and new housebuilding rates.
Note that the social sector completion rates calculations contain some estimated figures. Estimated figures have been used for Highland Council local authority sector figures in October to December 2020.
In the year to end December 2020 local authority new build rates were highest in Moray, Renfrewshire, East Lothian, East Ayrshire, Fife and Falkirk. As well as the 6 stock transfer authorities mentioned above, Aberdeen City, Aberdeenshire, Clackmannanshire, Dundee City, East Renfrewshire, North Lanarkshire, Orkney Islands, Shetland Islands, South Ayrshire and Stirling built no new local authority homes in the year ending December 2020.
Meanwhile rates of housing association new build completions were highest in Na h-Eileanan Siar, Glasgow, North Ayrshire, Perth & Kinross and Edinburgh whilst the lowest rates of housing association new build completions were in Clackmannanshire, Falkirk, Midlothian, Moray and Shetland.
Latest figures to end March 2021
A total of 1,513 social sector homes were completed between January to March 2021, a decrease of 22% (415 homes) on the 1,928 completions in the same quarter in 2020. This brings the total completions for the 12 months to end March 2021 to 3,785, a decrease of 33% (1,887 homes) on the 5,672 social sector homes completed in the previous year.
Meanwhile, 1,935 social sector homes were started between January and March 2021. This is a decrease of 51% (2,014 homes) compared to the same quarter in the previous year. This brings the total for the 12 months to end March 2021 to 3,968, a decrease of 52% (4,353 homes) on the 8,321 social sector homes started in the same period in 2020.
| Social sector homes | Total Social starts | Total Social completions | Local authority starts | Local authority completions | Housing association approvals | Housing association completions |
|---|---|---|---|---|---|---|
| Jan to Mar-18 | 3,371 | 1,686 | 298 | 262 | 3,073 | 1,424 |
| Jan to Mar-19 | 2,694 | 2,165 | 518 | 425 | 2,176 | 1,740 |
| Jan to Mar-20 | 3,949 | 1,928 | 651 | 289 | 3,298 | 1,639 |
| Jan to Mar-21 | 1,935 | 1,513 | 608 | 426 | 1,327 | 1,087 |
| Change | -2,014 | -415 | -43 | +137 | -1,971 | -552 |
| Change (%) | -51% | -22% | -7% | +47% | -60% | -34% |
| Year to Mar-18 | 6,012 | 4,540 | 1,302 | 1,370 | 4,710 | 3,170 |
| Year to Mar-19 | 6,273 | 5,478 | 1,833 | 1,392 | 4,440 | 4,086 |
| Year to Mar-20 | 8,321 | 5,672 | 2,245 | 1,468 | 6,076 | 4,204 |
| Year to Mar-21 | 3,968 | 3,785 | 1,444 | 1,421 | 2,759 | 2,364 |
| Change | -4,353 | -1,887 | -801 | -47 | -3,317 | -1,838 |
| Change (%) | -52% | -33% | -36% | -3% | -55% | -44% |