Housing statistics quarterly update: December 2021
A summary of activity in new build housing, affordable housing and long term empty properties and second homes in Scotland.
5. UK House Price Index (HPI) new build sales transactions, as a measure of private-led housebuilding activity to end July 2021
This section sets out the latest quarterly and monthly trends in the number of new build sales transactions in Scotland to end July 2021, based on residential property transaction figures published as part of the UK House Price Index (HPI)[4].
These figures may be helpful in providing an indication of recent levels of private led new housebuilding activity, particularly given the current delay in the publication of the Scottish Government new housebuilding private-led starts and completions figures.[5]
It should be noted that the HPI-based figures are not directly comparable to the Scottish Government time series on private-led new build starts and completion, due to some differences in how the two sets of figures are constructed. For example, the UK HPI new build sales transaction figures are based on the date of the completed sales transaction rather than the date of completion, and will also not include self-build dwellings or homes built privately for tenures other than private sales.
Further information on the quality of the HPI data for Scotland, which is sourced from Registers of Scotland, is available in the UK HPI Quality Assurance section of the UK House Price Index web page.
Table 3 and Chart 7a below illustrate how the UK HPI figures compare to previously published Scottish Government Private sector-led completion figures in each quarter from January to March 2019 onwards, and also provide the latest trends seen in the UK HPI new build sales transactions figures across the two more recent quarters to January to June 2021.
It can be seen across the period January to March 2019 to October to December 2020 (the latest available quarterly figures for Scottish Government Private led completions) that both data series follow broadly similar trends in respect of increases or decreases compared to the previous quarter. The Scottish Government figures are higher in most quarters, but this is likely to be explained by differences in how the figures are constructed, given that some self-build dwellings or dwellings built privately for tenures other than private sales will be included, whereas the HPI figures are based on private sale transactions only.
| Quarter or year | HPI New Build Sales Transactions Volume | Scottish Government Private-led completions |
|---|---|---|
| Jan – Mar 2019 | 2,407 | 3,460 |
| Apr – Jun 2019 | 3,293 | 4,536 |
| Jul – Sep 2019 | 2,759 | 4,052 |
| Oct – Dec 2019 | 3,807 | 4,716 |
| Jan – Mar 2020 | 2,385 | 3,038 |
| Apr – Jun 2020 | 717 | 688 |
| Jul – Sep 2020 | 2,428 | 2,998 |
| Oct – Dec 2020 | 3,098 | 3,910 |
| Jan – Mar 2021 | 2,710 | Not available |
| Apr - Jun 2021 | 2,903 | Not available |
| Change from previous quarter | +193 | |
| Change (%) from previous quarter | +7% | |
| Change from same quarter in previous year | +2,186 | |
| Change (%) from same quarter in previous year | +305% | |
| 12 months Jul 2019 - Jun 2020 | 9,668 | 12,494 |
| 12 months Jul 2020 - Jun 2021 | 11,139 | Not available |
| Change from previous year | +1,471 | |
| Change (%) from previous year | +15% |
Note there were 882 transactions recorded in the most recent month of July 2021, which brings the total 12 month figure to end July 2021 to be 11,346, an increase of 1,746 (18%) on the previous year to end July 2020. Sources: UK House Price Index: reports - GOV.UK (www.gov.uk) (September 2021 data downloads) and Scottish Government Private Sector-led new build completions
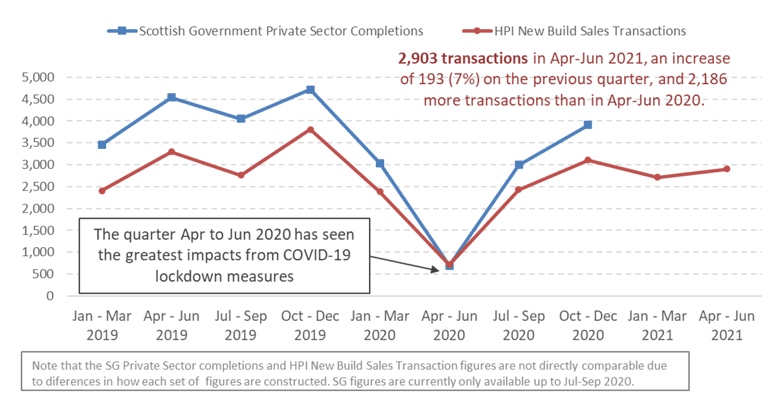
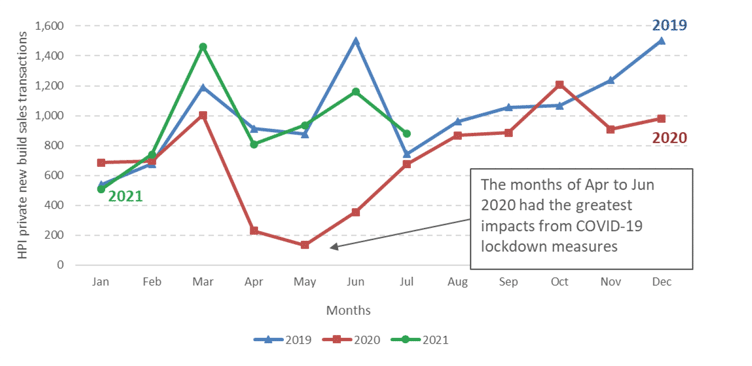
The latest quarterly HPI figures show that there were 2,903 new build sales transactions in Scotland in the quarter April to June 2021, an increase of 193 (7%) on the 2,710 transactions seen in January to March 2021, and an increase of 2,186 transactions on the 717 transactions seen in April to June 2020, a quarter in which housebuilding activity was largely paused due to lockdown measures.
More recent HPI figures for the month of July 2021 show a total of 882 transactions for this month (see Chart 7b). This brings the total transactions in the year to end July 2021 to 11,346, an increase of 18% (1,746 transactions) on the 9,600 transactions recorded in the year to end July 2020.